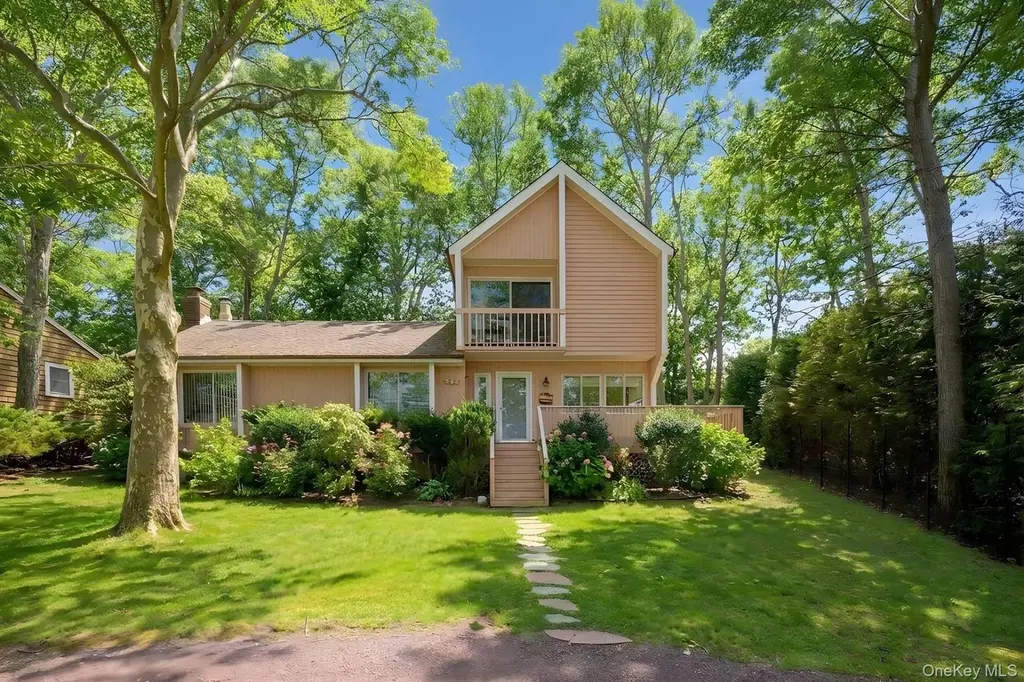
64 E Shore Rd · North Sea, NY
Flood risk No data
- FEMA flood zone
- —
- Chance of flooding over 30 yrs
- —
- Est. flood insurance / yr
- —
Fire risk No data
- Est. fire insurance / yr
- —
Heat risk No data
- Hot days now (above threshold)
- —
- Hot days in 30 yrs
- —
Wind risk No data
- Chance of severe wind over 30 yrs
- —
Air-quality risk No data
- Unhealthy air days now
- —
- Unhealthy air days in 30 yrs
- —
Risk factors via First Street. Map © Google.
Why this score? — see what drove the C- grade
The composite is a weighted blend of 9 inputs, each scored 0–100. Each bar is that input's sub-score; the figure is the points it added to the 100-point composite (weight × sub-score).
- Cash flow +19.5/30.0
- ARV discount +8.7/15.0
- DSCR +6.2/10.0
- 1% rule +5.2/10.0
- Rent growth +5.0/5.0
- Schools +4.8/10.0
- Livability +2.9/5.0
- Condition / age +2.5/5.0
- Appreciation +0.0/10.0
$1,495,000
🖨 Deal sheet (PDF) 📄 Offer letter ✓ Due diligence
Listing remarks MLS
Beach House with Peconic Bay Views Sited in a private beachfront community and across the street from bay beach access with views of Little Peconic Bay, is this wonderful beach house. Lived in year round by its owner, the home possesses everything needed for a beach lifestyle. Hear the waves, smell the salt air and relax! First floor, living room and den with water views, dining, kitchen with access to outdoor deck, full bath room and one bedroom. The upper level contains the oversized primary bedroom with sliding door to the deck over looking the bay and full bathroom. Nicely landscaped along with outdoor shower to wash off you day at the beach! Call today for an appointment!
Key facts
- Bay beach access
- Outdoor deck
- Outdoor shower
Tags
Neighborhood map
What this means for you Summary
Snapshot
- This is a 2-bed/2.0-bath single-family listed at $1.50M.
Deal economics
- At list price, monthly cash flow is $2k ($20k/yr) — positive.
- The deal already cash-flows at list — no discount required.
- Meets the 1% rule at list price ($15k rent vs $1.50M).
- Recommended offer: $1.41M (6.0% below list) — sets the bar for market timing.
Location & tenants
- Location reads 58/100 on livability (#1,063 in NY) — a working-class tenant base; expect higher turnover. Strengths: crime A+, employment A+; Watch: housing C-, amenities F, commute F.
- Southampton Union Free School District (suburban): math 53% / reading 51% proficiency, ranked #293 of 590 in NY (top 50%) — acceptable for families but not a draw, mixed tenant base, ~2y average lease.
- Zoned schools: Southampton Elementary School (math 42% / reading 57%, grade D, #1,085 of 2,108 statewide, top 56%, 376 students, 51% FRL); Southampton Intermediate School (math 30% / reading 47%, grade F, #437 of 729 statewide, top 60%, 363 students, 44% FRL); Southampton High School (math 98%, 595 students, 48% FRL) — zoned schools average 48% FRL vs 30% district-wide (17 pts higher); higher-poverty schools than district average — tighter screening recommended.
- Market conditions: Rents rising fast (+14.6%/yr); 96 active listings in the ZIP; 2 comparable units currently listed for rent nearby; high-income renter base; 1,366 units permitted in Suffolk County in 2024 (216 in 5+ unit buildings).
- At $15,212/mo this rent would consume 117% of the median local household income ($156k/yr) (locally 274% of renters already pay >50% of income on rent) — very limited rent-growth headroom before tenants either downsize or default.
Forward outlook
- Local home prices are declining (-3.0%/yr); year-one equity from $10k of loan paydown is wiped out by about $45k of value loss. Plan a longer hold.
- Suffolk County population projected to shrink 5% by 2050 — rents likely to lag national; underwrite the cash flow, not the appreciation.
- At projected returns (-3.0% appreciation + 8.0% rent growth), your $419k cash investment doubles in ~9 years — after that, you're playing with house money.
Negotiation context
- It's been on market 87 days — a 6% lower offer ($1.41M) is reasonable based on typical stale-listing flexibility.
Questions for the listing agent
- It's been on market 87 days. Have you received any prior offers? Is the seller open to a 6% concession, seller financing, or rate buy-down credit?
- Why hasn't it sold? Are there any deal-killer items the seller is aware of (foundation, flood, title, zoning, code violations)?
- Is there a deadline driving the sale (1031 exchange, divorce, estate, relocation)? That informs how much negotiation room exists.
- Schools are D-rated, which usually means shorter tenancies and higher turnover. Who's the typical renter profile here, and what's been the actual vacancy rate?
- What's the average days-on-market for RENTAL listings here right now (not sales)? A rising rental-DOM trend means longer vacancies and softer asking-rent achievability than the comps imply.
- What's the recent tenant-quality profile in this submarket — average credit score on applications, eviction rate, late-payment / NSF rate, and stable-employment percentage? A property-management company in the area should have these aggregated.
- How much new for-sale + rental construction is in the pipeline within 1–3 miles? Heavy new supply typically softens prices + rents 12–24 months out; constrained supply supports both.
Investment metrics
- 1% rule
- 1.02% ✓
- Cap rate
- 7.65%
- Cash-on-cash
- 4.83%
- DSCR
- 1.22
- GRM
- 8.2
CMA / ARV
- ARV (median comp)
- $1,534,515
- List price
- $1,495,000
- Delta
- -2.58%
- Verdict
- FAIR
- Comps
- 7 within 1.0 mi
Show comp detail 2 sales within ~0.75 mi
| Address | Dist | Beds/Ba | Sqft | Sold | Price | $/sf | Match |
|---|---|---|---|---|---|---|---|
| 40 Scrimshaw Dr | 0.41mi | 3/2.5 (+1) | 1,642 (-3%) | 1mo | $1,655,000 | $1,008 | 68 |
| 34 Scrimshaw Dr | 0.52mi | 3/2.0 (+1) | 1,649 (-3%) | 13mo | $1,395,000 | $846 | 55 |
Match score weights: distance 35% · size 25% · config 20% · recency 20%. Top-matched comps best support the ARV.
Projected returns pro-forma
-3.0% appreciation · 8.0% rent growth · sell at horizon
- IRR
- -3.3%
- Equity multiple
- 0.87×
- Total profit
- $-54,242
- Equity at exit
- $222,909
- IRR
- 11.3%
- Equity multiple
- 2.09×
- Total profit
- $457,884
- Equity at exit
- $129,260
Cash invested: $418,600 (down + closing). Projections, not guarantees.
Landlord ↔ Tenant lean methodology
- Overall (STATE)
- 15 Strongly Tenant-Friendly
- State New York
- 15 Strongly Tenant-Friendly · D+10
- County
- — inherits STATE
- City
- — inherits STATE
ZIP-level market 11968
- Home prices YoY
- -28.6%
- Rents YoY
- 14.6%
- Active inventory
- 96
- Price-to-rent
- 8.2×
Monthly cashflow live
- Estimated rent
- $15,212 medium interval (Pro) →
- Mortgage (P&I)
- −$7,840
- Tax est. 1.5%
- −$1,869 /mo · $22,425/yr
- Insurance
- −$623
- HOA
- −$0
- Vacancy / Maint / Mgmt
- −$3,195
- Net cashflow
- $1,686
Break-even live
Sensitivity live
| Price | -10% $2,719 | -5% $2,203 | +0% $1,686 | +5% $1,170 | +10% $653 |
|---|---|---|---|---|---|
| Rent | -10% $484 | -5% $1,085 | +0% $1,686 | +5% $2,287 | +10% $2,888 |
| Rate | -1.0pp $2,439 | -0.5pp $2,066 | base $1,686 | +0.5pp $1,299 | +1.0pp $905 |
UW: 25.0% down · 7.5% · 30yr · 1.5% tax · 5.0% vac · 8.0% maint · 8.0% mgmt
Financing live
Cash to close
- Down payment
- $373,750
- Closing costs
- $44,850
- Reserves months
- —
- Total cash needed
- —
Loan-product check · same deal, 3 products live
Conventional
25% down · 7.5% · 30yr
- Down + closing
- —
- Monthly P&I
- —
- Monthly cashflow
- —
- DSCR
- —
- Eligible?
- —
Personal DTI + credit; lowest rate.
DSCR
20% down · 8.5% · 30yr
- Down + closing
- —
- Monthly P&I
- —
- Monthly cashflow
- —
- DSCR
- —
- Eligible?
- —
No personal income docs; deal must DSCR.
Hard money
10% down · 12.0% · 12mo
- Down + closing
- —
- Monthly P&I
- —
- Monthly cashflow
- —
- DSCR
- —
- Eligible?
- —
Short-term bridge; refi at stabilization.
Rent comps 2 comps
| Address | Beds | Baths | Sqft | Rent | $/sqft | DOM | Units | Dist |
|---|---|---|---|---|---|---|---|---|
| 76 Peconic Hills Dr Southampton, NY | 3.0 | 2.5 | 2060 | $38,000 | $18.45 | 26d | 1 | 0.81mi |
| 2723 Deerfield Rd Sag Harbor, NY | 3.0 | 2.5 | 2000 | $15,000 | $7.50 | 45d | 1 | 1.01mi |
Listing history 17 events
-
2026-06-21days on market $1,495,000 Active 87 DOM
-
2026-06-18days on market $1,495,000 Active 84 DOM
-
2026-06-17days on market $1,495,000 Active 83 DOM
-
2026-06-16days on market $1,495,000 Active 82 DOM
-
2026-06-15days on market $1,495,000 Active 81 DOM
-
2026-06-13days on market $1,495,000 Active 79 DOM
-
2026-06-13days on market $1,495,000 Active 78 DOM
-
2026-06-09days on market $1,495,000 Active 75 DOM
-
2026-06-08days on market $1,495,000 Active 74 DOM
-
2026-06-07days on market $1,495,000 Active 73 DOM
-
2026-06-04days on market $1,495,000 Active 70 DOM
-
2026-06-03days on market $1,495,000 Active 69 DOM
-
2026-06-02remarks 690-char remark
-
2026-06-02days on market $1,495,000 Active 68 DOM
-
2026-06-01days on market $1,495,000 Active 67 DOM
-
2026-05-31days on market $1,495,000 Active 66 DOM
-
2026-03-26$1,495,000 Active 685-char remark
Show marketing remark (685 chars)
Beach House with Peconic Bay Views Sited in a private beachfront community and across the street from bay beach access with views of Little Peconic Bay, is this wonderful beach house. Lived in year round by its owner, the home possesses everything needed for a beach lifestyle. Hear the waves, smell the salt air and relax! First floor, living room and den with water views, dining, kitchen with access to outdoor deck, full bath room and one bedroom. The upper level contains the oversized primary bedroom with sliding door to the deck over looking the bay and full bathroom. Nicely landscaped along with outdoor shower to wash off you day at the beach! Call today for an appointment!
ⓘ Source: listings_history table (triggers on properties + properties_extension) + one-shot
backfill from property_details.listing_events for pre-trigger history.
Nearby sold comps map
Loading sold comps map…
Walkable amenities ~0.75 mi
Loading nearby amenities…
Taxation est. · year 1
- Rental income
- $182,548
- − Mortgage interest
- −$83,743
- − Property taxes
- −$22,425
- − Insurance
- −$7,475
- − Repairs & maintenance
- −$14,604
- − Management
- −$14,604
- − Depreciation
- −$43,491
- Taxable loss
- −$3,794
- Est. tax savings @ 24.0%
- +$911
- After-tax cash flow
- $21,144/yr
For passive investors: Depreciation is non-cash, so a rental often shows a tax loss while cash-flowing — sheltering income. Rental losses are passive: they offset passive income freely, and up to $25,000/yr can offset ordinary (W-2) income if you actively participate and your MAGI is under $100k (phasing out to $0 by $150k); unused losses carry forward. On sale, claimed depreciation is recaptured at up to 25%, and gains may owe capital-gains tax (a 1031 exchange can defer both). Figures are a year-1 estimate at your 24.0% rate — not tax advice; consult a CPA.
Schools (NCES district)
- District
- Southampton Union Free School District
- NCES district ID
- 3627540
- Math proficiency
- 53% ▬ 0.00%
- Reading proficiency
- 51% ▲ 4.00%
- Median HH income
- $85,977
- Composite
- 47.9/100
- National rank
- #2213
- State rank
- #293 of 590 in NY
Livability — North Sea
- Score
- 58/100
- State rank
- #1063
- US rank
- #21178
Category grades
Schools grade is shown separately in the Schools card above.
Census & demographics
- Census place
- North Sea, NY
- County
- Suffolk County · 679,920 people
- Metro
- New York-Newark-Jersey City, NY-NJ-PA
- Population (ZIP)
- 15,312
- Household income
- $156,219
- Rent vs Own
- Severe rent burden
- 274.0
Population outlook (Suffolk County) Hauer SSP2
- Today (2025)
- 1,505,262 people
- By 2030
- 1,498,318 · -0.5%
- By 2040
- 1,471,101 · -2.3%
- By 2050
- 1,424,848 · -5.3%
- By 2075
- 1,337,157 · -11.2%
- By 2100
- 1,217,720 · -19.1%
Race, ethnicity, and origin ACS 2023
- Neighborhood character
- Predominantly White (71%)
- Race & ethnicity
- White 71% Hispanic / Latino 13% Two or more races 10% Black 9% Asian 3% Native American 2%
- Hispanic origin (detail)
- Mexican 3% Puerto Rican 2%
- Common ancestry
- Romanian 5% Scotch-Irish 2% Danish 2%
- Foreign-born
- 15% · Canada, Jamaica, Vietnam
- Languages at home
- 81% English-only · Spanish 11% Other Indo-European 3% German/W. Germanic 2%
Political lean MEDSL · Suffolk
- 2024 margin
- Lean R (+10.0) · D 45.0% · R 55.0%
- 2008→2024 swing
- -16.0pp toward R · 2008: 6.0pp · 2024: -10.0pp
- All cycles
- 2024: R+10.0 2020: R+0.0 2016: R+8.2 2012: D+2.9 2008: D+6.0
Not yet ingested
- Civics
- —
Market trends
- HPI YoY
- ▼ -184.86%
- Current HPI
- 461.1144
- Rent YoY
- ▲ 14.62%
- Metro
- New York-Newark-Jersey City, NY-NJ-PA
- State GDP YoY
- ▲ 2.60%
- F500 in state
- 92
Industry mix (Fortune 500 HQ in NY)
| Industry | F500 HQs | Revenue |
|---|---|---|
| Financial Services | 10 | $950B |
|
||
| Consumer Goods | 9 | $162B |
|
||
| Insurance | 4 | $225B |
|
||
| Telecommunications | 2 | $144B |
|
||
| Pharmaceuticals | 2 | $112B |
|
||
| Media / Entertainment | 2 | $69B |
|
||
Price history
1 event — show timeline
- 2026-03-26 Listed $1,495,000 OneKey® MLS as Distributed by MLS Grid
Property tax history
+0.6%/yrLatest (2024): $2,759 · +0.0% YoY. Source: county tax records.
Cash-flow waterfall
monthlySold comps — $/sqft
last 12 mo · ≤1 miLoading sold comps…