128 1/2 Valley St · Salem, WV
Flood risk 7/10 · Major
- FEMA flood zone
- X (unshaded)
- Chance of flooding over 30 yrs
- 0.76%
- Est. flood insurance / yr
- $507 – $1,088
Fire risk 3/10 · Minor
- Est. fire insurance / yr
- $787 – $1,461
Heat risk 4/10 · Minor
- Hot days now (above 97°F)
- 7 days/yr
- Hot days in 30 yrs
- 19 days/yr
Wind risk 1/10 · Minimal
- Chance of severe wind over 30 yrs
- 1.0%
Air-quality risk 2/10 · Minimal
- Unhealthy air days now
- 0 days/yr
- Unhealthy air days in 30 yrs
- 1 days/yr
Risk factors via First Street. Map © Google.
Why this score? — see what drove the B grade
The composite is a weighted blend of 9 inputs, each scored 0–100. Each bar is that input's sub-score; the figure is the points it added to the 100-point composite (weight × sub-score).
- Cash flow +30.0/30.0
- 1% rule +10.0/10.0
- DSCR +10.0/10.0
- Appreciation +6.9/10.0
- ARV discount +6.3/15.0
- Livability +3.3/5.0
- Schools +3.0/10.0
- Rent growth +2.5/5.0
- Condition / age +2.2/5.0
$50,000
🖨 Deal sheet (PDF) 📄 Offer letter ✓ Due diligence
Listing remarks
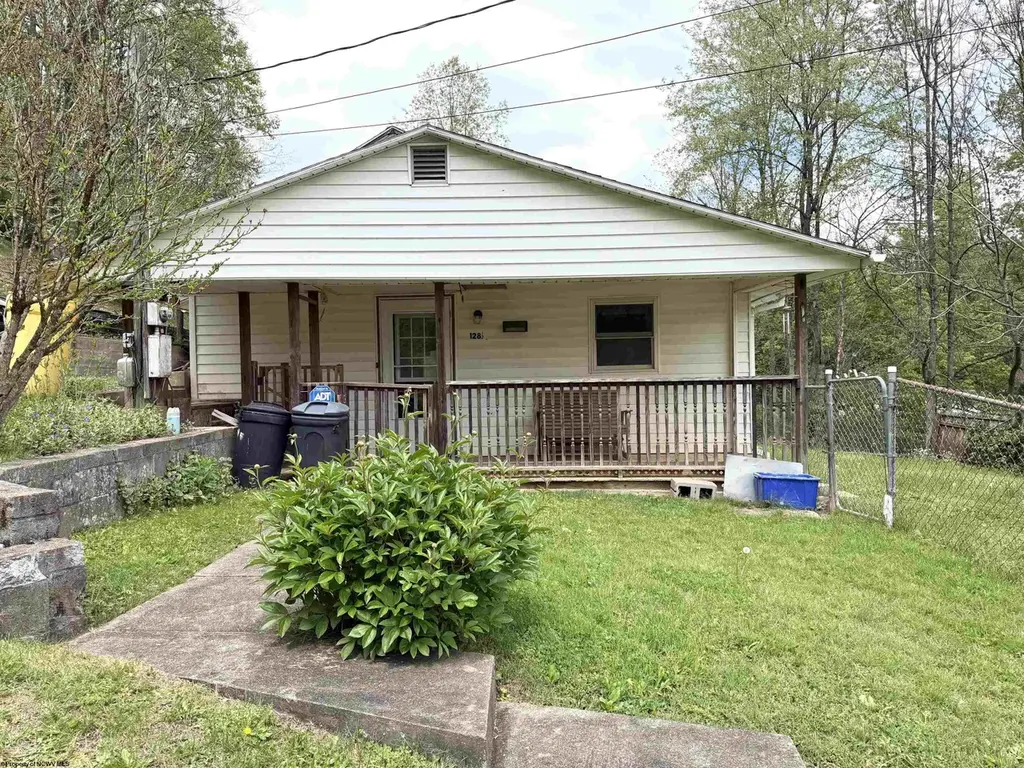
Positioned in the heart of town, this unique property features four spacious lots offering endless possibilities and room to grow. The existing home is full of potential and ready for your personal touch, with two bedrooms and the option for a third, while a former homesite across the driveway provides additional opportunity with utilities already in place. An oversized carport offers ample space for parking vehicles of all sizes, and a detached garage with a workshop sits conveniently beside the home, perfect for storage, hobbies, or projects. Located just minutes from Rt. 50 and everyday conveniences, this property combines versatility, space, and a prime in-town location—don’
Key facts
- Four spacious lots
- Oversized carport
- Workshop
Tags
Property features AI
Exterior
- Parking: Detached garage; Off-street and on-street parking; 1 garage space
- Security: Smoke detector(s)
- Utilities: Public water; Public sewer
- Home design: Single-family residence; One story; Residential property
- Construction: Frame construction with vinyl siding; Shingle roof
- Exterior features: Deck; Chain link and wood fencing; Level, sloped and wooded lot
Interior
- Kitchen: Range
- Flooring: Laminate flooring; Vinyl flooring; Wood flooring
- Bathrooms: 1 full bathroom
- Heating & cooling: Natural gas heating; Has heating
- Interior features: Range included; Crawl space basement; Six total rooms
Neighborhood map
What this means for you Summary
Snapshot
- This is a 2-bed/1.0-bath single-family listed at $50k. Condition is rated fair.
Deal economics
- At list price, monthly cash flow is $396 ($5k/yr) — positive.
- The deal already cash-flows at list — no discount required.
- Meets the 1% rule at list price ($1k rent vs $50k).
- Recommended offer: $48k (3.0% below list) — sets the bar for market timing.
Location & tenants
- Location reads 66/100 on livability (#106 in WV) — a middle-class / working-renter tenant base. Strengths: crime A+, cost of living A+, housing A+; Watch: health & safety C-, amenities F, commute F.
- Harrison County Schools (town): math 29% / reading 43% proficiency, ranked #12 of 55 in WV (top 22%) — families likely to look elsewhere, expect single-tenant / working-renter base with shorter leases.
- Zoned schools: Salem Elementary (math 52% / reading 47%, grade D, #49 of 377 statewide, top 16%, 189 students, 0% FRL); Mountaineer Middle School (math 25% / reading 37%, grade F, #55 of 109 statewide, top 51%, 361 students, 0% FRL); Lincoln High School (math 17% / reading 37%, grade F, #79 of 110 statewide, top 78%, 548 students, 0% FRL) — zoned schools average 0% FRL vs 43% district-wide (43 pts lower); this property's tenant base skews higher-income than the district average.
- Market conditions: 12 active listings in the ZIP; 84 units permitted in Harrison County in 2024 (5 in 5+ unit buildings).
Forward outlook
- In year one you build about $2k of equity ($346 loan paydown + $2k appreciation (3.8% local appreciation)).
- Harrison County population projected at -11% by 2050 — secular population decline; favor cash flow + early exit over multi-decade hold.
- At projected returns (3.8% appreciation + 3.0% rent growth), your $14k cash investment doubles in ~2 years — after that, you're playing with house money.
Negotiation context
- It's been on market 45 days — a 3% lower offer ($48k) is reasonable based on typical stale-listing flexibility.
Risks & watch-outs
- Watch-outs: flood insurance adds $66/mo.
- Climate carrying-cost: major flood risk — expect insurance premiums to compound above CPI over the hold.
Questions for the listing agent
- It's been on market 45 days. Have you received any prior offers? Is the seller open to a 3% concession, seller financing, or rate buy-down credit?
- Have any recent inspections been done? Can we get a copy of the seller's disclosures and any deferred-maintenance estimates?
- Built in 1963 — when were the roof, HVAC, electrical panel, plumbing, and water heater last replaced?
- What's the actual annual flood-insurance premium (NFIP or private), and is the property in a SFHA with mandatory coverage?
- Is there a deadline driving the sale (1031 exchange, divorce, estate, relocation)? That informs how much negotiation room exists.
- Schools are F-rated, which usually means shorter tenancies and higher turnover. Who's the typical renter profile here, and what's been the actual vacancy rate?
- What's the average days-on-market for RENTAL listings here right now (not sales)? A rising rental-DOM trend means longer vacancies and softer asking-rent achievability than the comps imply.
- What's the recent tenant-quality profile in this submarket — average credit score on applications, eviction rate, late-payment / NSF rate, and stable-employment percentage? A property-management company in the area should have these aggregated.
- How much new for-sale + rental construction is in the pipeline within 1–3 miles? Heavy new supply typically softens prices + rents 12–24 months out; constrained supply supports both.
Investment metrics
- 1% rule
- 2.04% ✓
- Cap rate
- 17.38%
- Cash-on-cash
- 39.60%
- DSCR
- 2.76
- GRM
- 4.1
CMA / ARV
- ARV (on-the-fly)
- $48,672
- Comps found
- 5
Show comp detail 5 sales within ~0.75 mi
| Address | Dist | Beds/Ba | Sqft | Sold | Price | $/sf | Match |
|---|---|---|---|---|---|---|---|
| 115 Valley St | 0.09mi | 3/2.0 (+1) | 1,104 (-12%) | 8mo | $188,000 | $170 | 61 |
| 73 Walnut St | 0.53mi | 3/1.0 (+1) | 1,199 (-4%) | 7mo | $35,000 | $29 | 57 |
| 71 Oak St | 0.55mi | 3/1.5 (+1) | 1,147 (-8%) | 21mo | $45,000 | $39 | 36 |
| 245 E Main St | 0.70mi | 3/2.0 (+1) | 1,282 (+3%) | 22mo | $40,000 | $31 | 35 |
| 121 Wilson Addition Rd | 0.74mi | 3/1.5 (+1) | 1,320 (+6%) | 23mo | $157,000 | $119 | 29 |
Match score weights: distance 35% · size 25% · config 20% · recency 20%. Top-matched comps best support the ARV.
Projected returns pro-forma
3.8% appreciation · 3.0% rent growth · sell at horizon
- IRR
- 40.9%
- Equity multiple
- 3.39×
- Total profit
- $33,416
- Equity at exit
- $24,762
- IRR
- 40.1%
- Equity multiple
- 6.80×
- Total profit
- $81,173
- Equity at exit
- $40,038
Cash invested: $14,000 (down + closing). Projections, not guarantees.
Landlord ↔ Tenant lean methodology
- Overall (STATE)
- 83 Strongly Landlord-Friendly
- State West Virginia
- 83 Strongly Landlord-Friendly · R+22
- County
- — inherits STATE
- City
- — inherits STATE
ZIP-level market 26426
- Home prices YoY
- 2.2%
- Active inventory
- 12
- Price-to-rent
- 4.1×
Monthly cashflow live
- Estimated rent
- $1,022 medium interval (Pro) →
- Mortgage (P&I)
- −$262
- Tax est. 1.5%
- −$62 /mo · $750/yr
- Insurance
- −$21
- Flood insurance flood zone
- −$66 /mo · $798/yr
- HOA
- −$0
- Vacancy / Maint / Mgmt
- −$215
- Net cashflow
- $396
Break-even live
Sensitivity live
| Price | -10% $430 | -5% $413 | +0% $396 | +5% $378 | +10% $361 |
|---|---|---|---|---|---|
| Rent | -10% $315 | -5% $355 | +0% $396 | +5% $436 | +10% $476 |
| Rate | -1.0pp $421 | -0.5pp $408 | base $396 | +0.5pp $383 | +1.0pp $369 |
UW: 25.0% down · 7.5% · 30yr · 1.5% tax · 5.0% vac · 8.0% maint · 8.0% mgmt
Financing live
Cash to close
- Down payment
- $12,500
- Closing costs
- $1,500
- Reserves months
- —
- Total cash needed
- —
Loan-product check · same deal, 3 products live
Conventional
25% down · 7.5% · 30yr
- Down + closing
- —
- Monthly P&I
- —
- Monthly cashflow
- —
- DSCR
- —
- Eligible?
- —
Personal DTI + credit; lowest rate.
DSCR
20% down · 8.5% · 30yr
- Down + closing
- —
- Monthly P&I
- —
- Monthly cashflow
- —
- DSCR
- —
- Eligible?
- —
No personal income docs; deal must DSCR.
Hard money
10% down · 12.0% · 12mo
- Down + closing
- —
- Monthly P&I
- —
- Monthly cashflow
- —
- DSCR
- —
- Eligible?
- —
Short-term bridge; refi at stabilization.
Listing history 18 events
-
2026-06-21days on market $50,000 Active 45 DOM
-
2026-06-19days on market $50,000 Active 43 DOM
-
2026-06-18days on market $50,000 Active 42 DOM
-
2026-06-17days on market $50,000 Active 41 DOM
-
2026-06-16days on market $50,000 Active 40 DOM
-
2026-06-15days on market $50,000 Active 39 DOM
-
2026-06-14days on market $50,000 Active 37 DOM
-
2026-06-12days on market $50,000 Active 36 DOM
-
2026-06-09days on market $50,000 Active 33 DOM
-
2026-06-08days on market $50,000 Active 32 DOM
-
2026-06-07days on market $50,000 Active 31 DOM
-
2026-06-05days on market $50,000 Active 28 DOM
-
2026-06-03days on market $50,000 Active 27 DOM
-
2026-06-02days on market $50,000 Active 26 DOM
-
2026-06-01days on market $50,000 Active 25 DOM
-
2026-05-31days on market $50,000 Active 24 DOM
-
2026-05-30days on market $50,000 Active 23 DOM
-
2026-05-07$50,000 Active
ⓘ Source: listings_history table (triggers on properties + properties_extension) + one-shot
backfill from property_details.listing_events for pre-trigger history.
Climate risk First Street
- Flood 7/10 Severe FEMA zone X (unshaded) · 76% chance over 30 yrs
- Wildfire 3/10 Moderate
- Heat 4/10 Moderate 7 d/yr ≥97°F today · 19 d/yr by 30 yrs out
- Wind 1/10 Low 100% chance of damaging wind over 30 yrs
- Air quality 2/10 Low 0 unhealthy d/yr today · 1 by 30 yrs out
Nearby sold comps map
Loading sold comps map…
Walkable amenities ~0.75 mi
Loading nearby amenities…
Taxation est. · year 1
- Rental income
- $12,267
- − Mortgage interest
- −$2,801
- − Property taxes
- −$750
- − Insurance
- −$1,048
- − Repairs & maintenance
- −$981
- − Management
- −$981
- − Depreciation
- −$1,455
- Taxable income
- $4,251
- Est. tax owed @ 24.0%
- −$1,020
- After-tax cash flow
- $3,726/yr
For passive investors: Depreciation is non-cash, so a rental often shows a tax loss while cash-flowing — sheltering income. Rental losses are passive: they offset passive income freely, and up to $25,000/yr can offset ordinary (W-2) income if you actively participate and your MAGI is under $100k (phasing out to $0 by $150k); unused losses carry forward. On sale, claimed depreciation is recaptured at up to 25%, and gains may owe capital-gains tax (a 1031 exchange can defer both). Figures are a year-1 estimate at your 24.0% rate — not tax advice; consult a CPA.
Condition & rehab AI · 13 photos
This home requires moderate renovations to improve its condition and increase its value. Key areas for improvement include the kitchen, bathroom, roof, exterior siding, and HVAC system.
Repairs flagged
- Moderate kitchen cabinets — dated and in need of replacement
- Moderate bathroom fixtures — dated and in need of replacement
- Moderate roof — visible wear and potential leaks
- Moderate exterior siding — weathered and in need of repainting
Value-add opportunities
- Resale new kitchen cabinets and countertops — modernizing the kitchen and improving functionality
- Resale new bathroom fixtures and vanity — modernizing the bathroom and improving functionality
- Resale new roof — improving the home's curb appeal and reducing maintenance costs
- Resale new exterior siding and paint — improving the home's curb appeal and reducing maintenance costs
- Both HVAC system upgrade — improving comfort and energy efficiency
Renovation cost estimate screening
| Repair item | Severity | Est. cost |
|---|---|---|
| kitchen cabinets · dated and in need of replacement | Moderate | $3,000–15,000 |
| bathroom fixtures · dated and in need of replacement | Moderate | $3,000–15,000 |
| roof · visible wear and potential leaks | Moderate | $3,000–15,000 |
| exterior siding · weathered and in need of repainting | Moderate | $3,000–15,000 |
| Total estimated repair cost · 4 items | $12,000–60,000 |
Value-add ROI direction
- Resale new kitchen cabinets and countertops — modernizing the kitchen and improving functionality ↑
- Resale new bathroom fixtures and vanity — modernizing the bathroom and improving functionality ↑
- Resale new roof — improving the home's curb appeal and reducing maintenance costs ↑
- Resale new exterior siding and paint — improving the home's curb appeal and reducing maintenance costs ↑
- Both HVAC system upgrade — improving comfort and energy efficiency ↑
ⓘ Cost ranges are severity-bucket heuristics (US national rule-of-thumb). Get contractor quotes + a written scope before underwriting a rehab budget.
Schools (NCES district)
- District
- Harrison County Schools
- NCES district ID
- 5400510
- Math proficiency
- 29% ▼ -10.00%
- Reading proficiency
- 43% ▼ -3.00%
- Median HH income
- $43,269
- Composite
- 30.48/100
- National rank
- #6222
- State rank
- #12 of 55 in WV
Livability — Salem
- Score
- 66/100
- State rank
- #106
- US rank
- #11585
Category grades
Schools grade is shown separately in the Schools card above.
Census & demographics
- Census place
- Salem, WV
- City population
- 7,302
- Population (ZIP)
- 7,302
Population outlook (Harrison County) Hauer SSP2
- Today (2025)
- 67,273 people
- By 2030
- 65,963 · -1.9%
- By 2040
- 63,033 · -6.3%
- By 2050
- 59,999 · -10.8%
- By 2075
- 52,524 · -21.9%
- By 2100
- 42,654 · -36.6%
Race, ethnicity, and origin ACS 2023
- Neighborhood character
- Predominantly White (95%)
- Race & ethnicity
- White 95% Hispanic / Latino 1% Two or more races 1%
- Common ancestry
- Serbian 3% Romanian 2% Iranian 2%
- Foreign-born
- 1% · Canada
- Languages at home
- 99% English-only · Other Indo-European 1%
Political lean MEDSL · Harrison
- 2024 margin
- Solid R (+41.0) · D 28.5% · R 69.4% · Other 2.1%
- 2008→2024 swing
- -27.6pp toward R · 2008: -13.3pp · 2024: -41.0pp
- All cycles
- 2024: R+41.0 2020: R+37.6 2016: R+39.5 2012: R+23.5 2008: R+13.3
Not yet ingested
- Civics
- —
Market trends
- HPI YoY
- ▲ 3.80%
- Current HPI
- 174.3458
- Rent YoY
- —
- Metro
- —
- State GDP YoY
- —
- F500 in state
- 0
Price history
1 event — show timeline
- 2026-05-07 Listed $50,000 NCWVREIN
Cash-flow waterfall
monthlySold comps — $/sqft
last 12 mo · ≤1 miLoading sold comps…