3317 Parker Ln · Chattanooga, TN
Flood risk 1/10 · Minimal
- FEMA flood zone
- X (unshaded)
- Chance of flooding over 30 yrs
- 0.0%
- Est. flood insurance / yr
- $507 – $1,088
Fire risk 4/10 · Minor
- Est. fire insurance / yr
- $949 – $1,763
Heat risk 6/10 · Moderate
- Hot days now (above 105°F)
- 8 days/yr
- Hot days in 30 yrs
- 23 days/yr
Wind risk 4/10 · Minor
- Chance of severe wind over 30 yrs
- 13.0%
Air-quality risk 3/10 · Minor
- Unhealthy air days now
- 2 days/yr
- Unhealthy air days in 30 yrs
- 2 days/yr
Risk factors via First Street. Map © Google.
Why this score? — see what drove the B grade
The composite is a weighted blend of 9 inputs, each scored 0–100. Each bar is that input's sub-score; the figure is the points it added to the 100-point composite (weight × sub-score).
- Cash flow +29.5/30.0
- ARV discount +15.0/15.0
- DSCR +10.0/10.0
- 1% rule +7.1/10.0
- Livability +3.9/5.0
- Schools +2.7/10.0
- Rent growth +2.5/5.0
- Condition / age +2.5/5.0
- Appreciation +0.0/10.0
$185,000
🖨 Deal sheet 📄 Offer letter ✓ Due diligence
Listing remarks
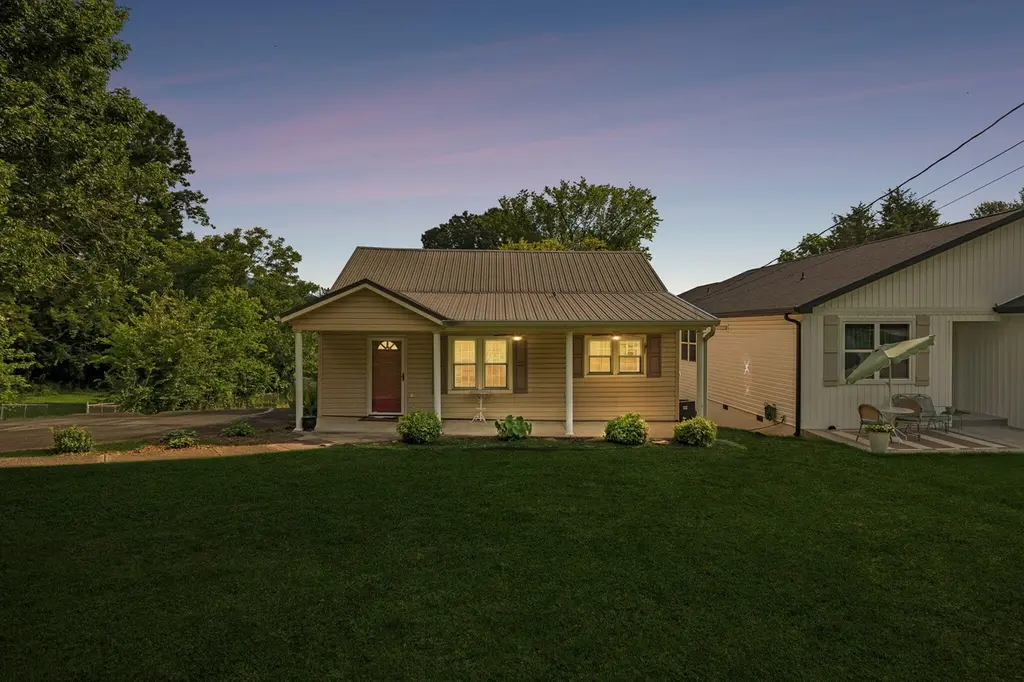
Nestled in the heart of Lookout Valley, this charming 3-bedroom, 2-bath home offers a rare opportunity to create something truly special. Situated on a generous 0.34-acre lot at the end of a quiet, private dead-end street, you'll enjoy both peaceful surroundings and the convenience of being less than 7 minutes from Downtown Chattanooga. Lovingly owned by the same family since 1975, this home has been the backdrop for decades of cherished memories and is ready for its next chapter. While it could benefit from updates, it presents an incredible opportunity for buyers with vision to restore it to its fullest potential. Whether you're searching for your next renovation project, investment oppor
Key facts
- Generous lot
- Nearby recreation
- Walk-out area
Tags
Property features AI
Finance
- Other: Property listed by Keller Williams Realty
- HOA & community: No community features
Exterior
- Parking: Driveway
- Utilities: Public water; Public sewer; Electricity connected; Water connected; Sewer connected
- Home design: Single-family residence (residential); One and one half stories; Fixer condition
- Construction: Vinyl siding; Block foundation; Metal roof; Built with traditional construction materials
- Exterior features: Rain gutters; Covered front porch; Back yard; Front yard; Gentle sloping lot; Asphalt road frontage on a public maintained city street
Interior
- Kitchen: Refrigerator; Electric range; Dishwasher; Electric water heater
- Flooring: Carpet; Hardwood; Laminate
- Bathrooms: 2 full bathrooms
- Heating & cooling: Central heating; Central air conditioning
- Interior features: Storage
- Laundry & utility: Washer hookup; Electric dryer hookup; Laundry area in kitchen
Neighborhood map
What this means for you Summary
Snapshot
- This is a 3-bed/2.0-bath single-family listed at $185k.
Deal economics
- At list price, monthly cash flow is $659 ($8k/yr) — positive.
- The deal already cash-flows at list — no discount required.
- Meets the 1% rule at list price ($2k rent vs $185k).
- Cap rate 10.6% vs local median 3.4% in Chattanooga — top-decile yield for the area; either an underpriced asset or a hidden risk that comps aren't pricing in. Stress-test before assuming the spread holds.
Location & tenants
- Location reads 78/100 on livability (#3 in TN, #2,582 nationally) — a middle-class / working-renter tenant base. Strengths: amenities A+, commute A+, cost of living A+; Watch: employment D+, crime F.
- Hamilton County (urban): math 31% / reading 31% proficiency, ranked #42 of 139 in TN (top 30%) — families likely to look elsewhere, expect single-tenant / working-renter base with shorter leases.
- Zoned schools: Lookout Valley Elementary (math 47% / reading 32%, grade F, #231 of 952 statewide, top 26%, 268 students, 0% FRL); Lookout Valley Middle / High School (math 8% / reading 22%, grade F, #237 of 332 statewide, top 75%, 318 students, 0% FRL) — zoned schools average 0% FRL vs 52% district-wide (52 pts lower); this property's tenant base skews higher-income than the district average.
- Market conditions: 163 active listings in the ZIP; 5 comparable units currently listed for rent nearby; rentals at typical pace (median 14d on market — plan ~3-4 weeks tenant-placement turnaround); 2,133 units permitted in Hamilton County in 2024 (405 in 5+ unit buildings).
Forward outlook
- Local home prices are declining (-3.0%/yr); year-one equity from $1k of loan paydown is wiped out by about $6k of value loss. Plan a longer hold.
- Hamilton County population projected at +23% by 2050 — long-run rental-demand tailwind backs the buy-and-hold thesis.
- At projected returns (-3.0% appreciation + 3.0% rent growth), your $52k cash investment doubles in ~8 years — after that, you're playing with house money.
Negotiation context
- Only 6 days on market — expect competitive offers; lowballing is unlikely to land.
Risks & watch-outs
- Watch-outs: built in 1950 — expect roof / HVAC / electrical / plumbing capex.
- Climate carrying-cost: extreme-heat days projected 8→23/yr by 2055 (HVAC capex compounding) — expect insurance premiums to compound above CPI over the hold.
Questions for the listing agent
- Built in 1950 — when were the roof, HVAC, electrical panel, plumbing, and water heater last replaced?
- Is there a deadline driving the sale (1031 exchange, divorce, estate, relocation)? That informs how much negotiation room exists.
- Schools are F-rated, which usually means shorter tenancies and higher turnover. Who's the typical renter profile here, and what's been the actual vacancy rate?
- Crime grade is F in this area — have there been break-ins, vandalism, or insurance claims at this property in the last 3 years? What carrier currently insures it and at what premium?
- What's the average days-on-market for RENTAL listings here right now (not sales)? A rising rental-DOM trend means longer vacancies and softer asking-rent achievability than the comps imply.
- What's the recent tenant-quality profile in this submarket — average credit score on applications, eviction rate, late-payment / NSF rate, and stable-employment percentage? A property-management company in the area should have these aggregated.
- How much new for-sale + rental construction is in the pipeline within 1–3 miles? Heavy new supply typically softens prices + rents 12–24 months out; constrained supply supports both.
Investment metrics
- 1% rule
- 1.21% ✓
- Cap rate
- 10.57%
- Cash-on-cash
- 15.27%
- DSCR
- 1.68
- GRM
- 6.9
CMA / ARV
- ARV (on-the-fly)
- $285,180
- Comps found
- 6
Show comp detail 6 sales within ~0.75 mi
| Address | Dist | Beds/Ba | Sqft | Sold | Price | $/sf | Match |
|---|---|---|---|---|---|---|---|
| 3316 Mountain View Dr | 0.06mi | 3/2.0 | 1,455 (-1%) | 5mo | $269,900 | $185 | 92 |
| 116 Centro St | 0.30mi | 3/1.5 | 1,613 (+10%) | 18mo | $190,000 | $118 | 52 |
| 3837 Mountain Top Rd | 0.67mi | 3/2.0 | 1,568 (+7%) | 7mo | $395,000 | $252 | 52 |
| 350 Isbill Rd | 0.57mi | 3/2.0 | 1,672 (+14%) | 1mo | $325,000 | $194 | 49 |
| 361 David St | 0.54mi | 4/2.0 (+1) | 1,408 (-4%) | 24mo | $278,500 | $198 | 43 |
| 113 Dower Rd | 0.63mi | 3/1.5 | 1,686 (+15%) | 11mo | $325,000 | $193 | 35 |
Match score weights: distance 35% · size 25% · config 20% · recency 20%. Top-matched comps best support the ARV.
Projected returns pro-forma
-3.0% appreciation · 3.0% rent growth · sell at horizon
- IRR
- 5.9%
- Equity multiple
- 1.23×
- Total profit
- $11,945
- Equity at exit
- $27,584
- IRR
- 15.3%
- Equity multiple
- 2.24×
- Total profit
- $64,189
- Equity at exit
- $15,995
Cash invested: $51,800 (down + closing). Projections, not guarantees.
Landlord ↔ Tenant lean methodology
- Overall (STATE)
- 87 Strongly Landlord-Friendly
- State Tennessee
- 87 Strongly Landlord-Friendly · R+13
- County
- — inherits STATE
- City
- — inherits STATE
ZIP-level market 37419
- Home prices YoY
- -28.9%
- Active inventory
- 163
- Price-to-rent
- 6.9×
Monthly cashflow live
- Estimated rent
- $2,238 high interval (Pro) →
- Mortgage (P&I)
- −$970
- Tax from tax record
- −$62 /mo · $739/yr
- Insurance
- −$77
- HOA
- −$0
- Vacancy / Maint / Mgmt
- −$470
- Net cashflow
- $659
Break-even live
UW: 25.0% down · 7.5% · 30yr · 1.5% tax · 5.0% vac · 8.0% maint · 8.0% mgmt
Financing live
Cash to close
- Down payment
- $46,250
- Closing costs
- $5,550
- Reserves months
- —
- Total cash needed
- —
Loan-product check · same deal, 3 products live
Conventional
25% down · 7.5% · 30yr
- Down + closing
- —
- Monthly P&I
- —
- Monthly cashflow
- —
- DSCR
- —
- Eligible?
- —
Personal DTI + credit; lowest rate.
DSCR
20% down · 8.5% · 30yr
- Down + closing
- —
- Monthly P&I
- —
- Monthly cashflow
- —
- DSCR
- —
- Eligible?
- —
No personal income docs; deal must DSCR.
Hard money
10% down · 12.0% · 12mo
- Down + closing
- —
- Monthly P&I
- —
- Monthly cashflow
- —
- DSCR
- —
- Eligible?
- —
Short-term bridge; refi at stabilization.
Rent comps 5 comps
| Address | Beds | Baths | Sqft | Rent | $/sqft | DOM | Units | Dist |
|---|---|---|---|---|---|---|---|---|
| 3384 Willow Lake Cir Chattanooga, TN | 3.0 | 2.0 | 1868 | $3,000 | $1.61 | 14d | 1 | 0.68mi |
| 3830 Kellys Ferry Rd Chattanooga, TN | 3.0 | 1.5 | 1320 | $1,995 | $1.51 | 14d | 1 | 0.77mi |
| 3217 Plaza Cir Chattanooga, TN | 3.0 | 2.0 | 1667 | $1,923 | $1.15 | 14d | 1 | 1.07mi |
| 4162 Tillie Cir Chattanooga, TN | 2.0 | 2.5 | 1127 | $1,699 | $1.51 | 14d | 1 | 1.50mi |
| 4158 Tillie Cir Chattanooga, TN | 3.0 | 3.5 | 1463 | $2,149 | $1.47 | 14d | 1 | 1.50mi |
Listing history 6 events
-
2026-06-18days on market $185,000 Active 6 DOM
-
2026-06-17days on market $185,000 Active 5 DOM
-
2026-06-16days on market $185,000 Active 4 DOM
-
2026-06-15days on market $185,000 Active 3 DOM
-
2026-06-14remarks 699-char remark
-
2026-06-14$185,000 Active 1 DOM
ⓘ Source: listings_history table (triggers on properties + properties_extension) + one-shot
backfill from property_details.listing_events for pre-trigger history.
Tax reassessment forecast TN · Resets to sale price
- Current annual tax
- $739 · $62/mo
- Projected year-2 tax
- $1,314 · $109/mo
- Expected delta
- +$575/yr (+$48/mo · 77.9%)
ⓘ Screening estimate from a state-policy table — verify with the county assessor before closing.
Climate risk First Street
- Flood 1/10 Low FEMA zone X (unshaded) · 0% chance over 30 yrs
- Wildfire 4/10 Moderate
- Heat 6/10 Major 8 d/yr ≥105°F today · 23 d/yr by 30 yrs out
- Wind 4/10 Moderate 13% chance of damaging wind over 30 yrs
- Air quality 3/10 Moderate 2 unhealthy d/yr today · 2 by 30 yrs out
Nearby sold comps map
Loading sold comps map…
Walkable amenities ~0.75 mi
Loading nearby amenities…
Taxation est. · year 1
- Rental income
- $26,858
- − Mortgage interest
- −$10,363
- − Property taxes
- −$739
- − Insurance
- −$925
- − Repairs & maintenance
- −$2,149
- − Management
- −$2,149
- − Depreciation
- −$5,382
- Taxable income
- $5,152
- Est. tax owed @ 24.0%
- −$1,237
- After-tax cash flow
- $6,676/yr
For passive investors: Depreciation is non-cash, so a rental often shows a tax loss while cash-flowing — sheltering income. Rental losses are passive: they offset passive income freely, and up to $25,000/yr can offset ordinary (W-2) income if you actively participate and your MAGI is under $100k (phasing out to $0 by $150k); unused losses carry forward. On sale, claimed depreciation is recaptured at up to 25%, and gains may owe capital-gains tax (a 1031 exchange can defer both). Figures are a year-1 estimate at your 24.0% rate — not tax advice; consult a CPA.
Schools (NCES district)
- District
- Hamilton County
- NCES district ID
- 4701590
- Math proficiency
- 31% ▼ -10.00%
- Reading proficiency
- 31% ▼ -3.00%
- Median HH income
- $47,456
- Composite
- 26.8/100
- National rank
- #7122
- State rank
- #42 of 139 in TN
Livability — Chattanooga
- Score
- 78/100
- State rank
- #3
- US rank
- #2582
Category grades
Schools grade is shown separately in the Schools card above.
Census & demographics
- Census place
- Chattanooga, TN
- City population
- 131,999
- Population (ZIP)
- 6,288
Population outlook (Hamilton County) Hauer SSP2
- Today (2025)
- 393,784 people
- By 2030
- 412,983 · +4.9%
- By 2040
- 449,502 · +14.1%
- By 2050
- 484,341 · +23.0%
- By 2075
- 565,746 · +43.7%
- By 2100
- 618,394 · +57.0%
Race, ethnicity, and origin ACS 2023
- Neighborhood character
- Predominantly White (85%)
- Race & ethnicity
- White 85% Two or more races 6% Asian 5% Black 2%
- Common ancestry
- Slovak 5% Serbian 3% Iranian 2%
- Foreign-born
- 5% · China, Vietnam, South Korea
- Languages at home
- 95% English-only · Vietnamese 2% Other Asian/Pacific 1% Other Indo-European 1%
Political lean MEDSL · Hamilton
- 2024 margin
- R (+13.1) · D 42.7% · R 55.7% · Other 1.6%
- 2008→2024 swing
- -1.2pp toward R · 2008: -11.8pp · 2024: -13.1pp
- All cycles
- 2024: R+13.1 2020: R+9.7 2016: R+16.6 2012: R+14.8 2008: R+11.8
Not yet ingested
- Civics
- —
Market trends
- HPI YoY
- ▼ -105.36%
- Current HPI
- 258.6585
- Rent YoY
- —
- Metro
- —
- State GDP YoY
- ▲ 2.78%
- F500 in state
- 22
Industry mix (Fortune 500 HQ in TN)
| Industry | F500 HQs | Revenue |
|---|---|---|
| Healthcare | 3 | $91B |
|
||
| Retail | 3 | $72B |
|
||
| Transportation / Logistics | 1 | $88B |
|
||
| Paper / Packaging | 1 | $19B |
|
||
| Insurance | 1 | $13B |
|
||
| Energy | 1 | $12B |
|
||
Price history
1 event — show timeline
- 2026-06-12 Listed $185,000 GCAR
Property tax history
+1.3%/yrLatest (2025): $739 · +24.1% YoY. Source: county tax records.
Cash-flow waterfall
monthlySold comps — $/sqft
last 12 mo · ≤1 miLoading sold comps…