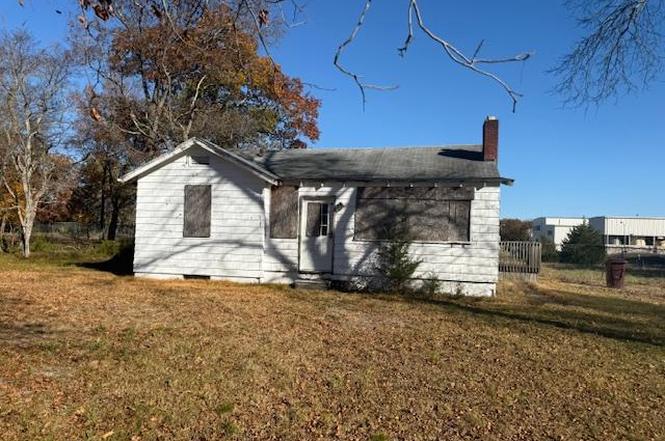
1469 N Mill Rd · Vineland, NJ
Flood risk 1/10 · Minimal
- FEMA flood zone
- X (unshaded)
- Chance of flooding over 30 yrs
- 0.0%
- Est. flood insurance / yr
- $507 – $1,088
Fire risk 5/10 · Moderate
- Est. fire insurance / yr
- $526 – $976
Heat risk 7/10 · Major
- Hot days now (above 103°F)
- 7 days/yr
- Hot days in 30 yrs
- 15 days/yr
Wind risk 6/10 · Moderate
- Chance of severe wind over 30 yrs
- 66.0%
Air-quality risk 3/10 · Minor
- Unhealthy air days now
- 3 days/yr
- Unhealthy air days in 30 yrs
- 5 days/yr
Risk factors via First Street. Map © Google.
Why this score? — see what drove the C grade
The composite is a weighted blend of 9 inputs, each scored 0–100. Each bar is that input's sub-score; the figure is the points it added to the 100-point composite (weight × sub-score).
- Cash flow +21.4/30.0
- ARV discount +15.0/15.0
- DSCR +6.8/10.0
- 1% rule +5.3/10.0
- Livability +3.3/5.0
- Rent growth +2.5/5.0
- Condition / age +2.5/5.0
- Schools +1.9/10.0
- Appreciation +0.0/10.0
$199,000
🖨 Deal sheet 📄 Offer letter ✓ Due diligence
Listing remarks
This house is a total knock down, nothing of value inside. Value is the lot and possibility of building off the foundation. Do not go inside very very dangerous as the floors are unstable, basement has no door and the steps are missing resulting in a straight drop to the basement. Let me repeat do not go inside!!!!
Key facts
- 3.28 acre lot
- Built 1945
- Listed 226 days
Property features AI
Exterior
- Parking: Driveway parking
- Utilities: Public water; Septic system; Natural gas
- Home design: Single-family property (fee simple ownership); Estimated year built
- Construction: Wood siding construction; Above-grade and below-grade structures
- Exterior features: No basement; No tidal water
Interior
- Bedrooms: Three bedrooms on the main level
- Bathrooms: One full bathroom on the main level
- Heating & cooling: Other heating; Natural gas heating fuel
- Interior features: Estimated living area
Neighborhood map
What this means for you Summary
Snapshot
- This is a 3-bed/1.0-bath single-family listed at $199k.
Deal economics
- At list price, monthly cash flow is $296 ($4k/yr) — positive.
- The deal already cash-flows at list — no discount required.
- Meets the 1% rule at list price ($2k rent vs $199k).
- Recommended offer: $175k (12.0% below list) — sets the bar for market timing.
- Cap rate 8.1% vs local median 4.5% in Vineland — top-decile yield for the area; either an underpriced asset or a hidden risk that comps aren't pricing in. Stress-test before assuming the spread holds.
Location & tenants
- Location reads 66/100 on livability (#363 in NJ) — a middle-class / working-renter tenant base. Strengths: housing A+, health & safety A+; Watch: employment D+, schools D, crime F.
- Vineland Public School District (urban): math 9% / reading 34% proficiency, ranked #418 of 472 in NJ (top 89%) — low school quality limits family demand, transient renter base, plan for 1-2y turnover.
- Market conditions: 173 active listings in the ZIP; 216 units permitted in Cumberland County in 2024 (73 in 5+ unit buildings).
- This rent runs 38% of the median local income ($65k/yr) — at the standard rent-burdened threshold; future hikes will face affordability resistance.
Forward outlook
- Local home prices are declining (-3.0%/yr); year-one equity from $1k of loan paydown is wiped out by about $6k of value loss. Plan a longer hold.
- Cumberland County population projected to shrink 7% by 2050 — rents likely to lag national; underwrite the cash flow, not the appreciation.
Negotiation context
- It's been on market 227 days — a 12% lower offer ($175k) is reasonable based on typical stale-listing flexibility.
- 3 sale attempts with the ask held roughly flat each time — persistent listings suggest the price (not the market) is what's stuck; bring a comps-based counter.
Risks & watch-outs
- Watch-outs: built in 1945 — expect roof / HVAC / electrical / plumbing capex.
- Climate carrying-cost: major wind risk, 66% chance of damaging wind over 30y; moderate wildfire risk; extreme-heat days projected 7→15/yr by 2055 (HVAC capex compounding) — expect insurance premiums to compound above CPI over the hold.
Questions for the listing agent
- It's been on market 227 days. Have you received any prior offers? Is the seller open to a 12% concession, seller financing, or rate buy-down credit?
- Built in 1945 — when were the roof, HVAC, electrical panel, plumbing, and water heater last replaced?
- Why hasn't it sold? Are there any deal-killer items the seller is aware of (foundation, flood, title, zoning, code violations)?
- Is there a deadline driving the sale (1031 exchange, divorce, estate, relocation)? That informs how much negotiation room exists.
- Schools are D-rated, which usually means shorter tenancies and higher turnover. Who's the typical renter profile here, and what's been the actual vacancy rate?
- Crime grade is F in this area — have there been break-ins, vandalism, or insurance claims at this property in the last 3 years? What carrier currently insures it and at what premium?
- What's the average days-on-market for RENTAL listings here right now (not sales)? A rising rental-DOM trend means longer vacancies and softer asking-rent achievability than the comps imply.
- What's the recent tenant-quality profile in this submarket — average credit score on applications, eviction rate, late-payment / NSF rate, and stable-employment percentage? A property-management company in the area should have these aggregated.
- How much new for-sale + rental construction is in the pipeline within 1–3 miles? Heavy new supply typically softens prices + rents 12–24 months out; constrained supply supports both.
Investment metrics
- 1% rule
- 1.03% ✓
- Cap rate
- 8.08%
- Cash-on-cash
- 6.36%
- DSCR
- 1.28
- GRM
- 8.1
CMA / ARV
- ARV (on-the-fly)
- $263,940
- Comps found
- 7
Show comp detail 7 sales within ~0.75 mi
| Address | Dist | Beds/Ba | Sqft | Sold | Price | $/sf | Match |
|---|---|---|---|---|---|---|---|
| 1833 W Oak Rd | 0.36mi | 2/1.0 (-1) | 917 (-8%) | 9mo | $265,900 | $290 | 57 |
| 1111 N Orchard Rd | 0.58mi | 3/1.5 | 1,104 (+11%) | 8mo | $255,000 | $231 | 46 |
| 930 Charles St | 0.62mi | 3/1.0 | 960 (-4%) | 24mo | $305,000 | $318 | 45 |
| 1227 W Wheat Rd | 0.64mi | 3/1.0 | 880 (-12%) | 14mo | $233,450 | $265 | 39 |
| 1378 Venus Dr | 0.71mi | 3/2.0 | 1,128 (+13%) | 7mo | $339,000 | $301 | 35 |
| 1460 Neptune Ter | 0.66mi | 3/1.0 | 858 (-14%) | 21mo | $186,000 | $217 | 28 |
| 1206 W Wheat Rd | 0.68mi | 2/1.0 (-1) | 1,108 (+11%) | 20mo | $260,000 | $235 | 28 |
Match score weights: distance 35% · size 25% · config 20% · recency 20%. Top-matched comps best support the ARV.
Projected returns pro-forma
-3.0% appreciation · 3.0% rent growth · sell at horizon
- IRR
- -6.5%
- Equity multiple
- 0.76×
- Total profit
- $-13,422
- Equity at exit
- $29,672
- IRR
- 3.1%
- Equity multiple
- 1.23×
- Total profit
- $12,556
- Equity at exit
- $17,206
Cash invested: $55,720 (down + closing). Projections, not guarantees.
Landlord ↔ Tenant lean methodology
- Overall (STATE)
- 21 Tenant-Leaning
- State New Jersey
- 21 Tenant-Leaning · D+6
- County
- — inherits STATE
- City
- — inherits STATE
ZIP-level market 08360
- Active inventory
- 173
- Price-to-rent
- 8.1×
Monthly cashflow live
- Estimated rent
- $2,054 medium interval (Pro) →
- Mortgage (P&I)
- −$1,044
- Tax from tax record
- −$200 /mo · $2,406/yr
- Insurance
- −$83
- HOA
- −$0
- Vacancy / Maint / Mgmt
- −$431
- Net cashflow
- $296
Break-even live
UW: 25.0% down · 7.5% · 30yr · 1.5% tax · 5.0% vac · 8.0% maint · 8.0% mgmt
Financing live
Cash to close
- Down payment
- $49,750
- Closing costs
- $5,970
- Reserves months
- —
- Total cash needed
- —
Loan-product check · same deal, 3 products live
Conventional
25% down · 7.5% · 30yr
- Down + closing
- —
- Monthly P&I
- —
- Monthly cashflow
- —
- DSCR
- —
- Eligible?
- —
Personal DTI + credit; lowest rate.
DSCR
20% down · 8.5% · 30yr
- Down + closing
- —
- Monthly P&I
- —
- Monthly cashflow
- —
- DSCR
- —
- Eligible?
- —
No personal income docs; deal must DSCR.
Hard money
10% down · 12.0% · 12mo
- Down + closing
- —
- Monthly P&I
- —
- Monthly cashflow
- —
- DSCR
- —
- Eligible?
- —
Short-term bridge; refi at stabilization.
Listing history 21 events
-
2026-06-19days on market $199,000 Active 227 DOM
-
2026-06-18days on market $199,000 Active 226 DOM
-
2026-06-17days on market $199,000 Active 225 DOM
-
2026-06-16days on market $199,000 Active 224 DOM
-
2026-06-15days on market $199,000 Active 223 DOM
-
2026-06-14days on market $199,000 Active 221 DOM
-
2026-06-13days on market $199,000 Active 220 DOM
-
2026-06-10days on market $199,000 Active 218 DOM
-
2026-06-09days on market $199,000 Active 217 DOM
-
2026-06-08days on market $199,000 Active 216 DOM
-
2026-06-07days on market $199,000 Active 215 DOM
-
2026-06-03days on market $199,000 Active 211 DOM
-
2026-06-02days on market $199,000 Active 210 DOM
-
2026-06-01days on market $199,000 Active 209 DOM
-
2026-05-31days on market $199,000 Active 208 DOM
-
2026-05-30days on market $199,000 Active 207 DOM
-
2025-11-04$199,000 Active
-
2025-09-26historical
-
2025-03-26$199,000 Active
-
2025-03-26historical
-
2025-01-27$199,000 Active
ⓘ Source: listings_history table (triggers on properties + properties_extension) + one-shot
backfill from property_details.listing_events for pre-trigger history.
Tax reassessment forecast NJ · Partial reset (capped growth)
- Current annual tax
- $2,406 · $200/mo
- Projected year-2 tax
- $3,680 · $307/mo
- Expected delta
- +$1,275/yr (+$106/mo · 53.0%)
ⓘ Screening estimate from a state-policy table — verify with the county assessor before closing.
Climate risk First Street
- Flood 1/10 Low FEMA zone X (unshaded) · 0% chance over 30 yrs
- Wildfire 5/10 Major
- Heat 7/10 Severe 7 d/yr ≥103°F today · 15 d/yr by 30 yrs out
- Wind 6/10 Major 66% chance of damaging wind over 30 yrs
- Air quality 3/10 Moderate 3 unhealthy d/yr today · 5 by 30 yrs out
Nearby sold comps map
Loading sold comps map…
Walkable amenities ~0.75 mi
Loading nearby amenities…
Taxation est. · year 1
- Rental income
- $24,646
- − Mortgage interest
- −$11,147
- − Property taxes
- −$2,406
- − Insurance
- −$995
- − Repairs & maintenance
- −$1,972
- − Management
- −$1,972
- − Depreciation
- −$5,789
- Taxable income
- $366
- Est. tax owed @ 24.0%
- −$88
- After-tax cash flow
- $3,459/yr
For passive investors: Depreciation is non-cash, so a rental often shows a tax loss while cash-flowing — sheltering income. Rental losses are passive: they offset passive income freely, and up to $25,000/yr can offset ordinary (W-2) income if you actively participate and your MAGI is under $100k (phasing out to $0 by $150k); unused losses carry forward. On sale, claimed depreciation is recaptured at up to 25%, and gains may owe capital-gains tax (a 1031 exchange can defer both). Figures are a year-1 estimate at your 24.0% rate — not tax advice; consult a CPA.
Schools (NCES district)
- District
- Vineland Public School District
- NCES district ID
- 3416800
- Math proficiency
- 9% ▼ -17.00%
- Reading proficiency
- 34% ▬ 0.00%
- Median HH income
- $51,168
- Composite
- 19.17/100
- National rank
- #8819
- State rank
- #418 of 472 in NJ
Livability — Vineland
- Score
- 66/100
- State rank
- #363
- US rank
- #12180
Category grades
Schools grade is shown separately in the Schools card above.
Census & demographics
- Census place
- Vineland, NJ
- County
- Cumberland County · 80,266 people
- City population
- 45,038
- Metro
- Vineland-Bridgeton, NJ
- Population (ZIP)
- 45,038
- Household income
- $65,359
- Rent vs Own
- Severe rent burden
- 1328.0
Population outlook (Cumberland County) Hauer SSP2
- Today (2025)
- 152,743 people
- By 2030
- 150,373 · -1.6%
- By 2040
- 146,881 · -3.8%
- By 2050
- 142,653 · -6.6%
- By 2075
- 129,468 · -15.2%
- By 2100
- 107,456 · -29.6%
Race, ethnicity, and origin ACS 2023
- Neighborhood character
- Diverse neighborhood (Simpson 0.62)
- Race & ethnicity
- Hispanic / Latino 51% White 32% Two or more races 17% Black 11% Asian 1%
- Hispanic origin (detail)
- Mexican 11% Puerto Rican 33% Dominican 2%
- Common ancestry
- Romanian 2% Subsaharan African 1% Scotch-Irish 1%
- Foreign-born
- 14% · Canada, Jamaica
- Languages at home
- 59% English-only · Spanish 37% Russian/Polish/Slavic 2% Other Indo-European 1%
Political lean MEDSL · Cumberland
- 2024 margin
- Toss-up / Even · D 47.6% · R 51.3% · Other 1.1%
- 2008→2024 swing
- -25.4pp toward R · 2008: 21.6pp · 2024: -3.8pp
- All cycles
- 2024: R+3.8 2020: D+6.0 2016: D+5.3 2012: D+23.1 2008: D+21.6
Not yet ingested
- Civics
- —
Market trends
- HPI YoY
- ▼ -320.06%
- Current HPI
- 278.786
- Rent YoY
- —
- Metro
- Vineland-Bridgeton, NJ
- State GDP YoY
- ▲ 2.05%
- F500 in state
- 34
Industry mix (Fortune 500 HQ in NJ)
| Industry | F500 HQs | Revenue |
|---|---|---|
| Consumer Goods | 3 | $31B |
|
||
| Pharmaceuticals | 2 | $153B |
|
||
| Technology | 2 | $21B |
|
||
| Insurance | 2 | $20B |
|
||
| Healthcare | 2 | $19B |
|
||
| Financial Services | 1 | $70B |
|
||
Price history
+0.0% since first listed5 events — show timeline
- 2025-11-04 Listed $199,000 BRIGHT MLS
- 2025-09-26 Listing Removed — BRIGHT MLS
- 2025-03-26 Listing Removed — BRIGHT MLS
- 2025-03-26 Listed $199,000 BRIGHT MLS
- 2025-01-27 Listed $199,000 BRIGHT MLS
Property tax history
+3.2%/yrLatest (2025): $2,406 · +3.9% YoY. Source: county tax records.
Cash-flow waterfall
monthlySold comps — $/sqft
last 12 mo · ≤1 miLoading sold comps…