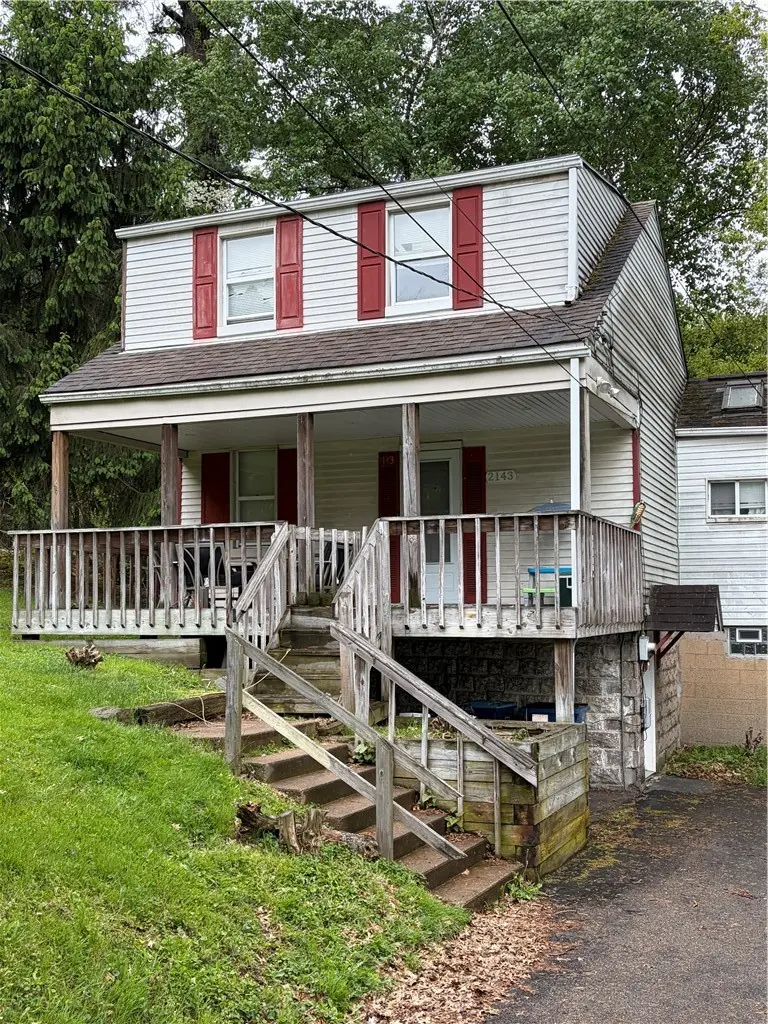
2143 Sampson · Penn Hills, PA
Flood risk 1/10 · Minimal
- FEMA flood zone
- X (unshaded)
- Chance of flooding over 30 yrs
- 0.0%
- Est. flood insurance / yr
- $473 – $860
Fire risk 1/10 · Minimal
- Est. fire insurance / yr
- $511 – $949
Heat risk 3/10 · Minor
- Hot days now (above 96°F)
- 6 days/yr
- Hot days in 30 yrs
- 14 days/yr
Wind risk 2/10 · Minimal
- Chance of severe wind over 30 yrs
- —
Air-quality risk 4/10 · Minor
- Unhealthy air days now
- 5 days/yr
- Unhealthy air days in 30 yrs
- 7 days/yr
Risk factors via First Street. Map © Google.
Why this score? — see what drove the D- grade
The composite is a weighted blend of 9 inputs, each scored 0–100. Each bar is that input's sub-score; the figure is the points it added to the 100-point composite (weight × sub-score).
- Cash flow +17.5/30.0
- DSCR +5.5/10.0
- 1% rule +4.4/10.0
- Rent growth +4.4/5.0
- Livability +2.5/5.0
- Condition / age +2.5/5.0
- Schools +1.6/10.0
- ARV discount +0.0/15.0
- Appreciation +0.0/10.0
$150,000
🖨 Deal sheet (PDF) 📄 Offer letter ✓ Due diligence
Listing remarks
Welcome to this charming 3-bedroom, 1 full bathroom home located in Penn Hills! Featuring beautiful wood floors throughout, this property offers a warm and inviting layout perfect for comfortable living. This home sits on a large yard with plenty of outdoor space for entertaining, gardening, or family activities, along with a spacious driveway that provides ample parking. With a little TLC, this home has incredible potential and is ideal for an investor looking to add to their portfolio or a small to moderate-sized family seeking an affordable place to make their own. Conveniently located near shopping, schools, and major roadways, this is a great opportunity you won’t want to miss!
Key facts
- Wood floors
- Large yard
- Outdoor space
Tags
Property features AI
Exterior
- Parking: Off-street parking; Space for 3 vehicles
- Utilities: Public water; Public sewer
- Home design: 2-story; Resale property
- Construction: Asphalt roof
- Exterior features: Public transportation nearby
Interior
- Flooring: Carpet; Hardwood
- Bathrooms: 1 full bathroom
- Heating & cooling: Gas heating; Radiant heating
- Interior features: Carpet flooring; Hardwood flooring; Full basement with walk-out access
Neighborhood map
What this means for you Summary
Snapshot
- This is a 2-bed/1.0-bath single-family listed at $150k.
Deal economics
- At list price, monthly cash flow is $114 ($1k/yr) — positive.
- The deal already cash-flows at list — no discount required.
- To meet the 1% rule (rent ≥ 1% of price), the offer needs to be $141k (5.8% below list).
- Recommended offer: $141k (5.8% below list) — sets the bar for 1% rule.
Location & tenants
- Location reads: area grade D — affects rentability + tenant quality, not the cash-flow math above.
- Penn Hills SD (suburban): math 13% / reading 24% proficiency, ranked #496 of 539 in PA (top 92%) — low school quality limits family demand, transient renter base, plan for 1-2y turnover.
- Market conditions: Rents rising fast (+7.6%/yr); 129 active listings in the ZIP; 29 comparable units currently listed for rent nearby; rentals at typical pace (median 15d on market — plan ~3-4 weeks tenant-placement turnaround); 2,996 units permitted in Allegheny County in 2024 (1,588 in 5+ unit buildings).
Forward outlook
- Local home prices are declining (-3.0%/yr); year-one equity from $1k of loan paydown is wiped out by about $4k of value loss. Plan a longer hold.
- At projected returns (-3.0% appreciation + 7.6% rent growth), your $42k cash investment doubles in ~10 years — after that, you're playing with house money.
Negotiation context
- It's been on market 30 days — a 2% lower offer ($148k) is reasonable based on typical stale-listing flexibility.
- Current owner paid $47k; list at $150k implies a 220% gain — meaningful room to come down on a strong offer.
Risks & watch-outs
- Watch-outs: built in 1927 — expect roof / HVAC / electrical / plumbing capex.
Questions for the listing agent
- Built in 1927 — when were the roof, HVAC, electrical panel, plumbing, and water heater last replaced?
- Is there a deadline driving the sale (1031 exchange, divorce, estate, relocation)? That informs how much negotiation room exists.
- The area grade is low — what's the realistic commute time and amenity access for the typical tenant pool here? Any planned neighborhood developments (good or bad) we should know about?
- What's the average days-on-market for RENTAL listings here right now (not sales)? A rising rental-DOM trend means longer vacancies and softer asking-rent achievability than the comps imply.
- What's the recent tenant-quality profile in this submarket — average credit score on applications, eviction rate, late-payment / NSF rate, and stable-employment percentage? A property-management company in the area should have these aggregated.
- How much new for-sale + rental construction is in the pipeline within 1–3 miles? Heavy new supply typically softens prices + rents 12–24 months out; constrained supply supports both.
Investment metrics
- 1% rule
- 0.94% ✗
- Cap rate
- 7.21%
- Cash-on-cash
- 3.27%
- DSCR
- 1.15
- GRM
- 8.8
CMA / ARV
- ARV (on-the-fly)
- $120,840
- Comps found
- 12
Show comp detail 12 sales within ~0.75 mi
| Address | Dist | Beds/Ba | Sqft | Sold | Price | $/sf | Match |
|---|---|---|---|---|---|---|---|
| 9611 Emerson St | 0.28mi | 3/1.0 (+1) | 1,120 (+6%) | 1mo | $75,000 | $67 | 72 |
| 361 Orin St | 0.40mi | 3/1.0 (+1) | 1,100 (+4%) | 0mo | $125,500 | $114 | 70 |
| 35 Verona Rd | 0.38mi | 2/1.0 | 1,122 (+6%) | 5mo | $24,900 | $22 | 68 |
| 108 Lavern St | 0.18mi | 3/1.5 (+1) | 1,176 (+11%) | 4mo | $175,000 | $149 | 63 |
| 139 Howard St | 0.29mi | 3/1.0 (+1) | 1,160 (+9%) | 5mo | $105,000 | $91 | 62 |
| 2036 Sampson St | 0.13mi | 3/2.0 (+1) | 1,218 (+15%) | 1mo | $162,000 | $133 | 59 |
| 1938 Laketon Rd | 0.67mi | 2/1.0 | 968 (-9%) | 2mo | $17,504 | $18 | 53 |
| 614 Churchill Ave | 0.59mi | 3/2.0 (+1) | 1,100 (+4%) | 5mo | $174,500 | $159 | 53 |
| 2070 Boggs Ave | 0.75mi | 2/2.0 | 1,144 (+8%) | 3mo | $140,000 | $122 | 45 |
| 310 Mccutcheon Ln | 0.66mi | 3/2.0 (+1) | 1,163 (+10%) | 5mo | $70,000 | $60 | 40 |
| 502 Bon Air Rd | 0.60mi | 3/2.0 (+1) | 922 (-13%) | 2mo | $129,000 | $140 | 39 |
| 23 Frankwood Rd | 0.71mi | 3/1.0 (+1) | 1,218 (+15%) | 6mo | $105,000 | $86 | 32 |
Match score weights: distance 35% · size 25% · config 20% · recency 20%. Top-matched comps best support the ARV.
Projected returns pro-forma
-3.0% appreciation · 7.63% rent growth · sell at horizon
- IRR
- -6.2%
- Equity multiple
- 0.76×
- Total profit
- $-10,136
- Equity at exit
- $22,365
- IRR
- 8.2%
- Equity multiple
- 1.75×
- Total profit
- $31,658
- Equity at exit
- $12,969
Cash invested: $42,000 (down + closing). Projections, not guarantees.
Landlord ↔ Tenant lean methodology
- Overall (STATE)
- 62 Landlord-Friendly
- State Pennsylvania
- 62 Landlord-Friendly · EVEN
- County
- — inherits STATE
- City
- — inherits STATE
ZIP-level market 15235
- Home prices YoY
- -34.1%
- Rents YoY
- 7.6%
- Active inventory
- 129
- Price-to-rent
- 8.8×
Monthly cashflow live
- Estimated rent
- $1,413 high interval (Pro) →
- Mortgage (P&I)
- −$787
- Tax from tax record
- −$153 /mo · $1,830/yr
- Insurance
- −$62
- HOA
- −$0
- Vacancy / Maint / Mgmt
- −$297
- Net cashflow
- $114
Break-even live
Sensitivity live
| Price | -10% $199 | -5% $157 | +0% $114 | +5% $72 | +10% $29 |
|---|---|---|---|---|---|
| Rent | -10% $3 | -5% $59 | +0% $114 | +5% $170 | +10% $226 |
| Rate | -1.0pp $190 | -0.5pp $153 | base $114 | +0.5pp $75 | +1.0pp $36 |
UW: 25.0% down · 7.5% · 30yr · 1.5% tax · 5.0% vac · 8.0% maint · 8.0% mgmt
Financing live
Cash to close
- Down payment
- $37,500
- Closing costs
- $4,500
- Reserves months
- —
- Total cash needed
- —
Loan-product check · same deal, 3 products live
Conventional
25% down · 7.5% · 30yr
- Down + closing
- —
- Monthly P&I
- —
- Monthly cashflow
- —
- DSCR
- —
- Eligible?
- —
Personal DTI + credit; lowest rate.
DSCR
20% down · 8.5% · 30yr
- Down + closing
- —
- Monthly P&I
- —
- Monthly cashflow
- —
- DSCR
- —
- Eligible?
- —
No personal income docs; deal must DSCR.
Hard money
10% down · 12.0% · 12mo
- Down + closing
- —
- Monthly P&I
- —
- Monthly cashflow
- —
- DSCR
- —
- Eligible?
- —
Short-term bridge; refi at stabilization.
Rent comps 29 comps
| Address | Beds | Baths | Sqft | Rent | $/sqft | DOM | Units | Dist |
|---|---|---|---|---|---|---|---|---|
| 185 Howard St Pittsburgh, PA | 2.0 | 1.0 | 1000 | $1,250 | $1.25 | 44d | 1 | 0.29mi |
| 8918 Frankstown Rd Pittsburgh, PA | 3.0 | 1.0 | 1400 | $1,907 | $1.36 | 15d | 1 | 0.43mi |
| 3005 Laketon Rd Pittsburgh, PA | 3.0 | 1.0 | 1100 | $1,295 | $1.18 | 15d | 1 | 0.52mi |
| 648 Southern Ave Penn Hills, PA | 3.0 | 1.0 | 1100 | $1,600 | $1.45 | 8d | 1 | 0.53mi |
| 716 Southern Ave Unit B Penn Hills Township, PA | 1.0 | 1.0 | 999 | $950 | $0.95 | 44d | 1 | 0.54mi |
| 716 Southern Ave Penn Hills, PA | 1.0 | 1.0 | 999 | $950 | $0.95 | 15d | 1 | 0.54mi |
| 10043 Calvin St Pittsburgh, PA | 2.0 | 1.0 | 778 | $1,195 | $1.54 | 44d | 1 | 0.55mi |
| 610 Churchill Ave Pittsburgh, PA | 3.0 | 1.0 | 1100 | $1,395 | $1.27 | 2d | 1 | 0.59mi |
| 2031 Chalfant St Pittsburgh, PA | 3.0 | 1.5 | 1150 | $1,950 | $1.70 | 44d | 1 | 0.63mi |
| 103 Grove Rd Verona, PA | 3.0 | 1.5 | 1460 | $1,450 | $0.99 | 13d | 1 | 0.69mi |
| 216 Grove Rd Verona, PA | 3.0 | 1.0 | 1165 | $1,550 | $1.33 | 44d | 1 | 0.76mi |
| 8612 Oakcrest Rd Pittsburgh, PA | 2.0 | 1.0 | 1218 | $1,450 | $1.19 | 24d | 1 | 0.76mi |
| 10135 Pearl Rd Pittsburgh, PA | 3.0 | 2.0 | 1163 | $1,450 | $1.25 | 24d | 1 | 0.78mi |
| 1713-1715 Clark St Unit 79-1804C Pittsburgh, PA | 2.0 | 1.0 | 972 | $1,200 | $1.23 | 4d | 1 | 0.96mi |
| 62 Melvin Ct Penn Hills Township, PA | 1.0–2.0 | 1.0 | 825 | $1,549 | $1.88 | 8d | 2 | 0.97mi |
| 314 Penn Vista Dr Pittsburgh, PA | 2.0 | 1.0 | 1150 | $1,250 | $1.09 | 44d | 1 | 1.03mi |
| 7534 Penn Bridge Ct Pittsburgh, PA | 2.0 | 2.0 | 1259 | $1,750 | $1.39 | 44d | 1 | 1.08mi |
| 641 Penny Dr Pittsburgh, PA | 3.0 | 1.5 | 1199 | $1,525 | $1.27 | 15d | 1 | 1.11mi |
| 457 Elias Dr #445 Pittsburgh, PA | 2.0 | 1.0 | 888 | $1,200 | $1.35 | 17d | 1 | 1.11mi |
| 251 Selvin Dr Verona, PA | 3.0 | 1.0 | 1320 | $1,295 | $0.98 | 3d | 1 | 1.12mi |
| 1250 Blackadore Ave Pittsburgh, PA | 3.0 | 1.0 | 1440 | $1,750 | $1.22 | 24d | 1 | 1.18mi |
| 273 Bramble St Verona, PA | 3.0 | 1.5 | 1076 | $1,720 | $1.60 | 4d | 1 | 1.18mi |
| 1515 Penn Ave Wilkinsburg, PA | 2.0 | 2.0 | 1012 | $1,100 | $1.09 | 44d | 1 | 1.20mi |
| 131 Jacob Dr Pittsburgh, PA | 3.0 | 1.0 | 1144 | $2,300 | $2.01 | 2d | 1 | 1.23mi |
| 7215 Beacon Hill Dr Pittsburgh, PA | 2.0 | 2.0 | 1259 | $1,795 | $1.43 | 4d | 1 | 1.23mi |
| 124 Dauntless Dr Pittsburgh, PA | 3.0 | 1.0 | 1100 | $1,395 | $1.27 | 24d | 1 | 1.24mi |
| 8075 Chaske St Verona, PA | 3.0 | 1.5 | 1092 | $1,425 | $1.30 | 8d | 1 | 1.25mi |
| 209 Briarwood Dr Pittsburgh, PA | 3.0 | 2.0 | 1080 | $1,500 | $1.39 | 24d | 1 | 1.47mi |
| 220 Briarwood Dr Pittsburgh, PA | 3.0 | 1.0 | 869 | $1,465 | $1.69 | 15d | 1 | 1.49mi |
Listing history 18 events
-
2026-06-18days on market $150,000 Active 30 DOM
-
2026-06-17days on market $150,000 Active 29 DOM
-
2026-06-16days on market $150,000 Active 28 DOM
-
2026-06-15days on market $150,000 Active 27 DOM
-
2026-06-13days on market $150,000 Active 25 DOM
-
2026-06-13days on market $150,000 Active 24 DOM
-
2026-06-09days on market $150,000 Active 21 DOM
-
2026-06-08days on market $150,000 Active 20 DOM
-
2026-06-07days on market $150,000 Active 19 DOM
-
2026-06-05days on market $150,000 Active 16 DOM
-
2026-06-03days on market $150,000 Active 15 DOM
-
2026-06-02days on market $150,000 Active 14 DOM
-
2026-06-01days on market $150,000 Active 13 DOM
-
2026-05-31days on market $150,000 Active 12 DOM
-
2026-05-19$150,000 Active
-
2016-12-30soldstatus $46,805
-
2015-11-16soldstatus $37,000
-
1991-10-03soldstatus $22,000
ⓘ Source: listings_history table (triggers on properties + properties_extension) + one-shot
backfill from property_details.listing_events for pre-trigger history.
Tax reassessment forecast PA · Partial reset (capped growth)
- Current annual tax
- $1,830 · $153/mo
- Projected year-2 tax
- $2,100 · $175/mo
- Expected delta
- +$270/yr (+$22/mo · 14.7%)
ⓘ Screening estimate from a state-policy table — verify with the county assessor before closing.
Climate risk First Street
- Flood 1/10 Low FEMA zone X (unshaded) · 0% chance over 30 yrs
- Wildfire 1/10 Low
- Heat 3/10 Moderate 6 d/yr ≥96°F today · 14 d/yr by 30 yrs out
- Wind 2/10 Low
- Air quality 4/10 Moderate 5 unhealthy d/yr today · 7 by 30 yrs out
Nearby sold comps map
Loading sold comps map…
Walkable amenities ~0.75 mi
Loading nearby amenities…
Taxation est. · year 1
- Rental income
- $16,952
- − Mortgage interest
- −$8,402
- − Property taxes
- −$1,830
- − Insurance
- −$750
- − Repairs & maintenance
- −$1,356
- − Management
- −$1,356
- − Depreciation
- −$4,364
- Taxable loss
- −$1,107
- Est. tax savings @ 24.0%
- +$266
- After-tax cash flow
- $1,638/yr
For passive investors: Depreciation is non-cash, so a rental often shows a tax loss while cash-flowing — sheltering income. Rental losses are passive: they offset passive income freely, and up to $25,000/yr can offset ordinary (W-2) income if you actively participate and your MAGI is under $100k (phasing out to $0 by $150k); unused losses carry forward. On sale, claimed depreciation is recaptured at up to 25%, and gains may owe capital-gains tax (a 1031 exchange can defer both). Figures are a year-1 estimate at your 24.0% rate — not tax advice; consult a CPA.
Schools (NCES district)
- District
- Penn Hills SD
- NCES district ID
- 4218590
- Math proficiency
- 13% ▼ -6.00%
- Reading proficiency
- 24% ▼ -14.00%
- Median HH income
- $47,794
- Composite
- 16.42/100
- National rank
- #9192
- State rank
- #496 of 539 in PA
Livability — Penn Hills
No livability data for this city. (Only ~50 U.S. cities are tracked.)
Census & demographics
- County
- Allegheny County · 1,022,028 people
- Metro
- Pittsburgh, PA
- Population (ZIP)
- 33,951
- Household income
- $67,240
- Rent vs Own
- Severe rent burden
- 955.0
Population outlook (Allegheny County) Hauer SSP2
- Today (2025)
- 1,250,282 people
- By 2030
- 1,256,482 · +0.5%
- By 2040
- 1,256,318 · +0.5%
- By 2050
- 1,244,169 · -0.5%
- By 2075
- 1,197,693 · -4.2%
- By 2100
- 1,093,187 · -12.6%
Race, ethnicity, and origin ACS 2023
- Neighborhood character
- Diverse neighborhood (Simpson 0.58)
- Race & ethnicity
- White 51% Black 40% Two or more races 7% Hispanic / Latino 2%
- Common ancestry
- Romanian 5% Serbian 2% Slovak 1%
- Foreign-born
- 4% · Canada
- Languages at home
- 97% English-only · Other Indo-European 1% Spanish 1%
Political lean MEDSL · Allegheny
- 2024 margin
- Strong D (+20.3) · D 59.7% · R 39.4%
- 2008→2024 swing
- +4.8pp toward D · 2008: 15.5pp · 2024: 20.3pp
- All cycles
- 2024: D+20.3 2020: D+20.4 2016: D+16.4 2012: D+14.4 2008: D+15.5
Not yet ingested
- Civics
- —
Market trends
- HPI YoY
- ▼ -121.68%
- Current HPI
- 235.4861
- Rent YoY
- ▲ 7.63%
- Metro
- Pittsburgh, PA
- State GDP YoY
- ▲ 1.68%
- F500 in state
- 34
Industry mix (Fortune 500 HQ in PA)
| Industry | F500 HQs | Revenue |
|---|---|---|
| Healthcare | 2 | $309B |
|
||
| Insurance | 2 | $27B |
|
||
| Telecommunications / Media | 1 | $124B |
|
||
| Industrial Distribution | 1 | $22B |
|
||
| Financial Services | 1 | $20B |
|
||
| Chemicals / Materials | 1 | $18B |
|
||
Price history
+581.8% since first listed4 events — show timeline
- 2026-05-19 Listed $150,000 West Penn MLS
- 2016-12-30 Sold (Public Records) $46,805 Public Records
- 2015-11-16 Sold (Public Records) $37,000 Public Records
- 1991-10-03 Sold (Public Records) $22,000 Public Records
Property tax history
+2.5%/yrLatest (2026): $1,830 · +0.0% YoY. Source: county tax records.
Cash-flow waterfall
monthlySold comps — $/sqft
last 12 mo · ≤1 miLoading sold comps…