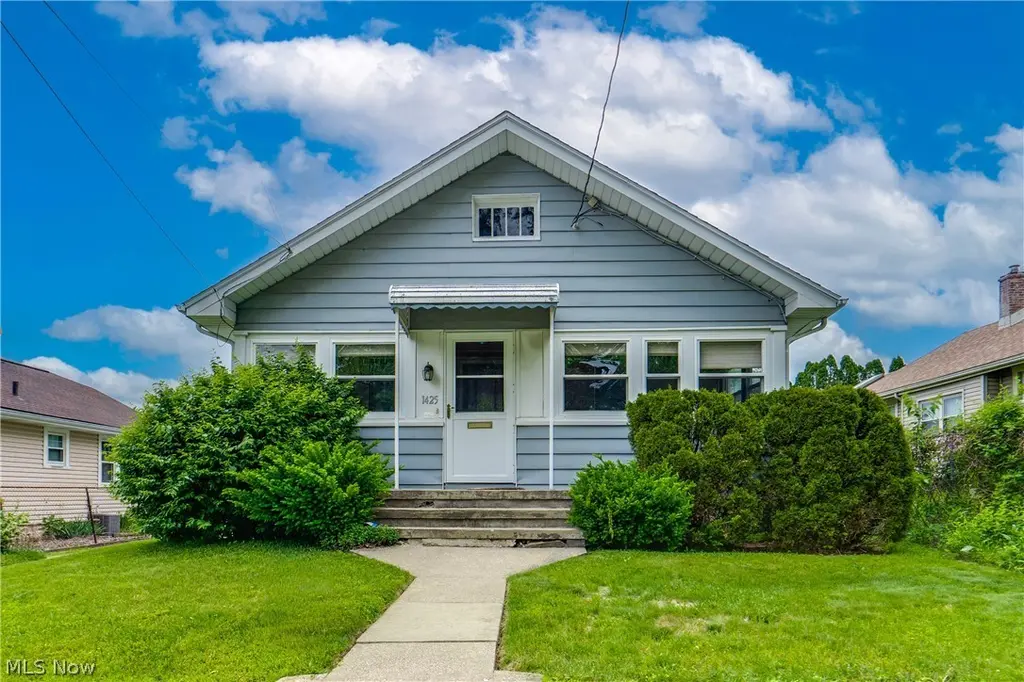
1425 Chippewa Ave · Akron, OH
Flood risk 1/10 · Minimal
- FEMA flood zone
- X (unshaded)
- Chance of flooding over 30 yrs
- 0.0%
- Est. flood insurance / yr
- $473 – $860
Fire risk 1/10 · Minimal
- Est. fire insurance / yr
- $713 – $1,323
Heat risk 3/10 · Minor
- Hot days now (above 96°F)
- 7 days/yr
- Hot days in 30 yrs
- 17 days/yr
Wind risk 1/10 · Minimal
- Chance of severe wind over 30 yrs
- —
Air-quality risk 3/10 · Minor
- Unhealthy air days now
- 2 days/yr
- Unhealthy air days in 30 yrs
- 4 days/yr
Risk factors via First Street. Map © Google.
Why this score? — see what drove the C+ grade
The composite is a weighted blend of 9 inputs, each scored 0–100. Each bar is that input's sub-score; the figure is the points it added to the 100-point composite (weight × sub-score).
- Cash flow +25.0/30.0
- ARV discount +12.4/15.0
- DSCR +8.1/10.0
- 1% rule +6.4/10.0
- Livability +4.0/5.0
- Rent growth +3.6/5.0
- Condition / age +2.5/5.0
- Schools +2.1/10.0
- Appreciation +0.0/10.0
$95,000
🖨 Deal sheet (PDF) 📄 Offer letter ✓ Due diligence
Listing remarks
Charming Ranch in Goodyear Heights – Lovingly Maintained by Long-Time Owner. Don't miss this well-cared-for ranch nestled in the Goodyear Heights neighborhood, owned and meticulously maintained for many years. Rich with character, this home showcases beautiful original woodwork, gleaming hardwood floors, and tall baseboards. Step into the inviting enclosed front porch — the perfect spot to enjoy the neighborhood — and into a warm, welcoming living room. The comfortable living room flows into a formal dining room featuring charming built-in cabinetry framed by a large window. The kitchen offers cabinet space, and hardwood floors. Just off the kitchen, a sunny breakfast nook
Key facts
- Built-in cabinetry
- Formal dining room
- Sunny breakfast nook
Tags
Property features AI
Exterior
- Parking: Detached garage with 1 garage space; Driveway (unpaved)
- Utilities: Public water; Public sewer
- Home design: Single-story; Above-grade finished area approximately 934 (assessor)
- Construction: Aluminum siding; Asphalt/fiberglass roof
- Exterior features: Enclosed porch; Patio; Porch
Interior
- Kitchen: Range; Microwave
- Bedrooms: 2 main-level bedrooms
- Flooring: Wood flooring in kitchen, nook and bedrooms; Carpet in enclosed porch, living and dining rooms
- Bathrooms: 1 full bathroom (main level)
- Heating & cooling: Forced air heating (gas); Central air conditioning
- Interior features: Enclosed front porch; Full unfinished basement
- Laundry & utility: Washer; Dryer (laundry in basement)
Neighborhood map
What this means for you Summary
Snapshot
- This is a 2-bed/1.0-bath single-family listed at $95k.
Deal economics
- At list price, monthly cash flow is $206 ($2k/yr) — positive.
- The deal already cash-flows at list — no discount required.
- Meets the 1% rule at list price ($1k rent vs $95k).
- Recommended offer: $94k (1.5% below list) — sets the bar for market timing.
- Cap rate 8.9% vs local median 6.6% in Akron — top-decile yield for the area; either an underpriced asset or a hidden risk that comps aren't pricing in. Stress-test before assuming the spread holds.
Location & tenants
- Location reads 81/100 on livability (#104 in OH, #1,591 nationally) — a professional / high-income tenant draw. Strengths: amenities A+, commute A+, cost of living A+; Watch: crime F, employment F.
- Akron City (urban): math 22% / reading 30% proficiency, ranked #602 of 656 in OH (top 92%) — low school quality limits family demand, transient renter base, plan for 1-2y turnover; 66% free/reduced lunch — lower-income household profile, screen leases tightly.
- Zoned schools: Seiberling Community Learning Center (math 22% / reading 22%, grade F, #1,242 of 1,584 statewide, top 80%, 477 students, 0% FRL); National Inventors Hall of Fame School Center For Stem (math 45% / reading 56%, grade C, #413 of 654 statewide, top 63%, 406 students, 0% FRL); Akron Early College High School (math 62% / reading 98%, grade A, #34 of 781 statewide, top 4%, 377 students, 0% FRL) — zoned schools average 0% FRL vs 66% district-wide (66 pts lower); this property's tenant base skews higher-income than the district average.
- Zoned-school proficiency averages 51% at this address vs 26% district-wide (+25 pts) — the actual schools serving this property are materially stronger than the Akron City average implies; a family-tenant draw the district grade alone would hide.
- Market conditions: Rents rising fast (+4.5%/yr); 101 active listings in the ZIP; 27 comparable units currently listed for rent nearby; rentals lingering (median 45d on market — plan ~5-8 weeks vacancy on turnover, expect pricing pressure); 59% of comp listings sitting > 30 days — soft ceiling on asking rent; 1,114 units permitted in Summit County in 2024 (397 in 5+ unit buildings).
Forward outlook
- Local home prices are declining (-3.0%/yr); year-one equity from $657 of loan paydown is wiped out by about $3k of value loss. Plan a longer hold.
- Summit County population projected to shrink 6% by 2050 — rents likely to lag national; underwrite the cash flow, not the appreciation.
- At projected returns (-3.0% appreciation + 4.5% rent growth), your $27k cash investment doubles in ~10 years — after that, you're playing with house money.
Negotiation context
- It's been on market 16 days — a 2% lower offer ($94k) is reasonable based on typical stale-listing flexibility.
- Current owner paid $45k; list at $95k implies a 111% gain — meaningful room to come down on a strong offer.
Risks & watch-outs
- Watch-outs: built in 1928 — expect roof / HVAC / electrical / plumbing capex.
Questions for the listing agent
- Built in 1928 — when were the roof, HVAC, electrical panel, plumbing, and water heater last replaced?
- Is there a deadline driving the sale (1031 exchange, divorce, estate, relocation)? That informs how much negotiation room exists.
- Crime grade is F in this area — have there been break-ins, vandalism, or insurance claims at this property in the last 3 years? What carrier currently insures it and at what premium?
- What's the average days-on-market for RENTAL listings here right now (not sales)? A rising rental-DOM trend means longer vacancies and softer asking-rent achievability than the comps imply.
- What's the recent tenant-quality profile in this submarket — average credit score on applications, eviction rate, late-payment / NSF rate, and stable-employment percentage? A property-management company in the area should have these aggregated.
- How much new for-sale + rental construction is in the pipeline within 1–3 miles? Heavy new supply typically softens prices + rents 12–24 months out; constrained supply supports both.
Investment metrics
- 1% rule
- 1.14% ✓
- Cap rate
- 8.89%
- Cash-on-cash
- 9.29%
- DSCR
- 1.41
- GRM
- 7.3
CMA / ARV
- ARV (on-the-fly)
- $106,476
- Comps found
- 12
Show comp detail 12 sales within ~0.75 mi
| Address | Dist | Beds/Ba | Sqft | Sold | Price | $/sf | Match |
|---|---|---|---|---|---|---|---|
| 1379 Ottawa Ave | 0.09mi | 3/1.0 (+1) | 999 (+7%) | 4mo | $99,500 | $100 | 76 |
| 1371 Laffer Ave | 0.21mi | 3/1.0 (+1) | 960 (+3%) | 7mo | $120,000 | $125 | 75 |
| 1604 Ottawa Ave | 0.36mi | 2/1.0 | 950 (+2%) | 7mo | $127,000 | $134 | 74 |
| 1177 Smithfarm Ave | 0.50mi | 2/1.0 | 992 (+6%) | 2mo | $113,000 | $114 | 65 |
| 1102 Tonawanda Ave | 0.56mi | 3/1.0 (+1) | 960 (+3%) | 1mo | $97,000 | $101 | 63 |
| 1318 Arnold Ave | 0.31mi | 3/1.0 (+1) | 1,056 (+13%) | 5mo | $99,900 | $95 | 54 |
| 1364 Eastwood Ave | 0.62mi | 2/1.0 | 1,027 (+10%) | 3mo | $83,000 | $81 | 52 |
| 1792 Malasia Rd | 0.74mi | 2/1.0 | 1,000 (+7%) | 8mo | $117,000 | $117 | 47 |
| 1530 Indianola Ave | 0.63mi | 3/1.0 (+1) | 1,020 (+9%) | 6mo | $129,900 | $127 | 45 |
| 712 Frase Ave | 0.48mi | 3/1.5 (+1) | 1,056 (+13%) | 6mo | $113,300 | $107 | 44 |
| 853 Brittain Rd | 0.73mi | 3/1.0 (+1) | 1,032 (+10%) | 4mo | $145,000 | $141 | 40 |
| 1082 Hazel St | 0.71mi | 3/1.0 (+1) | 1,056 (+13%) | 2mo | $112,100 | $106 | 38 |
Match score weights: distance 35% · size 25% · config 20% · recency 20%. Top-matched comps best support the ARV.
Projected returns pro-forma
-3.0% appreciation · 4.51% rent growth · sell at horizon
- IRR
- -0.6%
- Equity multiple
- 0.98×
- Total profit
- $-598
- Equity at exit
- $14,165
- IRR
- 10.6%
- Equity multiple
- 1.88×
- Total profit
- $23,492
- Equity at exit
- $8,214
Cash invested: $26,600 (down + closing). Projections, not guarantees.
Landlord ↔ Tenant lean methodology
- Overall (STATE)
- 73 Landlord-Friendly
- State Ohio
- 73 Landlord-Friendly · R+6
- County
- — inherits STATE
- City
- — inherits STATE
ZIP-level market 44305
- Rents YoY
- 4.5%
- Active inventory
- 101
- Price-to-rent
- 7.3×
Monthly cashflow live
- Estimated rent
- $1,085 high interval (Pro) →
- Mortgage (P&I)
- −$498
- Tax from tax record
- −$113 /mo · $1,358/yr
- Insurance
- −$40
- HOA
- −$0
- Vacancy / Maint / Mgmt
- −$228
- Net cashflow
- $206
Break-even live
Sensitivity live
| Price | -10% $260 | -5% $233 | +0% $206 | +5% $179 | +10% $152 |
|---|---|---|---|---|---|
| Rent | -10% $120 | -5% $163 | +0% $206 | +5% $249 | +10% $292 |
| Rate | -1.0pp $254 | -0.5pp $230 | base $206 | +0.5pp $181 | +1.0pp $156 |
UW: 25.0% down · 7.5% · 30yr · 1.5% tax · 5.0% vac · 8.0% maint · 8.0% mgmt
Financing live
Cash to close
- Down payment
- $23,750
- Closing costs
- $2,850
- Reserves months
- —
- Total cash needed
- —
Loan-product check · same deal, 3 products live
Conventional
25% down · 7.5% · 30yr
- Down + closing
- —
- Monthly P&I
- —
- Monthly cashflow
- —
- DSCR
- —
- Eligible?
- —
Personal DTI + credit; lowest rate.
DSCR
20% down · 8.5% · 30yr
- Down + closing
- —
- Monthly P&I
- —
- Monthly cashflow
- —
- DSCR
- —
- Eligible?
- —
No personal income docs; deal must DSCR.
Hard money
10% down · 12.0% · 12mo
- Down + closing
- —
- Monthly P&I
- —
- Monthly cashflow
- —
- DSCR
- —
- Eligible?
- —
Short-term bridge; refi at stabilization.
Rent comps 27 comps
| Address | Beds | Baths | Sqft | Rent | $/sqft | DOM | Units | Dist |
|---|---|---|---|---|---|---|---|---|
| 1318 Arnold Ave Akron, OH | 3.0 | 1.0 | 1056 | $1,450 | $1.37 | 45d | 1 | 0.28mi |
| 237 Kryder Ave Unit 237 Akron, OH | 2.0 | 1.0 | 860 | $850 | $0.99 | 46d | 1 | 0.48mi |
| 676 Grifton Ave Akron, OH | 2.0 | 1.0 | 703 | $1,000 | $1.42 | 45d | 1 | 0.61mi |
| 680 Grifton Ave Akron, OH | 2.0 | 1.0 | 828 | $1,050 | $1.27 | 25d | 1 | 0.62mi |
| 208 Barder Ave Akron, OH | 3.0 | 1.0 | 924 | $1,050 | $1.14 | 45d | 1 | 0.62mi |
| 243 Watson St Akron, OH | 2.0 | 1.0 | 750 | $950 | $1.27 | 45d | 1 | 0.64mi |
| 1428 Sara Ave Akron, OH | 2.0 | 1.0 | 1080 | $1,050 | $0.97 | 15d | 1 | 0.64mi |
| 1190 Hazel St Akron, OH | 3.0 | 1.0 | 1124 | $1,425 | $1.27 | 45d | 1 | 0.70mi |
| 1820 Malasia Rd Unit 2 Akron, OH | 2.0 | 1.0 | 741 | $925 | $1.25 | 45d | 1 | 0.81mi |
| 1820 Malasia Rd Akron, OH | 2.0 | 1.0 | 741 | $895 | $1.21 | 22d | 1 | 0.81mi |
| 857 Kennebec Ave Akron, OH | 3.0 | 1.0 | 1008 | $1,350 | $1.34 | 46d | 1 | 0.85mi |
| 109 Kent Ct Akron, OH | 2.0 | 1.0 | 1032 | $1,142 | $1.11 | 25d | 1 | 0.94mi |
| 1635 Bronson Rd Akron, OH | 3.0 | 1.0 | 1110 | $1,245 | $1.12 | 15d | 1 | 0.94mi |
| 1628 E Market St Akron, OH | 2.0 | 1.0 | 800 | $850 | $1.06 | 45d | 1 | 0.94mi |
| 1044 Brittain Rd Unit 1050 Akron, OH | 1.0 | 1.0 | 700 | $785 | $1.12 | 45d | 1 | 1.07mi |
| 1050 Brittain Rd Akron, OH | 1.0 | 1.0 | 700 | $785 | $1.12 | 45d | 1 | 1.07mi |
| 134 N Arlington St Akron, OH | 2.0 | 1.0 | 964 | $900 | $0.93 | 25d | 1 | 1.09mi |
| 167 Chittenden St #1 Akron, OH | 2.0 | 1.0 | 900 | $850 | $0.94 | 45d | 1 | 1.18mi |
| 167 Chittenden St Unit 3 Akron, OH | 1.0 | 1.0 | 575 | $700 | $1.22 | 45d | 1 | 1.18mi |
| 167 Chittenden St Apt 2 Akron, OH | 2.0 | 1.0 | 900 | $825 | $0.92 | 45d | 1 | 1.18mi |
| 797 E Market St Apt 209 Akron, OH | 1.0 | 1.0 | 600 | $1,350 | $2.25 | 25d | 1 | 1.19mi |
| 797 E Market St Apt 220 Akron, OH | 2.0 | 1.5 | 1100 | $1,500 | $1.36 | 25d | 1 | 1.19mi |
| 166 Chittenden St Akron, OH | 3.0 | 1.0 | 1020 | $985 | $0.97 | 45d | 1 | 1.20mi |
| 481 Tompkins Ave Akron, OH | 2.0 | 1.0 | 800 | $749 | $0.94 | 15d | 1 | 1.24mi |
| 801 E Exchange St Akron, OH | 2.0 | 1.0 | 850 | $925 | $1.09 | 25d | 1 | 1.33mi |
| 783 E Exchange St Unit 2nd Akron, OH | 2.0 | 1.0 | 951 | $875 | $0.92 | 25d | 1 | 1.36mi |
| 377 Talbot Ave Akron, OH | 2.0 | 1.0 | 1070 | $1,050 | $0.98 | 45d | 1 | 1.50mi |
Listing history 17 events
-
2026-06-21days on market $95,000 Active 16 DOM
-
2026-06-18days on market $95,000 Active 13 DOM
-
2026-06-17days on market $95,000 Active 12 DOM
-
2026-06-16days on market $95,000 Active 11 DOM
-
2026-06-15days on market $95,000 Active 10 DOM
-
2026-06-14days on market $95,000 Active 8 DOM
-
2026-06-13days on market $95,000 Active 7 DOM
-
2026-06-10days on market $95,000 Active 5 DOM
-
2026-06-09days on market $95,000 Active 4 DOM
-
2026-06-08days on market $95,000 Active 3 DOM
-
2026-06-07pricedays on market $95,000 Active 2 DOM
-
2026-06-05days on market $109,900 Active 4 DOM
-
2026-06-03days on market $109,900 Active 3 DOM
-
2026-06-03status $109,900 Active 2 DOM
-
2026-05-25$109,900 Active
-
1993-10-06soldstatus $45,000
-
1989-06-30soldstatus $36,000
ⓘ Source: listings_history table (triggers on properties + properties_extension) + one-shot
backfill from property_details.listing_events for pre-trigger history.
Tax reassessment forecast OH · Partial reset (capped growth)
- Current annual tax
- $1,358 · $113/mo
- Projected year-2 tax
- $1,420 · $118/mo
- Expected delta
- +$62/yr (+$5/mo · 4.6%)
ⓘ Screening estimate from a state-policy table — verify with the county assessor before closing.
Climate risk First Street
- Flood 1/10 Low FEMA zone X (unshaded) · 0% chance over 30 yrs
- Wildfire 1/10 Low
- Heat 3/10 Moderate 7 d/yr ≥96°F today · 17 d/yr by 30 yrs out
- Wind 1/10 Low
- Air quality 3/10 Moderate 2 unhealthy d/yr today · 4 by 30 yrs out
Nearby sold comps map
Loading sold comps map…
Walkable amenities ~0.75 mi
Loading nearby amenities…
Taxation est. · year 1
- Rental income
- $13,014
- − Mortgage interest
- −$5,321
- − Property taxes
- −$1,358
- − Insurance
- −$475
- − Repairs & maintenance
- −$1,041
- − Management
- −$1,041
- − Depreciation
- −$2,764
- Taxable income
- $1,014
- Est. tax owed @ 24.0%
- −$243
- After-tax cash flow
- $2,227/yr
For passive investors: Depreciation is non-cash, so a rental often shows a tax loss while cash-flowing — sheltering income. Rental losses are passive: they offset passive income freely, and up to $25,000/yr can offset ordinary (W-2) income if you actively participate and your MAGI is under $100k (phasing out to $0 by $150k); unused losses carry forward. On sale, claimed depreciation is recaptured at up to 25%, and gains may owe capital-gains tax (a 1031 exchange can defer both). Figures are a year-1 estimate at your 24.0% rate — not tax advice; consult a CPA.
Schools (NCES district)
- District
- Akron City
- NCES district ID
- 3904348
- Math proficiency
- 22% ▼ -17.00%
- Reading proficiency
- 30% ▼ -12.00%
- Median HH income
- $33,811
- Composite
- 21.31/100
- National rank
- #8383
- State rank
- #602 of 656 in OH
Livability — Akron
- Score
- 81/100
- State rank
- #104
- US rank
- #1591
Category grades
Schools grade is shown separately in the Schools card above.
Census & demographics
- Census place
- Akron, OH
- County
- Summit County · 440,783 people
- City population
- 174,375
- Metro
- Akron, OH
- Population (ZIP)
- 21,103
- Household income
- $52,768
- Rent vs Own
- Severe rent burden
- 1021.0
Population outlook (Summit County) Hauer SSP2
- Today (2025)
- 546,583 people
- By 2030
- 544,028 · -0.5%
- By 2040
- 531,363 · -2.8%
- By 2050
- 514,923 · -5.8%
- By 2075
- 481,765 · -11.9%
- By 2100
- 432,265 · -20.9%
Race, ethnicity, and origin ACS 2023
- Neighborhood character
- Diverse neighborhood (Simpson 0.57)
- Race & ethnicity
- White 62% Black 20% Two or more races 12% Asian 5% Hispanic / Latino 2%
- Common ancestry
- Lithuanian 3% Slovak 2% Romanian 2%
- Foreign-born
- 4% · India, Philippines, Canada
- Languages at home
- 94% English-only · Other Asian/Pacific 3% Other Indo-European 1% Spanish 1%
Political lean MEDSL · Summit
- 2024 margin
- Lean D (+7.0) · D 53.0% · R 46.0%
- 2008→2024 swing
- -9.6pp toward R · 2008: 16.6pp · 2024: 7.0pp
- All cycles
- 2024: D+7.0 2020: D+9.6 2016: D+8.2 2012: D+14.8 2008: D+16.6
Not yet ingested
- Civics
- —
Market trends
- HPI YoY
- ▼ -140.39%
- Current HPI
- 190.6223
- Rent YoY
- ▲ 4.51%
- Metro
- Akron, OH
- State GDP YoY
- ▲ 1.98%
- F500 in state
- 48
Industry mix (Fortune 500 HQ in OH)
| Industry | F500 HQs | Revenue |
|---|---|---|
| Insurance | 3 | $145B |
|
||
| Industrial Machinery | 3 | $49B |
|
||
| Financial Services | 3 | $24B |
|
||
| Consumer Goods | 2 | $93B |
|
||
| Aerospace / Defense | 2 | $47B |
|
||
| Utilities | 2 | $33B |
|
||
Price history
+205.3% since first listed3 events — show timeline
- 2026-05-25 Listed $109,900 MLSNOW
- 1993-10-06 Sold (Public Records) $45,000 Public Records
- 1989-06-30 Sold (Public Records) $36,000 Public Records
Property tax history
+4.6%/yrLatest (2025): $1,358 · -1.4% YoY. Source: county tax records.
Cash-flow waterfall
monthlySold comps — $/sqft
last 12 mo · ≤1 miLoading sold comps…