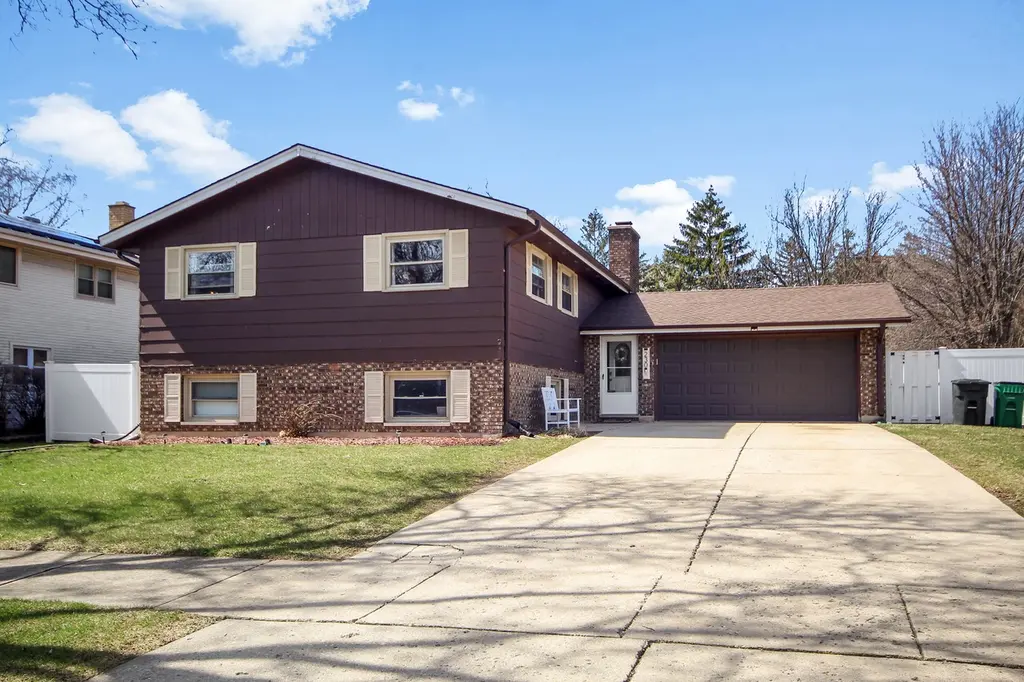
230 Millford Ln · Bloomingdale, IL
Flood risk 1/10 · Minimal
- FEMA flood zone
- X (unshaded)
- Chance of flooding over 30 yrs
- 0.0%
- Est. flood insurance / yr
- $507 – $1,088
Fire risk 1/10 · Minimal
- Est. fire insurance / yr
- $804 – $1,492
Heat risk 3/10 · Minor
- Hot days now (above 103°F)
- 7 days/yr
- Hot days in 30 yrs
- 14 days/yr
Wind risk 2/10 · Minimal
- Chance of severe wind over 30 yrs
- 0.0%
Air-quality risk 3/10 · Minor
- Unhealthy air days now
- 4 days/yr
- Unhealthy air days in 30 yrs
- 4 days/yr
Risk factors via First Street. Map © Google.
Why this score? — see what drove the D+ grade
The composite is a weighted blend of 9 inputs, each scored 0–100. Each bar is that input's sub-score; the figure is the points it added to the 100-point composite (weight × sub-score).
- ARV discount +13.8/15.0
- Cash flow +12.9/30.0
- 1% rule +4.1/10.0
- DSCR +3.9/10.0
- Livability +3.9/5.0
- Schools +3.6/10.0
- Rent growth +2.5/5.0
- Condition / age +2.5/5.0
- Appreciation +0.0/10.0
$479,000
🖨 Deal sheet 📄 Offer letter ✓ Due diligence
Listing remarks
Location dialed in-right in the center of Bloomingdale-this 2,400+ sq ft split-level delivers both space and style. With 4 bedrooms, 3 full baths, and a sleek open kitchen featuring a butcher block island and stainless appliances, it's built for modern living. Downstairs brings the vibe: spacious family room, brick fireplace, wet bar, and walkout to a fenced yard with deck/patio-perfect for entertaining. Across from the library, Village Hall, and police station, and just steps to parks, shopping, and top-rated District 13 schools.
Key facts
- Split-level
- Wet bar
- Brick fireplace
Tags
Property features AI
Finance
- Other: Property assessed/area information sourced from assessor
- HOA & community: No master association fee required
Exterior
- Parking: Attached garage with 2 garage spaces; Concrete driveway; Garage door opener; Owned garage
- Utilities: Lake Michigan water source; Public sewer; Electric with circuit breakers
- Home design: Detached single-family home; Split-level / bi-level design; Fee simple ownership
- Construction: Built approximately 41–50 years ago; Brick and cedar exterior; Asphalt roof; Concrete perimeter foundation
- Exterior features: Deck; Patio; Fenced yard; Sidewalks
Interior
- Kitchen: Island and eating area/table space; Range; Microwave; Dishwasher; Refrigerator; Disposal; Bar fridge
- Bedrooms: Master bedroom on main level (includes full bath); Three additional bedrooms — two on main level and one on lower level
- Flooring: Hardwood; Laminate; Porcelain tile
- Bathrooms: Three full bathrooms (one located in the basement)
- Heating & cooling: Natural gas forced-air heating; Central air conditioning
- Interior features: Finished basement with partial exposure and walk-up/walk-out access; 8 total rooms; Gas starter fireplace in the basement; Carbon monoxide detectors; Ceiling fans; Sump pump
- Laundry & utility: In-unit laundry; Washer; Dryer
Neighborhood map
What this means for you Summary
Snapshot
- This is a 4-bed/3.0-bath single-family listed at $479k.
Deal economics
- At list price, monthly cash flow is $-34 ($-410/yr) — negative.
- To cash-flow at today's rent, offer at most $473k (1.3% below list).
- To meet the 1% rule (rent ≥ 1% of price), the offer needs to be $437k (8.7% below list).
- Recommended offer: $437k (8.7% below list) — sets the bar for 1% rule.
- Cap rate 6.2% vs local median 3.1% in Bloomingdale — top-decile yield for the area; either an underpriced asset or a hidden risk that comps aren't pricing in. Stress-test before assuming the spread holds.
Location & tenants
- Location reads 78/100 on livability (#141 in IL, #2,595 nationally) — a middle-class / working-renter tenant base. Strengths: crime A+, employment A+, housing A+; Watch: cost of living D+, amenities F.
- Lake Park Chsd 108 (suburban): math 37% / reading 43% proficiency, ranked #128 of 620 in IL (top 21%) — families likely to look elsewhere, expect single-tenant / working-renter base with shorter leases.
- Zoned schools: Lake Park High School (math 37% / reading 43%, grade F, #85 of 693 statewide, top 12%, 2,560 students, 0% FRL).
- Market conditions: 48 active listings in the ZIP; 2 comparable units currently listed for rent nearby; solid renter incomes; 1,378 units permitted in DuPage County in 2024 (594 in 5+ unit buildings).
- At $4,374/mo this rent would consume 51% of the median local household income ($103k/yr) (locally 480% of renters already pay >50% of income on rent) — very limited rent-growth headroom before tenants either downsize or default.
Forward outlook
- Local home prices are declining (-3.0%/yr); year-one equity from $3k of loan paydown is wiped out by about $14k of value loss. Plan a longer hold.
Negotiation context
- It's been on market 62 days — a 6% lower offer ($450k) is reasonable based on typical stale-listing flexibility.
- 3 sale attempts since 4y ago; this cycle's ask has dropped $40k (8%) from the opening price — seller is motivated, your offer sets the floor, not the list.
- Current owner paid $405k; 18% above their basis — modest negotiation headroom, anchor on the comps not their cost.
Questions for the listing agent
- What do current leases actually rent for vs. the listed asking? Can we see a recent rent roll and the last 12 months of T-12 income?
- It's been on market 62 days. Have you received any prior offers? Is the seller open to a 9% concession, seller financing, or rate buy-down credit?
- Built in 1976 — when were the roof, HVAC, electrical panel, plumbing, and water heater last replaced?
- Why hasn't it sold? Are there any deal-killer items the seller is aware of (foundation, flood, title, zoning, code violations)?
- Is there a deadline driving the sale (1031 exchange, divorce, estate, relocation)? That informs how much negotiation room exists.
- The area grade is low — what's the realistic commute time and amenity access for the typical tenant pool here? Any planned neighborhood developments (good or bad) we should know about?
- What's the average days-on-market for RENTAL listings here right now (not sales)? A rising rental-DOM trend means longer vacancies and softer asking-rent achievability than the comps imply.
- What's the recent tenant-quality profile in this submarket — average credit score on applications, eviction rate, late-payment / NSF rate, and stable-employment percentage? A property-management company in the area should have these aggregated.
- How much new for-sale + rental construction is in the pipeline within 1–3 miles? Heavy new supply typically softens prices + rents 12–24 months out; constrained supply supports both.
Investment metrics
- 1% rule
- 0.91% ✗
- Cap rate
- 6.21%
- Cash-on-cash
- -0.31%
- DSCR
- 0.99
- GRM
- 9.1
CMA / ARV
- ARV (on-the-fly)
- $556,444
- Comps found
- 12
Show comp detail 12 sales within ~0.75 mi
| Address | Dist | Beds/Ba | Sqft | Sold | Price | $/sf | Match |
|---|---|---|---|---|---|---|---|
| 254 Bunting Ln | 0.29mi | 4/4.0 | 2,368 (+1%) | 0mo | $585,000 | $247 | 80 |
| 205 Cambridge Ln | 0.28mi | 3/2.5 (-1) | 2,368 (+1%) | 1mo | $555,000 | $234 | 77 |
| 168 Hingham Ln | 0.44mi | 4/3.5 | 2,489 (+6%) | 3mo | $780,000 | $313 | 64 |
| 315 Norton Ln | 0.52mi | 4/2.5 | 2,482 (+6%) | 2mo | $565,000 | $228 | 62 |
| 308 Plymouth Ln | 0.52mi | 4/2.5 | 2,482 (+6%) | 2mo | $535,000 | $216 | 62 |
| 198 S Circle Ave | 0.47mi | 5/2.5 (+1) | 2,374 (+2%) | 11mo | $405,000 | $171 | 59 |
| 258 Thrasher St | 0.70mi | 4/3.0 | 2,474 (+6%) | 6mo | $537,500 | $217 | 53 |
| 178 Bobwhite Ct | 0.58mi | 4/2.5 | 2,588 (+11%) | 2mo | $615,000 | $238 | 51 |
| 182 Lockwood Ln | 0.67mi | 5/2.5 (+1) | 2,155 (-8%) | 0mo | $485,000 | $225 | 49 |
| 177 Cardinal Dr | 0.64mi | 4/3.0 | 2,078 (-11%) | 7mo | $549,000 | $264 | 46 |
| 352 Eagle Ln | 0.50mi | 3/2.5 (-1) | 2,044 (-13%) | 10mo | $695,000 | $340 | 41 |
| 158 S Prairie Ave | 0.64mi | 3/2.0 (-1) | 2,000 (-14%) | 7mo | $559,000 | $280 | 31 |
Match score weights: distance 35% · size 25% · config 20% · recency 20%. Top-matched comps best support the ARV.
Projected returns pro-forma
-3.0% appreciation · 3.0% rent growth · sell at horizon
- IRR
- -16.8%
- Equity multiple
- 0.41×
- Total profit
- $-79,617
- Equity at exit
- $71,420
- IRR
- -8.5%
- Equity multiple
- 0.47×
- Total profit
- $-71,413
- Equity at exit
- $41,415
Cash invested: $134,120 (down + closing). Projections, not guarantees.
Landlord ↔ Tenant lean methodology
- Overall (STATE)
- 43 Moderately Tenant-Leaning
- State Illinois
- 43 Moderately Tenant-Leaning · D+7
- County
- — inherits STATE
- City
- — inherits STATE
ZIP-level market 60108
- Active inventory
- 48
- Price-to-rent
- 9.1×
Monthly cashflow live
- Estimated rent
- $4,374 medium interval (Pro) →
- Mortgage (P&I)
- −$2,512
- Tax from tax record
- −$778 /mo · $9,337/yr
- Insurance
- −$200
- HOA
- −$0
- Vacancy / Maint / Mgmt
- −$919
- Net cashflow
- $-34
Break-even live
UW: 25.0% down · 7.5% · 30yr · 1.5% tax · 5.0% vac · 8.0% maint · 8.0% mgmt
Financing live
Cash to close
- Down payment
- $119,750
- Closing costs
- $14,370
- Reserves months
- —
- Total cash needed
- —
Loan-product check · same deal, 3 products live
Conventional
25% down · 7.5% · 30yr
- Down + closing
- —
- Monthly P&I
- —
- Monthly cashflow
- —
- DSCR
- —
- Eligible?
- —
Personal DTI + credit; lowest rate.
DSCR
20% down · 8.5% · 30yr
- Down + closing
- —
- Monthly P&I
- —
- Monthly cashflow
- —
- DSCR
- —
- Eligible?
- —
No personal income docs; deal must DSCR.
Hard money
10% down · 12.0% · 12mo
- Down + closing
- —
- Monthly P&I
- —
- Monthly cashflow
- —
- DSCR
- —
- Eligible?
- —
Short-term bridge; refi at stabilization.
Rent comps 2 comps
| Address | Beds | Baths | Sqft | Rent | $/sqft | DOM | Units | Dist |
|---|---|---|---|---|---|---|---|---|
| 196 Rosedale Ct Bloomingdale, IL | 5.0 | 3.0 | 3287 | $6,000 | $1.83 | 1d | 1 | 0.55mi |
| 314 Morningside Dr Apt B Bloomingdale, IL | 3.0 | 2.5 | 2000 | $3,200 | $1.60 | 1d | 1 | 1.33mi |
Listing history 26 events
-
2026-06-18days on market $479,000 Active 62 DOM
-
2026-06-17days on market $479,000 Active 61 DOM
-
2026-06-16days on market $479,000 Active 60 DOM
-
2026-06-15days on market $479,000 Active 59 DOM
-
2026-06-13days on market $479,000 Active 57 DOM
-
2026-06-13pricedays on market $479,000 Active 56 DOM
-
2026-06-09days on market $499,000 Active 53 DOM
-
2026-06-08days on market $499,000 Active 52 DOM
-
2026-06-07days on market $499,000 Active 51 DOM
-
2026-06-04days on market $499,000 Active 48 DOM
-
2026-06-03days on market $499,000 Active 47 DOM
-
2026-06-02days on market $499,000 Active 46 DOM
-
2026-06-01days on market $499,000 Active 45 DOM
-
2026-05-31days on market $499,000 Active 44 DOM
-
2026-05-05price $499,000
-
2026-04-17$519,000 Active
-
2026-04-17historical
-
2026-04-01Active
-
2022-07-05historical
-
2022-06-10price
-
2022-06-04price
-
2022-05-25Active
-
2021-08-04soldstatus $405,000
-
2002-07-11soldstatus $209,500
-
1986-05-01soldstatus $86,000
-
1986-05-01soldstatus $106,000
ⓘ Source: listings_history table (triggers on properties + properties_extension) + one-shot
backfill from property_details.listing_events for pre-trigger history.
Tax reassessment forecast IL · Partial reset (capped growth)
- Current annual tax
- $9,337 · $778/mo
- Projected year-2 tax
- $10,105 · $842/mo
- Expected delta
- +$768/yr (+$64/mo · 8.2%)
ⓘ Screening estimate from a state-policy table — verify with the county assessor before closing.
Climate risk First Street
- Flood 1/10 Low FEMA zone X (unshaded) · 0% chance over 30 yrs
- Wildfire 1/10 Low
- Heat 3/10 Moderate 7 d/yr ≥103°F today · 14 d/yr by 30 yrs out
- Wind 2/10 Low 0% chance of damaging wind over 30 yrs
- Air quality 3/10 Moderate 4 unhealthy d/yr today · 4 by 30 yrs out
Nearby sold comps map
Loading sold comps map…
Walkable amenities ~0.75 mi
Loading nearby amenities…
Taxation est. · year 1
- Rental income
- $52,488
- − Mortgage interest
- −$26,831
- − Property taxes
- −$9,337
- − Insurance
- −$2,395
- − Repairs & maintenance
- −$4,199
- − Management
- −$4,199
- − Depreciation
- −$13,935
- Taxable loss
- −$8,408
- Est. tax savings @ 24.0%
- +$2,018
- After-tax cash flow
- $1,608/yr
For passive investors: Depreciation is non-cash, so a rental often shows a tax loss while cash-flowing — sheltering income. Rental losses are passive: they offset passive income freely, and up to $25,000/yr can offset ordinary (W-2) income if you actively participate and your MAGI is under $100k (phasing out to $0 by $150k); unused losses carry forward. On sale, claimed depreciation is recaptured at up to 25%, and gains may owe capital-gains tax (a 1031 exchange can defer both). Figures are a year-1 estimate at your 24.0% rate — not tax advice; consult a CPA.
Schools (NCES district)
- District
- Lake Park Chsd 108
- NCES district ID
- 1721840
- Math proficiency
- 37% ▼ -16.00%
- Reading proficiency
- 43% ▼ -6.00%
- Median HH income
- $69,790
- Composite
- 36.37/100
- National rank
- #4684
- State rank
- #128 of 620 in IL
Livability — Bloomingdale
- Score
- 78/100
- State rank
- #141
- US rank
- #2595
Category grades
Schools grade is shown separately in the Schools card above.
Census & demographics
- Census place
- Bloomingdale, IL
- County
- DuPage County · 904,569 people
- City population
- 23,604
- Metro
- Chicago-Naperville-Elgin, IL-IN-WI
- Population (ZIP)
- 23,604
- Household income
- $103,392
- Rent vs Own
- Severe rent burden
- 480.0
Population outlook (DuPage County) Hauer SSP2
- Today (2025)
- 960,187 people
- By 2030
- 965,850 · +0.6%
- By 2040
- 965,812 · +0.6%
- By 2050
- 954,890 · -0.6%
- By 2075
- 910,185 · -5.2%
- By 2100
- 816,255 · -15.0%
Race, ethnicity, and origin ACS 2023
- Neighborhood character
- Predominantly White (69%)
- Race & ethnicity
- White 69% Asian 14% Hispanic / Latino 11% Two or more races 7% Black 4%
- Hispanic origin (detail)
- Mexican 6% Puerto Rican 1%
- Common ancestry
- Romanian 13% Iranian 1% Lithuanian 1%
- Foreign-born
- 19% · Canada, Vietnam, South Korea
- Languages at home
- 75% English-only · Other Indo-European 9% Russian/Polish/Slavic 5% Spanish 5%
Political lean MEDSL · DuPage
- 2024 margin
- D (+13.3) · D 55.9% · R 42.5% · Other 1.6%
- 2008→2024 swing
- +2.5pp toward D · 2008: 10.8pp · 2024: 13.3pp
- All cycles
- 2024: D+13.3 2020: D+18.1 2016: D+14.1 2012: D+1.0 2008: D+10.8
Not yet ingested
- Civics
- —
Market trends
- HPI YoY
- ▼ -196.94%
- Current HPI
- 203.6334
- Rent YoY
- —
- Metro
- Chicago-Naperville-Elgin, IL-IN-WI
- State GDP YoY
- ▲ 1.59%
- F500 in state
- 60
Industry mix (Fortune 500 HQ in IL)
| Industry | F500 HQs | Revenue |
|---|---|---|
| Insurance | 4 | $201B |
|
||
| Consumer Goods | 4 | $87B |
|
||
| Industrial Machinery | 3 | $64B |
|
||
| Healthcare | 2 | $55B |
|
||
| Retail / Pharmacy | 1 | $148B |
|
||
| Agriculture / Food | 1 | $86B |
|
||
Price history
+480.2% since first listed12 events — show timeline
- 2026-05-05 Price Changed $499,000 MRED as Distributed by MLS Grid
- 2026-04-17 Listing Removed — MRED as Distributed by MLS Grid
- 2026-04-17 Listed $519,000 MRED as Distributed by MLS Grid
- 2026-04-01 Listed — MRED as Distributed by MLS Grid
- 2022-07-05 Listing Removed — MRED as Distributed by MLS Grid
- 2022-06-10 Price Changed — MRED as Distributed by MLS Grid
- 2022-06-04 Price Changed — MRED as Distributed by MLS Grid
- 2022-05-25 Listed — MRED as Distributed by MLS Grid
- 2021-08-04 Sold (Public Records) $405,000 Public Records
- 2002-07-11 Sold (Public Records) $209,500 Public Records
- 1986-05-01 Sold (Public Records) $106,000 Public Records
- 1986-05-01 Sold (Public Records) $86,000 Public Records
Property tax history
+3.4%/yrLatest (2024): $9,337 · +8.3% YoY. Source: county tax records.
Cash-flow waterfall
monthlySold comps — $/sqft
last 12 mo · ≤1 miLoading sold comps…