 Multi-family
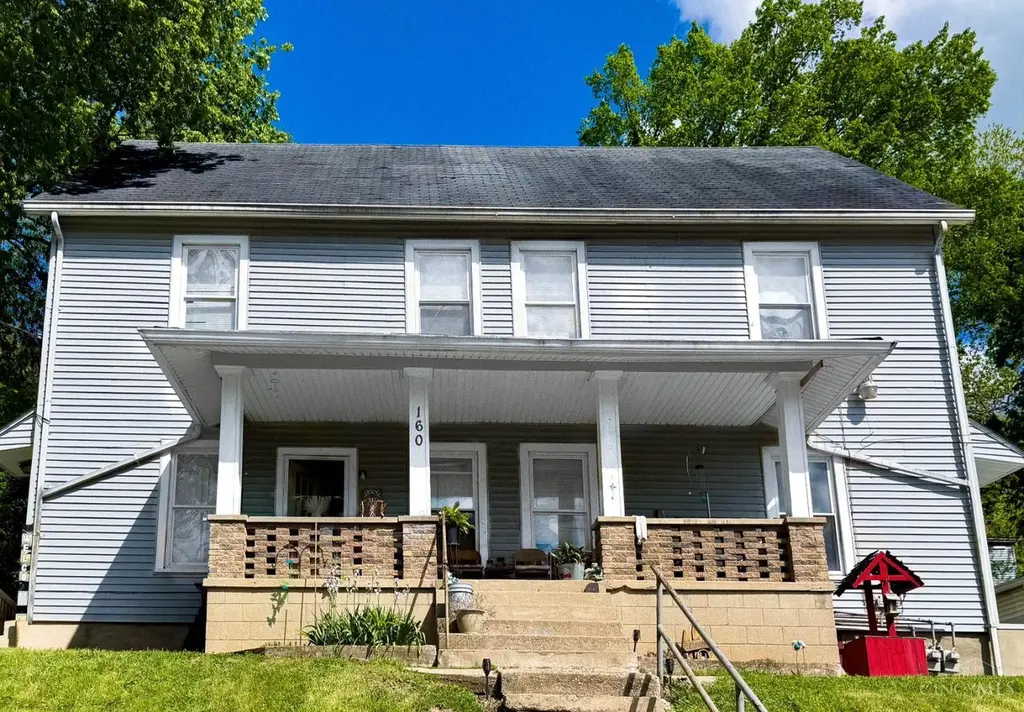
160 First St · Addyston, OH
Flood risk 1/10 · Minimal
- FEMA flood zone
- X (unshaded)
- Chance of flooding over 30 yrs
- 0.0%
- Est. flood insurance / yr
- $473 – $860
Fire risk 1/10 · Minimal
- Est. fire insurance / yr
- $713 – $1,323
Heat risk 4/10 · Minor
- Hot days now (above 102°F)
- 7 days/yr
- Hot days in 30 yrs
- 19 days/yr
Wind risk 2/10 · Minimal
- Chance of severe wind over 30 yrs
- 1.0%
Air-quality risk 2/10 · Minimal
- Unhealthy air days now
- 1 days/yr
- Unhealthy air days in 30 yrs
- 2 days/yr
Risk factors via First Street. Map © Google.
Why this score? — see what drove the B+ grade
The composite is a weighted blend of 9 inputs, each scored 0–100. Each bar is that input's sub-score; the figure is the points it added to the 100-point composite (weight × sub-score).
- Cash flow +30.0/30.0
- DSCR +10.0/10.0
- Appreciation +10.0/10.0
- 1% rule +8.8/10.0
- ARV discount +7.5/15.0
- Schools +5.3/10.0
- Livability +3.4/5.0
- Rent growth +2.5/5.0
- Condition / age +2.5/5.0
$210,000
🖨 Deal sheet (PDF) 📄 Offer letter ✓ Due diligence
Multi-family units
County records classify this as Multi-Family (2-4 Unit). Listing-text estimate: 1 unit. estimate disagrees with records
Listing remarks MLS
Great investment opportunity in Addyston! All units are occupied. Priced to sell. 3 units in building.
Key facts
- 3,964 sq ft lot
- Built 1880
- Listed 51 days
Property features AI
Finance
- Other: Property on a 40 x 100 lot (approx. 0.091 acre)
- Financial info: Three total units; Unit rents: $630, $780, $600 (3-bedroom units reported with market rent around $670); Heat paid by tenants; water paid by owner
- HOA & community: No HOA information provided
Exterior
- Parking: On-street parking
- Security: No security features provided
- Utilities: Public water; Public sewer; Natural gas
- Home design: Triplex; Two stories; Stone foundation; Shingle roof; Zoned residential — multi-family
- Construction: Vinyl siding; Built with stone foundation
- Exterior features: Porch; Vinyl and double-hung windows
Interior
- Kitchen: No kitchen appliance details provided
- Bedrooms: Three 3+ bedroom units (each unit: 2 bedrooms)
- Flooring: No flooring details provided
- Bathrooms: Each unit has 1 full bathroom
- Heating & cooling: Gas heating with hot water; Window A/C units; Heat paid by tenants
- Interior features: Full basement; Porch
- Laundry & utility: Separate utilities for each unit (separate furnace, separate A/C, separate gas/electric)
Neighborhood map
What this means for you Summary
Snapshot
- This is a 5-bed/3.0-bath multifamily listed at $210k.
Deal economics
- At list price, monthly cash flow is $983 ($12k/yr) — positive.
- The deal already cash-flows at list — no discount required.
- Meets the 1% rule at list price ($3k rent vs $210k).
- Recommended offer: $204k (3.0% below list) — sets the bar for market timing.
Location & tenants
- Location reads 68/100 on livability (#556 in OH) — a middle-class / working-renter tenant base. Strengths: cost of living A+, housing A+, commute A-; Watch: health & safety C-, crime D+, employment D+.
- Three Rivers Local (rural): math 58% / reading 61% proficiency, ranked #256 of 656 in OH (top 39%) — acceptable for families but not a draw, mixed tenant base, ~2y average lease.
- Zoned schools: Three Rivers Elementary (math 65% / reading 52%, grade B-, #708 of 1,584 statewide, top 45%, 793 students, 35% FRL); Taylor Middle School (math 54% / reading 65%, grade B, #271 of 654 statewide, top 43%, 665 students, 40% FRL); Taylor High School (math 24% / reading 67%, grade D-, #463 of 781 statewide, top 59%, 644 students, 32% FRL) — zoned schools at 36% FRL track the district average.
- Market conditions: 5 active listings in the ZIP; lower-income renter base — watch delinquency; 801 units permitted in Hamilton County in 2024 (190 in 5+ unit buildings).
- At $2,900/mo this rent would consume 78% of the median local household income ($45k/yr) — very limited rent-growth headroom before tenants either downsize or default.
Forward outlook
- In year one you build about $22k of equity ($1k loan paydown + $21k appreciation (10.0% local appreciation)).
- At projected returns (10.0% appreciation + 3.0% rent growth), your $59k cash investment doubles in ~2 years — after that, you're playing with house money.
- By year 2, paydown + projected appreciation supports a ~$36k cash-out refi (75% LTV) — recoverable capital for the next deal without selling this one.
Negotiation context
- It's been on market 51 days — a 3% lower offer ($204k) is reasonable based on typical stale-listing flexibility.
- 2 sale attempts since 10y ago with the ask held roughly flat each time — persistent listings suggest the price (not the market) is what's stuck; bring a comps-based counter.
- Current owner paid $53k; list at $210k implies a 296% gain — meaningful room to come down on a strong offer.
Risks & watch-outs
- Watch-outs: built in 1880 — expect roof / HVAC / electrical / plumbing capex.
Questions for the listing agent
- It's been on market 51 days. Have you received any prior offers? Is the seller open to a 3% concession, seller financing, or rate buy-down credit?
- Built in 1880 — when were the roof, HVAC, electrical panel, plumbing, and water heater last replaced?
- Is there a deadline driving the sale (1031 exchange, divorce, estate, relocation)? That informs how much negotiation room exists.
- Schools are F-rated, which usually means shorter tenancies and higher turnover. Who's the typical renter profile here, and what's been the actual vacancy rate?
- Crime grade is D in this area — have there been break-ins, vandalism, or insurance claims at this property in the last 3 years? What carrier currently insures it and at what premium?
- What's the average days-on-market for RENTAL listings here right now (not sales)? A rising rental-DOM trend means longer vacancies and softer asking-rent achievability than the comps imply.
- What's the recent tenant-quality profile in this submarket — average credit score on applications, eviction rate, late-payment / NSF rate, and stable-employment percentage? A property-management company in the area should have these aggregated.
- How much new apartment / multifamily construction is in the pipeline within 1–3 miles? Heavy new supply (>2% of stock underway) typically softens rents 12–24 months out; light construction supports rent growth.
Investment metrics
- 1% rule
- 1.38% ✓
- Cap rate
- 11.91%
- Cash-on-cash
- 20.06%
- DSCR
- 1.89
- GRM
- 6.0
CMA / ARV
- ARV (median comp)
- $133,872
- List price
- $210,000
- Delta
- 56.87%
- Verdict
- OVERPRICED
- Comps
- 1 within 2.0 mi
Projected returns pro-forma
10.0% appreciation · 3.0% rent growth · sell at horizon
- IRR
- 39.2%
- Equity multiple
- 4.01×
- Total profit
- $176,936
- Equity at exit
- $189,185
- IRR
- 33.8%
- Equity multiple
- 9.02×
- Total profit
- $471,723
- Equity at exit
- $407,984
Cash invested: $58,800 (down + closing). Projections, not guarantees.
Landlord ↔ Tenant lean methodology
- Overall (STATE)
- 73 Landlord-Friendly
- State Ohio
- 73 Landlord-Friendly · R+6
- County
- — inherits STATE
- City
- — inherits STATE
ZIP-level market 45001
- Home prices YoY
- 8.4%
- Active inventory
- 5
- Price-to-rent
- 12.1×
Monthly cashflow live
- Estimated rent
- $2,900 medium interval (Pro) →
- Mortgage (P&I)
- −$1,101
- Tax from tax record
- −$119 /mo · $1,431/yr
- Insurance
- −$88
- HOA
- −$0
- Vacancy / Maint / Mgmt
- −$609
- Net cashflow
- $983
Break-even live
Sensitivity live
| Price | -10% $1,102 | -5% $1,042 | +0% $983 | +5% $924 | +10% $864 |
|---|---|---|---|---|---|
| Rent | -10% $754 | -5% $868 | +0% $983 | +5% $1,098 | +10% $1,212 |
| Rate | -1.0pp $1,089 | -0.5pp $1,036 | base $983 | +0.5pp $929 | +1.0pp $873 |
2-unit breakdown (identical units grouped — click to expand)
| Units | Beds | Baths | Est. rent |
|---|---|---|---|
| 2× units | 2 | 1 | $2,900 |
| #1 | 2 | 1 | $1,450 |
| #2 | 2 | 1 | $1,450 |
| Total (2 units) | $2,900 | ||
UW: 25.0% down · 7.5% · 30yr · 1.5% tax · 5.0% vac · 8.0% maint · 8.0% mgmt
Financing live
Cash to close
- Down payment
- $52,500
- Closing costs
- $6,300
- Reserves months
- —
- Total cash needed
- —
Loan-product check · same deal, 3 products live
Conventional
25% down · 7.5% · 30yr
- Down + closing
- —
- Monthly P&I
- —
- Monthly cashflow
- —
- DSCR
- —
- Eligible?
- —
Personal DTI + credit; lowest rate.
DSCR
20% down · 8.5% · 30yr
- Down + closing
- —
- Monthly P&I
- —
- Monthly cashflow
- —
- DSCR
- —
- Eligible?
- —
No personal income docs; deal must DSCR.
Hard money
10% down · 12.0% · 12mo
- Down + closing
- —
- Monthly P&I
- —
- Monthly cashflow
- —
- DSCR
- —
- Eligible?
- —
Short-term bridge; refi at stabilization.
Listing history 20 events
-
2026-06-21days on market $210,000 Active 51 DOM
-
2026-06-21days on market $210,000 Active 50 DOM
-
2026-06-18days on market $210,000 Active 48 DOM
-
2026-06-17days on market $210,000 Active 47 DOM
-
2026-06-16days on market $210,000 Active 46 DOM
-
2026-06-15days on market $210,000 Active 45 DOM
-
2026-06-13days on market $210,000 Active 43 DOM
-
2026-06-12days on market $210,000 Active 42 DOM
-
2026-06-09days on market $210,000 Active 39 DOM
-
2026-06-08days on market $210,000 Active 38 DOM
-
2026-06-08days on market $210,000 Active 37 DOM
-
2026-06-04days on market $210,000 Active 33 DOM
-
2026-06-02days on market $210,000 Active 32 DOM
-
2026-06-01days on market $210,000 Active 31 DOM
-
2026-05-31days on market $210,000 Active 30 DOM
-
2026-05-01$210,000 Active 326-char remark
-
2016-08-17soldstatus $53,000
-
2016-08-09soldstatus $53,000 Sold 102-char remark
Show marketing remark (102 chars)
Great investment opportunity in Addyston! All units are occupied. Priced to sell. 3 units in building.
-
2016-06-09historical Accept Backup Offers 102-char remark
Show marketing remark (102 chars)
Great investment opportunity in Addyston! All units are occupied. Priced to sell. 3 units in building.
-
2016-05-03$65,000 Active 102-char remark
Show marketing remark (102 chars)
Great investment opportunity in Addyston! All units are occupied. Priced to sell. 3 units in building.
ⓘ Source: listings_history table (triggers on properties + properties_extension) + one-shot
backfill from property_details.listing_events for pre-trigger history.
Tax reassessment forecast OH · Partial reset (capped growth)
- Current annual tax
- $1,431 · $119/mo
- Projected year-2 tax
- $2,353 · $196/mo
- Expected delta
- +$923/yr (+$77/mo · 64.5%)
ⓘ Screening estimate from a state-policy table — verify with the county assessor before closing.
Climate risk First Street
- Flood 1/10 Low FEMA zone X (unshaded) · 0% chance over 30 yrs
- Wildfire 1/10 Low
- Heat 4/10 Moderate 7 d/yr ≥102°F today · 19 d/yr by 30 yrs out
- Wind 2/10 Low 100% chance of damaging wind over 30 yrs
- Air quality 2/10 Low 1 unhealthy d/yr today · 2 by 30 yrs out
Nearby sold comps map
Loading sold comps map…
Walkable amenities ~0.75 mi
Loading nearby amenities…
Taxation est. · year 1
- Rental income
- $34,800
- − Mortgage interest
- −$11,763
- − Property taxes
- −$1,431
- − Insurance
- −$1,050
- − Repairs & maintenance
- −$2,784
- − Management
- −$2,784
- − Depreciation
- −$6,109
- Taxable income
- $8,879
- Est. tax owed @ 24.0%
- −$2,131
- After-tax cash flow
- $9,665/yr
For passive investors: Depreciation is non-cash, so a rental often shows a tax loss while cash-flowing — sheltering income. Rental losses are passive: they offset passive income freely, and up to $25,000/yr can offset ordinary (W-2) income if you actively participate and your MAGI is under $100k (phasing out to $0 by $150k); unused losses carry forward. On sale, claimed depreciation is recaptured at up to 25%, and gains may owe capital-gains tax (a 1031 exchange can defer both). Figures are a year-1 estimate at your 24.0% rate — not tax advice; consult a CPA.
Schools (NCES district)
- District
- Three Rivers Local
- NCES district ID
- 3904739
- Math proficiency
- 58% ▼ -9.00%
- Reading proficiency
- 61% ▼ -10.00%
- Median HH income
- $72,973
- Composite
- 52.85/100
- National rank
- #1533
- State rank
- #256 of 656 in OH
Livability — Addyston
- Score
- 68/100
- State rank
- #556
- US rank
- #9484
Category grades
Schools grade is shown separately in the Schools card above.
Census & demographics
- Census place
- Addyston, OH
- County
- Hamilton · 838,887 people
- City population
- 863
- Metro
- Cincinnati, OH-KY-IN
- Population (ZIP)
- 863
- Household income
- $44,861
- Rent vs Own
- Severe rent burden
- 9.5
Population outlook (Hamilton County) Hauer SSP2
- Today (2025)
- 826,054 people
- By 2030
- 830,947 · +0.6%
- By 2040
- 832,319 · +0.8%
- By 2050
- 822,428 · -0.4%
- By 2075
- 788,688 · -4.5%
- By 2100
- 710,674 · -14.0%
Race, ethnicity, and origin ACS 2023
- Neighborhood character
- Predominantly White (75%)
- Race & ethnicity
- White 75% Black 17% Two or more races 8%
- Common ancestry
- Iranian 2%
- Foreign-born
- 0%
Political lean MEDSL · Hamilton
- 2024 margin
- D (+14.9) · D 57.0% · R 42.1%
- 2008→2024 swing
- +7.9pp toward D · 2008: 7.0pp · 2024: 14.9pp
- All cycles
- 2024: D+14.9 2020: D+15.9 2016: D+9.5 2012: D+4.9 2008: D+7.0
Not yet ingested
- Civics
- —
Market trends
- HPI YoY
- ▲ 23.26%
- Current HPI
- 299.8042
- Rent YoY
- —
- Metro
- —
- State GDP YoY
- ▲ 1.98%
- F500 in state
- 48
Industry mix (Fortune 500 HQ in OH)
| Industry | F500 HQs | Revenue |
|---|---|---|
| Insurance | 3 | $145B |
|
||
| Industrial Machinery | 3 | $49B |
|
||
| Financial Services | 3 | $24B |
|
||
| Consumer Goods | 2 | $93B |
|
||
| Aerospace / Defense | 2 | $47B |
|
||
| Utilities | 2 | $33B |
|
||
Price history
+223.1% since first listed5 events — show timeline
- 2026-05-01 Listed $210,000 Cincy MLS
- 2016-08-17 Sold (Public Records) $53,000 Public Records
- 2016-08-09 Sold (MLS) $53,000 Cincy MLS
- 2016-06-09 Contingent — Cincy MLS
- 2016-05-03 Listed $65,000 Cincy MLS
Property tax history
+7.9%/yrLatest (2025): $1,431 · +11.0% YoY. Source: county tax records.
Cash-flow waterfall
monthlySold comps — $/sqft
last 12 mo · ≤1 miLoading sold comps…