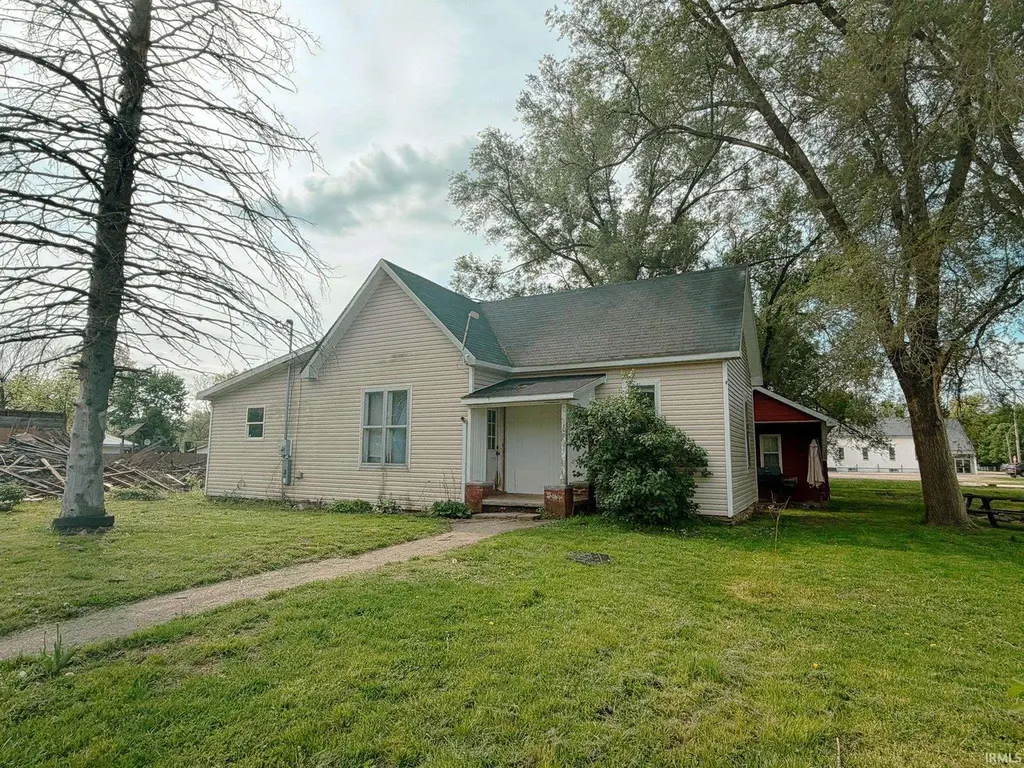
106 E Union St · West Union, IL
Flood risk 1/10 · Minimal
- FEMA flood zone
- X (unshaded)
- Chance of flooding over 30 yrs
- 0.0%
- Est. flood insurance / yr
- $507 – $1,088
Fire risk 1/10 · Minimal
- Est. fire insurance / yr
- $804 – $1,492
Heat risk 4/10 · Minor
- Hot days now (above 106°F)
- 7 days/yr
- Hot days in 30 yrs
- 19 days/yr
Wind risk 2/10 · Minimal
- Chance of severe wind over 30 yrs
- 1.0%
Air-quality risk 2/10 · Minimal
- Unhealthy air days now
- 1 days/yr
- Unhealthy air days in 30 yrs
- 2 days/yr
Risk factors via First Street. Map © Google.
Why this score? — see what drove the B grade
The composite is a weighted blend of 9 inputs, each scored 0–100. Each bar is that input's sub-score; the figure is the points it added to the 100-point composite (weight × sub-score).
- Cash flow +30.0/30.0
- 1% rule +10.0/10.0
- DSCR +10.0/10.0
- ARV discount +7.5/15.0
- Appreciation +5.0/10.0
- Livability +3.1/5.0
- Schools +2.9/10.0
- Rent growth +2.5/5.0
- Condition / age +2.5/5.0
$39,900
🖨 Deal sheet (PDF) 📄 Offer letter ✓ Due diligence
Listing remarks MLS
Welcome home! This fixer-upper has TONS of potential and could be your dream home at an affordable price! Pulling up to the home, buyers are instantly greeted by the home's charm and curb appeal. A covered front porch perfectly highlights the front exterior! Features of the property include: 3 bedrooms, 1.5 bathroom, dining room, kitchen with plenty of cabinetry and counter space, airy living room with plenty of natural light, and SO MUCH MORE! Homes in this price point don't hit the market often! * Home is being sold in as-is condition *
Key facts
- 8,712 sq ft lot
- Built 1890
- Listed 125 days
Neighborhood map
What this means for you Summary
Snapshot
- This is a 3-bed/1.5-bath single-family listed at $40k.
Deal economics
- At list price, monthly cash flow is $860 ($10k/yr) — positive.
- The deal already cash-flows at list — no discount required.
- Meets the 1% rule at list price ($1k rent vs $40k).
- Recommended offer: $35k (12.0% below list) — sets the bar for market timing.
Location & tenants
- Location reads 62/100 on livability (#850 in IL) — a middle-class / working-renter tenant base. Strengths: cost of living A+, housing A+; Watch: crime F, amenities F, commute F.
- Hutsonville CUSD 1 (rural): math 15% / reading 45% proficiency, ranked #491 of 919 in IL (top 53%) — families likely to look elsewhere, expect single-tenant / working-renter base with shorter leases.
- Zoned schools: Hutsonville Elem And Jr High Sch (math 27% / reading 32%, grade F, #658 of 2,056 statewide, top 35%, 203 students, 0% FRL); Hutsonville High School (math 30% / reading 30%, grade F, #179 of 693 statewide, top 27%, 95 students, 0% FRL) — zoned schools average 0% FRL vs 41% district-wide (41 pts lower); this property's tenant base skews higher-income than the district average.
- Market conditions: 2 active listings in the ZIP; 1 units permitted in Clark County in 2024 (0 in 5+ unit buildings).
Forward outlook
- In year one you build about $1k of equity ($276 loan paydown + $1k appreciation (3.0% local appreciation)).
- Clark County population projected at -20% by 2050 — secular population decline; favor cash flow + early exit over multi-decade hold.
- At projected returns (3.0% appreciation + 3.0% rent growth), your $11k cash investment doubles in ~1 year — after that, you're playing with house money.
Negotiation context
- It's been on market 126 days — a 12% lower offer ($35k) is reasonable based on typical stale-listing flexibility.
- 2 sale attempts; this cycle's ask has dropped $15k (27%) from the opening price — seller is motivated, your offer sets the floor, not the list.
- Current owner paid $15k; list at $40k implies a 166% gain — meaningful room to come down on a strong offer.
Risks & watch-outs
- Watch-outs: built in 1890 — expect roof / HVAC / electrical / plumbing capex.
Questions for the listing agent
- It's been on market 126 days. Have you received any prior offers? Is the seller open to a 12% concession, seller financing, or rate buy-down credit?
- Built in 1890 — when were the roof, HVAC, electrical panel, plumbing, and water heater last replaced?
- Why hasn't it sold? Are there any deal-killer items the seller is aware of (foundation, flood, title, zoning, code violations)?
- Is there a deadline driving the sale (1031 exchange, divorce, estate, relocation)? That informs how much negotiation room exists.
- Crime grade is F in this area — have there been break-ins, vandalism, or insurance claims at this property in the last 3 years? What carrier currently insures it and at what premium?
- What's the average days-on-market for RENTAL listings here right now (not sales)? A rising rental-DOM trend means longer vacancies and softer asking-rent achievability than the comps imply.
- What's the recent tenant-quality profile in this submarket — average credit score on applications, eviction rate, late-payment / NSF rate, and stable-employment percentage? A property-management company in the area should have these aggregated.
- How much new for-sale + rental construction is in the pipeline within 1–3 miles? Heavy new supply typically softens prices + rents 12–24 months out; constrained supply supports both.
Investment metrics
- 1% rule
- 3.57% ✓
- Cap rate
- 32.16%
- Cash-on-cash
- 92.38%
- DSCR
- 5.11
- GRM
- 2.3
CMA / ARV
- ARV (median comp)
- $134,380
- List price
- $39,900
- Delta
- -70.31%
- Verdict
- UNDERPRICED
- Comps
- 2 within 2.0 mi
Projected returns pro-forma
3.0% appreciation · 3.0% rent growth · sell at horizon
- IRR
- 96.6%
- Equity multiple
- 6.33×
- Total profit
- $59,601
- Equity at exit
- $17,941
- IRR
- 96.2%
- Equity multiple
- 13.12×
- Total profit
- $135,431
- Equity at exit
- $27,649
Cash invested: $11,172 (down + closing). Projections, not guarantees.
Landlord ↔ Tenant lean methodology
- Overall (STATE)
- 43 Moderately Tenant-Leaning
- State Illinois
- 43 Moderately Tenant-Leaning · D+7
- County
- — inherits STATE
- City
- — inherits STATE
ZIP-level market 62477
- Active inventory
- 2
- Price-to-rent
- 2.3×
Monthly cashflow live
- Estimated rent
- $1,425 medium interval (Pro) →
- Mortgage (P&I)
- −$209
- Tax from tax record
- −$40 /mo · $482/yr
- Insurance
- −$17
- HOA
- −$0
- Vacancy / Maint / Mgmt
- −$299
- Net cashflow
- $860
Break-even live
Sensitivity live
| Price | -10% $883 | -5% $871 | +0% $860 | +5% $849 | +10% $837 |
|---|---|---|---|---|---|
| Rent | -10% $747 | -5% $804 | +0% $860 | +5% $916 | +10% $973 |
| Rate | -1.0pp $880 | -0.5pp $870 | base $860 | +0.5pp $850 | +1.0pp $839 |
UW: 25.0% down · 7.5% · 30yr · 1.5% tax · 5.0% vac · 8.0% maint · 8.0% mgmt
Financing live
Cash to close
- Down payment
- $9,975
- Closing costs
- $1,197
- Reserves months
- —
- Total cash needed
- —
Loan-product check · same deal, 3 products live
Conventional
25% down · 7.5% · 30yr
- Down + closing
- —
- Monthly P&I
- —
- Monthly cashflow
- —
- DSCR
- —
- Eligible?
- —
Personal DTI + credit; lowest rate.
DSCR
20% down · 8.5% · 30yr
- Down + closing
- —
- Monthly P&I
- —
- Monthly cashflow
- —
- DSCR
- —
- Eligible?
- —
No personal income docs; deal must DSCR.
Hard money
10% down · 12.0% · 12mo
- Down + closing
- —
- Monthly P&I
- —
- Monthly cashflow
- —
- DSCR
- —
- Eligible?
- —
Short-term bridge; refi at stabilization.
Listing history 20 events
-
2026-06-16days on market $39,900 Active 126 DOM
-
2026-06-15days on market $39,900 Active 125 DOM
-
2026-06-13days on market $39,900 Active 123 DOM
-
2026-06-12days on market $39,900 Active 122 DOM
-
2026-06-09days on market $39,900 Active 119 DOM
-
2026-06-08days on market $39,900 Active 118 DOM
-
2026-06-07days on market $39,900 Active 117 DOM
-
2026-06-07days on market $39,900 Active 116 DOM
-
2026-06-04days on market $39,900 Active 113 DOM
-
2026-06-02days on market $39,900 Active 112 DOM
-
2026-06-01days on market $39,900 Active 111 DOM
-
2026-05-31days on market $39,900 Active 110 DOM
-
2026-05-31days on market $39,900 Active 109 DOM
-
2026-04-19price $39,900 550-char remark
Show marketing remark (550 chars)
Welcome home! This fixer-upper has TONS of potential and could be your dream home at an affordable price! Pulling up to the home, buyers are instantly greeted by the home's charm and curb appeal. A covered front porch perfectly highlights the front exterior! Features of the property include: 3 bedrooms, 1.5 bathroom, dining room, kitchen with plenty of cabinetry and counter space, airy living room with plenty of natural light, and SO MUCH MORE! Homes in this price point don't hit the market often! * Home is being sold in as-is condition *
-
2026-03-27price $48,000 550-char remark
Show marketing remark (550 chars)
Welcome home! This fixer-upper has TONS of potential and could be your dream home at an affordable price! Pulling up to the home, buyers are instantly greeted by the home's charm and curb appeal. A covered front porch perfectly highlights the front exterior! Features of the property include: 3 bedrooms, 1.5 bathroom, dining room, kitchen with plenty of cabinetry and counter space, airy living room with plenty of natural light, and SO MUCH MORE! Homes in this price point don't hit the market often! * Home is being sold in as-is condition *
-
2026-03-01status Active 550-char remark
Show marketing remark (550 chars)
Welcome home! This fixer-upper has TONS of potential and could be your dream home at an affordable price! Pulling up to the home, buyers are instantly greeted by the home's charm and curb appeal. A covered front porch perfectly highlights the front exterior! Features of the property include: 3 bedrooms, 1.5 bathroom, dining room, kitchen with plenty of cabinetry and counter space, airy living room with plenty of natural light, and SO MUCH MORE! Homes in this price point don't hit the market often! * Home is being sold in as-is condition *
-
2026-03-01price $50,000 550-char remark
Show marketing remark (550 chars)
Welcome home! This fixer-upper has TONS of potential and could be your dream home at an affordable price! Pulling up to the home, buyers are instantly greeted by the home's charm and curb appeal. A covered front porch perfectly highlights the front exterior! Features of the property include: 3 bedrooms, 1.5 bathroom, dining room, kitchen with plenty of cabinetry and counter space, airy living room with plenty of natural light, and SO MUCH MORE! Homes in this price point don't hit the market often! * Home is being sold in as-is condition *
-
2026-02-22status Pending 550-char remark
Show marketing remark (550 chars)
Welcome home! This fixer-upper has TONS of potential and could be your dream home at an affordable price! Pulling up to the home, buyers are instantly greeted by the home's charm and curb appeal. A covered front porch perfectly highlights the front exterior! Features of the property include: 3 bedrooms, 1.5 bathroom, dining room, kitchen with plenty of cabinetry and counter space, airy living room with plenty of natural light, and SO MUCH MORE! Homes in this price point don't hit the market often! * Home is being sold in as-is condition *
-
2026-02-03$55,000 Active 550-char remark
Show marketing remark (550 chars)
Welcome home! This fixer-upper has TONS of potential and could be your dream home at an affordable price! Pulling up to the home, buyers are instantly greeted by the home's charm and curb appeal. A covered front porch perfectly highlights the front exterior! Features of the property include: 3 bedrooms, 1.5 bathroom, dining room, kitchen with plenty of cabinetry and counter space, airy living room with plenty of natural light, and SO MUCH MORE! Homes in this price point don't hit the market often! * Home is being sold in as-is condition *
-
1999-12-01soldstatus $15,000
ⓘ Source: listings_history table (triggers on properties + properties_extension) + one-shot
backfill from property_details.listing_events for pre-trigger history.
Tax reassessment forecast IL · Partial reset (capped growth)
- Current annual tax
- $482 · $40/mo
- Projected year-2 tax
- $694 · $58/mo
- Expected delta
- +$212/yr (+$18/mo · 44.0%)
ⓘ Screening estimate from a state-policy table — verify with the county assessor before closing.
Climate risk First Street
- Flood 1/10 Low FEMA zone X (unshaded) · 0% chance over 30 yrs
- Wildfire 1/10 Low
- Heat 4/10 Moderate 7 d/yr ≥106°F today · 19 d/yr by 30 yrs out
- Wind 2/10 Low 100% chance of damaging wind over 30 yrs
- Air quality 2/10 Low 1 unhealthy d/yr today · 2 by 30 yrs out
Nearby sold comps map
Loading sold comps map…
Walkable amenities ~0.75 mi
Loading nearby amenities…
Taxation est. · year 1
- Rental income
- $17,105
- − Mortgage interest
- −$2,235
- − Property taxes
- −$482
- − Insurance
- −$200
- − Repairs & maintenance
- −$1,368
- − Management
- −$1,368
- − Depreciation
- −$1,161
- Taxable income
- $10,291
- Est. tax owed @ 24.0%
- −$2,470
- After-tax cash flow
- $7,851/yr
For passive investors: Depreciation is non-cash, so a rental often shows a tax loss while cash-flowing — sheltering income. Rental losses are passive: they offset passive income freely, and up to $25,000/yr can offset ordinary (W-2) income if you actively participate and your MAGI is under $100k (phasing out to $0 by $150k); unused losses carry forward. On sale, claimed depreciation is recaptured at up to 25%, and gains may owe capital-gains tax (a 1031 exchange can defer both). Figures are a year-1 estimate at your 24.0% rate — not tax advice; consult a CPA.
Schools (NCES district)
- District
- Hutsonville CUSD 1
- NCES district ID
- 1719920
- Math proficiency
- 15% ▼ -5.00%
- Reading proficiency
- 45% ▲ 20.00%
- Median HH income
- $48,628
- Composite
- 28.85/100
- National rank
- #11961
- State rank
- #491 of 919 in IL
Livability — West Union
- Score
- 62/100
- State rank
- #850
- US rank
- #16684
Category grades
Schools grade is shown separately in the Schools card above.
Census & demographics
- Census place
- West Union, IL
- Population (ZIP)
- 755
Population outlook (Clark County) Hauer SSP2
- Today (2025)
- 14,978 people
- By 2030
- 14,380 · -4.0%
- By 2040
- 13,135 · -12.3%
- By 2050
- 11,920 · -20.4%
- By 2075
- 9,254 · -38.2%
- By 2100
- 6,737 · -55.0%
Race, ethnicity, and origin ACS 2023
- Neighborhood character
- Predominantly White (98%)
- Race & ethnicity
- White 98% Black 2%
- Common ancestry
- Slovak 7% Romanian 5% Lithuanian 3%
- Foreign-born
- 1%
- Languages at home
- 99% English-only · German/W. Germanic 1%
Political lean MEDSL · Clark
- 2024 margin
- Solid R (+51.2) · D 23.5% · R 74.7% · Other 1.8%
- 2008→2024 swing
- -43.2pp toward R · 2008: -8.1pp · 2024: -51.2pp
- All cycles
- 2024: R+51.2 2020: R+50.7 2016: R+47.9 2012: R+32.5 2008: R+8.1
Not yet ingested
- Civics
- —
Market trends
- HPI YoY
- —
- Current HPI
- —
- Rent YoY
- —
- Metro
- —
- State GDP YoY
- ▲ 1.59%
- F500 in state
- 60
Industry mix (Fortune 500 HQ in IL)
| Industry | F500 HQs | Revenue |
|---|---|---|
| Insurance | 4 | $201B |
|
||
| Consumer Goods | 4 | $87B |
|
||
| Industrial Machinery | 3 | $64B |
|
||
| Healthcare | 2 | $55B |
|
||
| Retail / Pharmacy | 1 | $148B |
|
||
| Agriculture / Food | 1 | $86B |
|
||
Price history
+166.0% since first listed7 events — show timeline
- 2026-04-19 Price Changed $39,900 IRMLS
- 2026-03-27 Price Changed $48,000 IRMLS
- 2026-03-01 Relisted — IRMLS
- 2026-03-01 Price Changed $50,000 IRMLS
- 2026-02-22 Pending — IRMLS
- 2026-02-03 Listed $55,000 IRMLS
- 1999-12-01 Sold (Public Records) $15,000 Public Records
Property tax history
+1.8%/yrLatest (2024): $482 · +5.5% YoY. Source: county tax records.
Cash-flow waterfall
monthlySold comps — $/sqft
last 12 mo · ≤1 miLoading sold comps…