 🔨 Auction
7620 S Fox Ln · Pierpont, MO
Flood risk 1/10 · Minimal
- FEMA flood zone
- X (unshaded)
- Chance of flooding over 30 yrs
- 0.0%
- Est. flood insurance / yr
- $507 – $1,088
Fire risk 3/10 · Minor
- Est. fire insurance / yr
- $1,054 – $1,958
Heat risk 3/10 · Minor
- Hot days now (above 107°F)
- 7 days/yr
- Hot days in 30 yrs
- 18 days/yr
Wind risk 2/10 · Minimal
- Chance of severe wind over 30 yrs
- —
Air-quality risk 2/10 · Minimal
- Unhealthy air days now
- 0 days/yr
- Unhealthy air days in 30 yrs
- 1 days/yr
Risk factors via First Street. Map © Google.
Why this score? — see what drove the F grade
The composite is a weighted blend of 9 inputs, each scored 0–100. Each bar is that input's sub-score; the figure is the points it added to the 100-point composite (weight × sub-score).
- ARV discount +7.5/15.0
- Rent growth +5.0/5.0
- Livability +3.2/5.0
- Schools +3.1/10.0
- Condition / age +2.5/5.0
- Cash flow +0.7/30.0
- 1% rule +0.0/10.0
- DSCR +0.0/10.0
- Appreciation +0.0/10.0
$115,000
🖨 Deal sheet (PDF) 📄 Offer letter ✓ Due diligence
Listing remarks
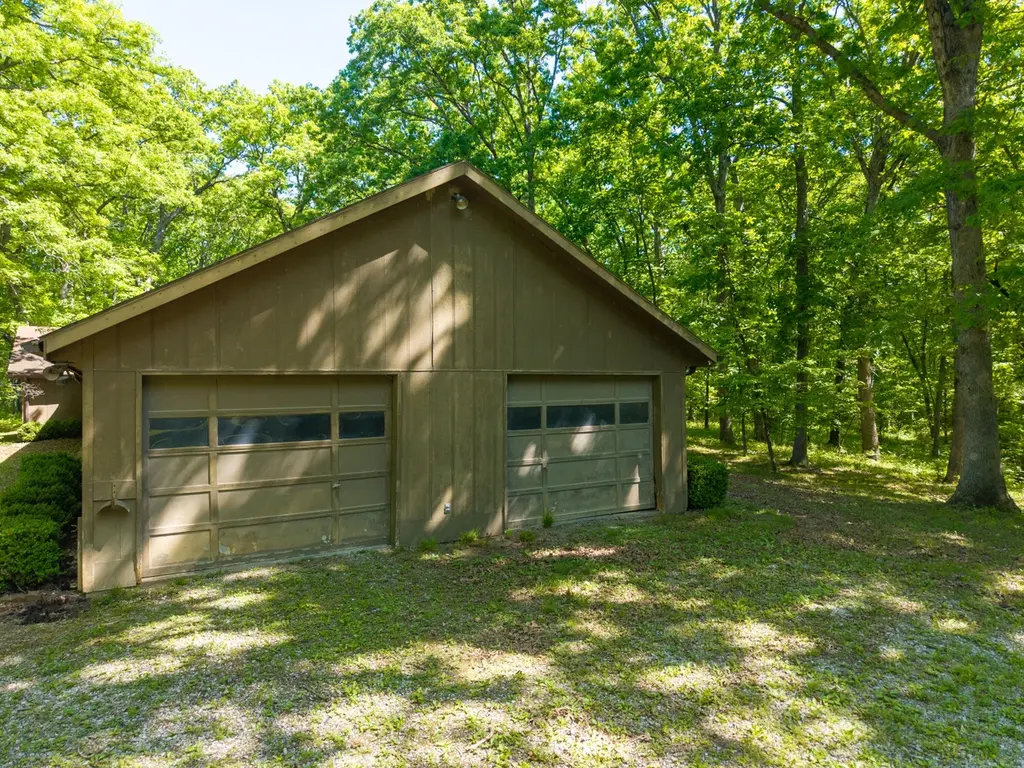
This is an online only auction. The price listed is the starting bid and does not reflect the selling price. Starting bid of $115,000. Rare South Columbia opportunity backing to Rock Bridge State Park with the Karst Trail just beyond the backyard. This 4,005± sq. ft. home offers 6 bedrooms, 3 baths, oversized living areas, formal dining, and a large upstairs bonus/game room on 2.53± private acres with mature timber and abundant wildlife. An adjoining 9.97± acre vacant tract is also offered, creating the option to buy individually or as a combination for nearly 12.50± acres. Less than 1 mile from Pierpont General Store.
Key facts
- Private acres
- Mature timber
- Abundant wildlife
Tags
Property features AI
Exterior
- Parking: Attached 2-car garage
- Utilities: Public water
- Home design: Single-family residence; Residential property
- Construction: Slab foundation
- Exterior features: 2.53-acre lot; Zoned A-2 (Agriculture - Residential)
Interior
- Flooring: Carpet
- Bathrooms: 3 full bathrooms; 1 half bathroom
- Heating & cooling: Central air conditioning; Electric heating
- Interior features: Electric fireplace; Total of 4 rooms
Neighborhood map
What this means for you Summary
Snapshot
- This is a 6-bed/3.0-bath single-family listed at $115k.
Deal economics
- At list price, monthly cash flow is $-4k ($-47k/yr) — negative.
- The deal already cash-flows at list — no discount required.
- Meets the 1% rule at list price ($2k rent vs $115k).
Location & tenants
- Location reads 64/100 on livability (#294 in MO) — a middle-class / working-renter tenant base. Strengths: housing A+, crime A; Watch: amenities F, commute F, health & safety F.
- Columbia 93 (urban): math 30% / reading 43% proficiency, ranked #194 of 324 in MO (top 60%) — families likely to look elsewhere, expect single-tenant / working-renter base with shorter leases.
- Zoned schools: Rock Bridge Elem. (math 42% / reading 52%, grade D-, #347 of 1,115 statewide, top 35%, 589 students, 33% FRL); Ann Hawkins Gentry Middle (math 40% / reading 47%, grade D, #127 of 391 statewide, top 34%, 719 students, 31% FRL); Rock Bridge Sr. High (math 39% / reading 68%, grade C-, #83 of 521 statewide, top 16%, 2,032 students, 18% FRL).
- Market conditions: Rents rising fast (+10.3%/yr); 355 active listings in the ZIP; 1,303 units permitted in Boone County in 2024 (549 in 5+ unit buildings).
- At $1,929/mo this rent would consume 48% of the median local household income ($48k/yr) (locally 4323% of renters already pay >50% of income on rent) — very limited rent-growth headroom before tenants either downsize or default.
Forward outlook
- Local home prices are declining (-3.0%/yr); year-one equity from $6k of loan paydown is wiped out by about $27k of value loss. Plan a longer hold.
- Boone County population projected at +36% by 2050 — long-run rental-demand tailwind backs the buy-and-hold thesis.
Negotiation context
- Only 14 days on market — expect competitive offers; lowballing is unlikely to land.
Risks & watch-outs
- Watch-outs: property tax is 2.6% of price.
Questions for the listing agent
- What do current leases actually rent for vs. the listed asking? Can we see a recent rent roll and the last 12 months of T-12 income?
- Built in 1979 — when were the roof, HVAC, electrical panel, plumbing, and water heater last replaced?
- Property tax is high relative to price — has the assessment been appealed recently, and will the sale trigger a re-assessment?
- Is there a deadline driving the sale (1031 exchange, divorce, estate, relocation)? That informs how much negotiation room exists.
- Schools are D-rated, which usually means shorter tenancies and higher turnover. Who's the typical renter profile here, and what's been the actual vacancy rate?
- The area grade is low — what's the realistic commute time and amenity access for the typical tenant pool here? Any planned neighborhood developments (good or bad) we should know about?
- What's the average days-on-market for RENTAL listings here right now (not sales)? A rising rental-DOM trend means longer vacancies and softer asking-rent achievability than the comps imply.
- What's the recent tenant-quality profile in this submarket — average credit score on applications, eviction rate, late-payment / NSF rate, and stable-employment percentage? A property-management company in the area should have these aggregated.
- How much new for-sale + rental construction is in the pipeline within 1–3 miles? Heavy new supply typically softens prices + rents 12–24 months out; constrained supply supports both.
Investment metrics
- 1% rule
- 0.21% ✗
- Cap rate
- 1.17%
- Cash-on-cash
- -18.29%
- DSCR
- 0.19
- GRM
- 39.4
CMA / ARV
- ARV (on-the-fly)
- $913,140
- Comps found
- 2
Show comp detail 2 sales within ~0.75 mi
| Address | Dist | Beds/Ba | Sqft | Sold | Price | $/sf | Match |
|---|---|---|---|---|---|---|---|
| 8301 S Forest Creek Dr | 0.56mi | 5/3.5 (-1) | 4,121 (+3%) | 7mo | $925,000 | $224 | 56 |
| 8365 Forest Creek Dr | 0.63mi | 6/4.5 | 4,601 (+15%) | 14mo | $1,050,000 | $228 | 28 |
Match score weights: distance 35% · size 25% · config 20% · recency 20%. Top-matched comps best support the ARV.
Projected returns pro-forma
-3.0% appreciation · 8.0% rent growth · sell at horizon
- IRR
- -50.3%
- Equity multiple
- -0.51×
- Total profit
- $-386,449
- Equity at exit
- $136,152
- IRR
- -80.3%
- Equity multiple
- -1.39×
- Total profit
- $-611,763
- Equity at exit
- $78,952
Cash invested: $255,679 (down + closing). Projections, not guarantees.
Landlord ↔ Tenant lean methodology
- Overall (STATE)
- 81 Strongly Landlord-Friendly
- State Missouri
- 81 Strongly Landlord-Friendly · R+10
- County
- — inherits STATE
- City
- — inherits STATE
ZIP-level market 65201
- Rents YoY
- 10.3%
- Active inventory
- 355
- Price-to-rent
- 5.0×
Monthly cashflow live
- Estimated rent
- $1,929 medium interval (Pro) →
- Mortgage (P&I)
- −$4,789
- Tax from tax record
- −$251 /mo · $3,013/yr
- Insurance
- −$380
- HOA
- −$0
- Vacancy / Maint / Mgmt
- −$405
- Net cashflow
- $-3,896
Break-even live
Sensitivity live
| Price | -10% $-3,379 | -5% $-3,638 | +0% $-3,896 | +5% $-4,155 | +10% $-4,413 |
|---|---|---|---|---|---|
| Rent | -10% $-4,049 | -5% $-3,972 | +0% $-3,896 | +5% $-3,820 | +10% $-3,744 |
| Rate | -1.0pp $-3,436 | -0.5pp $-3,664 | base $-3,896 | +0.5pp $-4,133 | +1.0pp $-4,374 |
UW: 25.0% down · 7.5% · 30yr · 1.5% tax · 5.0% vac · 8.0% maint · 8.0% mgmt
Financing live
Cash to close
- Down payment
- $228,285
- Closing costs
- $27,394
- Reserves months
- —
- Total cash needed
- —
Loan-product check · same deal, 3 products live
Conventional
25% down · 7.5% · 30yr
- Down + closing
- —
- Monthly P&I
- —
- Monthly cashflow
- —
- DSCR
- —
- Eligible?
- —
Personal DTI + credit; lowest rate.
DSCR
20% down · 8.5% · 30yr
- Down + closing
- —
- Monthly P&I
- —
- Monthly cashflow
- —
- DSCR
- —
- Eligible?
- —
No personal income docs; deal must DSCR.
Hard money
10% down · 12.0% · 12mo
- Down + closing
- —
- Monthly P&I
- —
- Monthly cashflow
- —
- DSCR
- —
- Eligible?
- —
Short-term bridge; refi at stabilization.
Listing history 12 events
-
2026-06-19days on market $115,000 Active 14 DOM
-
2026-06-18days on market $115,000 Active 13 DOM
-
2026-06-17days on market $115,000 Active 12 DOM
-
2026-06-16days on market $115,000 Active 11 DOM
-
2026-06-15days on market $115,000 Active 10 DOM
-
2026-06-14days on market $115,000 Active 8 DOM
-
2026-06-13days on market $115,000 Active 7 DOM
-
2026-06-10days on market $115,000 Active 5 DOM
-
2026-06-09days on market $115,000 Active 4 DOM
-
2026-06-08days on market $115,000 Active 3 DOM
-
2026-06-07remarks 627-char remark
-
2026-06-07$115,000 Active 2 DOM
ⓘ Source: listings_history table (triggers on properties + properties_extension) + one-shot
backfill from property_details.listing_events for pre-trigger history.
Tax reassessment forecast MO · Resets to sale price
- Current annual tax
- $3,013 · $251/mo
- Projected year-2 tax
- $3,013 · $251/mo
- Expected delta
- $0/yr ($0/mo · 0.0%)
ⓘ Screening estimate from a state-policy table — verify with the county assessor before closing.
Climate risk First Street
- Flood 1/10 Low FEMA zone X (unshaded) · 0% chance over 30 yrs
- Wildfire 3/10 Moderate
- Heat 3/10 Moderate 7 d/yr ≥107°F today · 18 d/yr by 30 yrs out
- Wind 2/10 Low
- Air quality 2/10 Low 0 unhealthy d/yr today · 1 by 30 yrs out
Nearby sold comps map
Loading sold comps map…
Walkable amenities ~0.75 mi
Loading nearby amenities…
Taxation est. · year 1
- Rental income
- $23,147
- − Mortgage interest
- −$51,150
- − Property taxes
- −$3,013
- − Insurance
- −$4,566
- − Repairs & maintenance
- −$1,852
- − Management
- −$1,852
- − Depreciation
- −$26,564
- Taxable loss
- −$65,849
- Est. tax savings @ 24.0%
- +$15,804
- After-tax cash flow
- $-30,952/yr
For passive investors: Depreciation is non-cash, so a rental often shows a tax loss while cash-flowing — sheltering income. Rental losses are passive: they offset passive income freely, and up to $25,000/yr can offset ordinary (W-2) income if you actively participate and your MAGI is under $100k (phasing out to $0 by $150k); unused losses carry forward. On sale, claimed depreciation is recaptured at up to 25%, and gains may owe capital-gains tax (a 1031 exchange can defer both). Figures are a year-1 estimate at your 24.0% rate — not tax advice; consult a CPA.
Schools (NCES district)
- District
- Columbia 93
- NCES district ID
- 2901000
- Math proficiency
- 30% ▼ -12.00%
- Reading proficiency
- 43% ▼ -4.00%
- Median HH income
- $46,547
- Composite
- 31.21/100
- National rank
- #6036
- State rank
- #194 of 324 in MO
Livability — Pierpont
- Score
- 64/100
- State rank
- #294
- US rank
- #13614
Category grades
Schools grade is shown separately in the Schools card above.
Census & demographics
- County
- Boone County · 158,877 people
- Metro
- Columbia, MO
- Population (ZIP)
- 50,011
- Household income
- $48,113
- Rent vs Own
- Severe rent burden
- 4323.0
Population outlook (Boone County) Hauer SSP2
- Today (2025)
- 202,891 people
- By 2030
- 217,799 · +7.3%
- By 2040
- 246,789 · +21.6%
- By 2050
- 276,116 · +36.1%
- By 2075
- 348,426 · +71.7%
- By 2100
- 400,856 · +97.6%
Race, ethnicity, and origin ACS 2023
- Neighborhood character
- Predominantly White (74%)
- Race & ethnicity
- White 74% Black 8% Two or more races 7% Asian 7% Hispanic / Latino 6%
- Hispanic origin (detail)
- Mexican 5%
- Common ancestry
- Slovak 2% Italian 2% Romanian 2%
- Foreign-born
- 9% · China, Canada, Vietnam
- Languages at home
- 88% English-only · Spanish 4% Chinese 2% Other Indo-European 2%
Political lean MEDSL · Boone
- 2024 margin
- Lean D (+9.8) · D 53.9% · R 44.1% · Other 2.1%
- 2008→2024 swing
- -2.2pp toward R · 2008: 12.0pp · 2024: 9.8pp
- All cycles
- 2024: D+9.8 2020: D+12.5 2016: D+5.9 2012: D+3.1 2008: D+12.0
Not yet ingested
- Civics
- —
Market trends
- HPI YoY
- ▼ -170.32%
- Current HPI
- 195.2059
- Rent YoY
- ▲ 10.33%
- Metro
- Columbia, MO
- State GDP YoY
- ▲ 1.84%
- F500 in state
- 20
Industry mix (Fortune 500 HQ in MO)
| Industry | F500 HQs | Revenue |
|---|---|---|
| Healthcare | 1 | $163B |
|
||
| Insurance | 1 | $21B |
|
||
| Industrial Technology | 1 | $17B |
|
||
| Retail | 1 | $16B |
|
||
| Industrial Distribution | 1 | $10B |
|
||
| Utilities | 1 | $9B |
|
||
Price history
1 event — show timeline
- 2026-06-05 Listed $115,000 CBORMLS
Property tax history
+3.1%/yrLatest (2025): $3,013 · +7.0% YoY. Source: county tax records.
Cash-flow waterfall
monthlySold comps — $/sqft
last 12 mo · ≤1 miLoading sold comps…