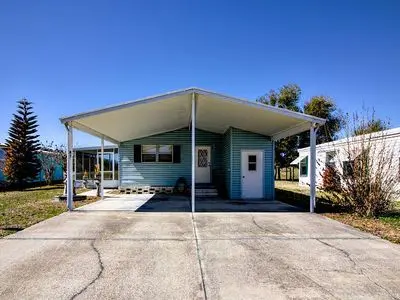
81 Fountain Dr · Leesburg, FL
Flood risk 9/10 · Severe
- FEMA flood zone
- AE
- Chance of flooding over 30 yrs
- 0.99%
- Est. flood insurance / yr
- $1,737 – $8,500
Fire risk 4/10 · Minor
- Est. fire insurance / yr
- $947 – $1,759
Heat risk 8/10 · Major
- Hot days now (above 108°F)
- 7 days/yr
- Hot days in 30 yrs
- 22 days/yr
Wind risk 9/10 · Severe
- Chance of severe wind over 30 yrs
- 99.0%
Air-quality risk 2/10 · Minimal
- Unhealthy air days now
- 1 days/yr
- Unhealthy air days in 30 yrs
- 1 days/yr
Risk factors via First Street. Map © Google.
Why this score? — see what drove the B- grade
The composite is a weighted blend of 9 inputs, each scored 0–100. Each bar is that input's sub-score; the figure is the points it added to the 100-point composite (weight × sub-score).
- Cash flow +30.0/30.0
- 1% rule +10.0/10.0
- DSCR +10.0/10.0
- ARV discount +7.5/15.0
- Schools +4.2/10.0
- Livability +3.1/5.0
- Rent growth +2.3/5.0
- Condition / age +2.2/5.0
- Appreciation +0.0/10.0
$45,900
🖨 Deal sheet 📄 Offer letter ✓ Due diligence
Listing remarks
& quot; & quot; Welcome to easy Florida living inside the sought-after Leesburg Landing Mobile Home Park & acirc; & euro; & rdquo; where neighbors become friends and retirement actually feels like retirement. This spacious 3-bedroom 2-bath 1991 OAKS double-wide offers comfort functionality and one rare feature most homes here don & acirc; & euro; & trade; t have: a covered double parking overhang. Whether you need space for two vehicles a golf cart extra storage or shaded outdoor seating this setup is hard to find in the community. Inside you & acirc; & euro; & trade; ll enjoy a practical split-bedroom layout generous living space and r
Key facts
- Split-bedroom layout
- Listed 9 days
Tags
Neighborhood map
What this means for you Summary
Snapshot
- This is a 3-bed/?-bath other listed at $46k. Condition is rated fair.
Deal economics
- At list price, monthly cash flow is $600 ($7k/yr) — positive.
- The deal already cash-flows at list — no discount required.
- Meets the 1% rule at list price ($2k rent vs $46k).
- Cap rate 33.1% vs local median 4.5% in Leesburg — top-decile yield for the area; either an underpriced asset or a hidden risk that comps aren't pricing in. Stress-test before assuming the spread holds.
Location & tenants
- Location reads 62/100 on livability (#751 in FL) — a middle-class / working-renter tenant base. Strengths: cost of living A+, housing A+; Watch: schools D+, crime D, amenities F.
- Lake (suburban): math 49% / reading 50% proficiency, ranked #37 of 73 in FL (top 51%) — families likely to look elsewhere, expect single-tenant / working-renter base with shorter leases.
- Market conditions: Rents soft (-0.9%/yr); 783 active listings in the ZIP; 15 comparable units currently listed for rent nearby; rentals at typical pace (median 24d on market — plan ~3-4 weeks tenant-placement turnaround); 4,799 units permitted in Lake County in 2024 (814 in 5+ unit buildings).
- This rent runs 35% of the median local income ($58k/yr) — at the standard rent-burdened threshold; future hikes will face affordability resistance.
Forward outlook
- Local home prices are declining (-3.0%/yr); year-one equity from $317 of loan paydown is wiped out by about $1k of value loss. Plan a longer hold.
- Lake County population projected at +37% by 2050 — long-run rental-demand tailwind backs the buy-and-hold thesis.
- At projected returns (-3.0% appreciation + 0.0% rent growth), your $13k cash investment doubles in ~3 years — after that, you're playing with house money.
Negotiation context
- Only 9 days on market — expect competitive offers; lowballing is unlikely to land.
Risks & watch-outs
- Watch-outs: flood insurance adds $427/mo.
- Climate carrying-cost: in FEMA flood zone AE (mandatory federal flood insurance); severe wind risk, 99% chance of damaging wind over 30y; extreme-heat days projected 7→22/yr by 2055 (HVAC capex compounding) — expect insurance premiums to compound above CPI over the hold.
Questions for the listing agent
- Have any recent inspections been done? Can we get a copy of the seller's disclosures and any deferred-maintenance estimates?
- What's the actual annual flood-insurance premium (NFIP or private), and is the property in a SFHA with mandatory coverage?
- Is there a deadline driving the sale (1031 exchange, divorce, estate, relocation)? That informs how much negotiation room exists.
- Schools are D-rated, which usually means shorter tenancies and higher turnover. Who's the typical renter profile here, and what's been the actual vacancy rate?
- Crime grade is D in this area — have there been break-ins, vandalism, or insurance claims at this property in the last 3 years? What carrier currently insures it and at what premium?
- What's the average days-on-market for RENTAL listings here right now (not sales)? A rising rental-DOM trend means longer vacancies and softer asking-rent achievability than the comps imply.
- What's the recent tenant-quality profile in this submarket — average credit score on applications, eviction rate, late-payment / NSF rate, and stable-employment percentage? A property-management company in the area should have these aggregated.
- How much new for-sale + rental construction is in the pipeline within 1–3 miles? Heavy new supply typically softens prices + rents 12–24 months out; constrained supply supports both.
Investment metrics
- 1% rule
- 3.71% ✓
- Cap rate
- 33.13%
- Cash-on-cash
- 95.84%
- DSCR
- 5.26
- GRM
- 2.2
CMA / ARV
No comps found within radius.
Projected returns pro-forma
-3.0% appreciation · 0.0% rent growth · sell at horizon
- IRR
- 49.5%
- Equity multiple
- 3.03×
- Total profit
- $26,074
- Equity at exit
- $6,844
- IRR
- 53.3%
- Equity multiple
- 5.19×
- Total profit
- $53,811
- Equity at exit
- $3,969
Cash invested: $12,852 (down + closing). Projections, not guarantees.
Landlord ↔ Tenant lean methodology
- Overall (STATE)
- 87 Strongly Landlord-Friendly
- State Florida
- 87 Strongly Landlord-Friendly · R+3
- County
- — inherits STATE
- City
- — inherits STATE
ZIP-level market 34748
- Home prices YoY
- -25.3%
- Rents YoY
- -0.9%
- Active inventory
- 783
- Price-to-rent
- 2.2×
Monthly cashflow live
- Estimated rent
- $1,701 high interval (Pro) →
- Mortgage (P&I)
- −$241
- Tax est. 1.5%
- −$57 /mo · $688/yr
- Insurance
- −$19
- Flood insurance flood zone
- −$427 /mo · $5,118/yr
- HOA
- −$0
- Vacancy / Maint / Mgmt
- −$357
- Net cashflow
- $600
Break-even live
UW: 25.0% down · 7.5% · 30yr · 1.5% tax · 5.0% vac · 8.0% maint · 8.0% mgmt
Financing live
Cash to close
- Down payment
- $11,475
- Closing costs
- $1,377
- Reserves months
- —
- Total cash needed
- —
Loan-product check · same deal, 3 products live
Conventional
25% down · 7.5% · 30yr
- Down + closing
- —
- Monthly P&I
- —
- Monthly cashflow
- —
- DSCR
- —
- Eligible?
- —
Personal DTI + credit; lowest rate.
DSCR
20% down · 8.5% · 30yr
- Down + closing
- —
- Monthly P&I
- —
- Monthly cashflow
- —
- DSCR
- —
- Eligible?
- —
No personal income docs; deal must DSCR.
Hard money
10% down · 12.0% · 12mo
- Down + closing
- —
- Monthly P&I
- —
- Monthly cashflow
- —
- DSCR
- —
- Eligible?
- —
Short-term bridge; refi at stabilization.
Rent comps 15 comps
| Address | Beds | Baths | Sqft | Rent | $/sqft | DOM | Units | Dist |
|---|---|---|---|---|---|---|---|---|
| 2400 Silver Pointe Cir Leesburg, FL | 1.0–2.0 | 1.0 | 837 | $1,050 | $1.25 | 23d | 1 | 0.41mi |
| 2429 Centennial Blvd Leesburg, FL | 4.0 | 2.0 | 1057 | $2,300 | $2.18 | 20d | 1 | 0.43mi |
| 2511 Sennett Dr Leesburg, FL | 2.0–4.0 | 2.0 | 1215 | $1,940 | $1.60 | 23d | 1 | 0.54mi |
| 1241 Atlantic Ave Fruitland Park, FL | 3.0 | 2.0 | 1344 | $2,100 | $1.56 | 23d | 1 | 0.87mi |
| 1223 Pamela St Leesburg, FL | 2.0 | 1.0 | 894 | $1,399 | $1.56 | 23d | 1 | 1.07mi |
| 1013 Beecher St Unit 1 Leesburg, FL | 3.0 | 1.0 | 900 | $1,250 | $1.39 | 21d | 1 | 1.08mi |
| 1 Herald Dr Leesburg, FL | 2.0 | 1.0–1.5 | 970 | $1,524 | $1.57 | 4d | 4 | 1.11mi |
| 1009 McCormack St Leesburg, FL | 2.0 | 1.0 | 1400 | $1,025 | $0.73 | 23d | 1 | 1.13mi |
| 2127 Aitkin Loop Leesburg, FL | 3.0 | 2.0 | 1667 | $1,865 | $1.12 | 23d | 1 | 1.15mi |
| 1020 Birchwood Ct Unit 2 Leesburg, FL | 2.0 | 1.0 | 1230 | $1,250 | $1.02 | 17d | 1 | 1.20mi |
| 1415 Hill St Leesburg, FL | 2.0 | 1.0 | 1000 | $1,150 | $1.15 | 23d | 1 | 1.28mi |
| 1411 Hill St Leesburg, FL | 2.0 | 1.0 | 1000 | $1,150 | $1.15 | 23d | 1 | 1.28mi |
| 307 Willard Ave Fruitland Park, FL | 3.0 | 2.0 | 1796 | $1,881 | $1.05 | 12d | 1 | 1.31mi |
| 1414 N Lake View Ave Leesburg, FL | 4.0 | 1.0–3.0 | 1700 | $1,715 | $1.01 | 2d | 3 | 1.32mi |
| 1204 Wood Duck Ln Fruitland Park, FL | 2.0 | 2.0 | 1235 | $1,475 | $1.19 | 17d | 1 | 1.35mi |
Listing history 7 events
-
2026-06-18days on market $45,900 Active 9 DOM
-
2026-06-17days on market $45,900 Active 8 DOM
-
2026-06-16days on market $45,900 Active 7 DOM
-
2026-06-15days on market $45,900 Active 6 DOM
-
2026-06-13days on market $45,900 Active 4 DOM
-
2026-06-10remarks 655-char remark
-
2026-06-10$45,900 Active 1 DOM
ⓘ Source: listings_history table (triggers on properties + properties_extension) + one-shot
backfill from property_details.listing_events for pre-trigger history.
Climate risk First Street
- Flood 9/10 Extreme FEMA zone AE · 99% chance over 30 yrs
- Wildfire 4/10 Moderate
- Heat 8/10 Severe 7 d/yr ≥108°F today · 22 d/yr by 30 yrs out
- Wind 9/10 Extreme 99% chance of damaging wind over 30 yrs
- Air quality 2/10 Low 1 unhealthy d/yr today · 1 by 30 yrs out
Nearby sold comps map
Loading sold comps map…
Walkable amenities ~0.75 mi
Loading nearby amenities…
Taxation est. · year 1
- Rental income
- $20,410
- − Mortgage interest
- −$2,571
- − Property taxes
- −$688
- − Insurance
- −$5,348
- − Repairs & maintenance
- −$1,633
- − Management
- −$1,633
- − Depreciation
- −$1,335
- Taxable income
- $7,201
- Est. tax owed @ 24.0%
- −$1,728
- After-tax cash flow
- $5,471/yr
For passive investors: Depreciation is non-cash, so a rental often shows a tax loss while cash-flowing — sheltering income. Rental losses are passive: they offset passive income freely, and up to $25,000/yr can offset ordinary (W-2) income if you actively participate and your MAGI is under $100k (phasing out to $0 by $150k); unused losses carry forward. On sale, claimed depreciation is recaptured at up to 25%, and gains may owe capital-gains tax (a 1031 exchange can defer both). Figures are a year-1 estimate at your 24.0% rate — not tax advice; consult a CPA.
Condition & rehab AI · 1 photo
This 1991 double-wide mobile home in Leesburg Landing Mobile Home Park has average exterior and interior conditions, with some minor repairs and maintenance needed. Painting the exterior and trimming the landscaping would significantly increase its resale and rental value.
Repairs flagged
- Minor Landscaping — Overgrown bushes need trimming
- Minor Driveway — Concrete driveway has minor cracks
Value-add opportunities
- Both Paint exterior — Fresh paint enhances curb appeal and value
- Both Landscaping — Well-maintained landscaping improves curb appeal and rental value
Renovation cost estimate screening
| Repair item | Severity | Est. cost |
|---|---|---|
| Landscaping · Overgrown bushes need trimming | Minor | $500–3,000 |
| Driveway · Concrete driveway has minor cracks | Minor | $500–3,000 |
| Total estimated repair cost · 2 items | $1,000–6,000 |
Value-add ROI direction
- Both Paint exterior — Fresh paint enhances curb appeal and value ↑
- Both Landscaping — Well-maintained landscaping improves curb appeal and rental value ↑
ⓘ Cost ranges are severity-bucket heuristics (US national rule-of-thumb). Get contractor quotes + a written scope before underwriting a rehab budget.
Schools (NCES district)
- District
- Lake
- NCES district ID
- 1201050
- Math proficiency
- 49% ▼ -7.00%
- Reading proficiency
- 50% ▼ -4.00%
- Median HH income
- $46,632
- Composite
- 42.05/100
- National rank
- #3327
- State rank
- #37 of 73 in FL
Livability — Leesburg
- Score
- 62/100
- State rank
- #751
- US rank
- #16429
Category grades
Schools grade is shown separately in the Schools card above.
Census & demographics
- Census place
- Leesburg, FL
- County
- Lake County · 364,602 people
- City population
- 70,232
- Metro
- Orlando-Kissimmee-Sanford, FL
- Population (ZIP)
- 48,095
- Household income
- $58,192
- Rent vs Own
- Severe rent burden
- 1745.0
Population outlook (Lake County) Hauer SSP2
- Today (2025)
- 386,640 people
- By 2030
- 417,107 · +7.9%
- By 2040
- 476,676 · +23.3%
- By 2050
- 531,296 · +37.4%
- By 2075
- 648,303 · +67.7%
- By 2100
- 698,530 · +80.7%
Race, ethnicity, and origin ACS 2023
- Neighborhood character
- Majority White (64%)
- Race & ethnicity
- White 64% Black 16% Hispanic / Latino 15% Two or more races 9% Asian 1%
- Hispanic origin (detail)
- Mexican 4% Puerto Rican 5% Cuban 3%
- Common ancestry
- Romanian 3% Lithuanian 3% Slovak 2%
- Foreign-born
- 9% · Canada, Vietnam, Jamaica
- Languages at home
- 88% English-only · Spanish 10% French/Haitian/Cajun 1%
Political lean MEDSL · Lake
- 2024 margin
- Strong R (+24.7) · D 37.3% · R 62.0%
- 2008→2024 swing
- -11.2pp toward R · 2008: -13.5pp · 2024: -24.7pp
- All cycles
- 2024: R+24.7 2020: R+20.0 2016: R+23.1 2012: R+17.1 2008: R+13.5
Not yet ingested
- Civics
- —
Market trends
- HPI YoY
- ▼ -88.97%
- Current HPI
- 262.1766
- Rent YoY
- ▼ -0.95%
- Metro
- Orlando-Kissimmee-Sanford, FL
- State GDP YoY
- ▲ 3.28%
- F500 in state
- 36
Industry mix (Fortune 500 HQ in FL)
| Industry | F500 HQs | Revenue |
|---|---|---|
| Industrial Technology | 2 | $29B |
|
||
| Insurance | 2 | $17B |
|
||
| Retail | 1 | $60B |
|
||
| Technology Distribution | 1 | $58B |
|
||
| Homebuilding | 1 | $35B |
|
||
| Technology Manufacturing | 1 | $35B |
|
||
Price history
1 event — show timeline
- 2026-06-10 Listed $45,900 FSBO.com
Cash-flow waterfall
monthlySold comps — $/sqft
last 12 mo · ≤1 miLoading sold comps…