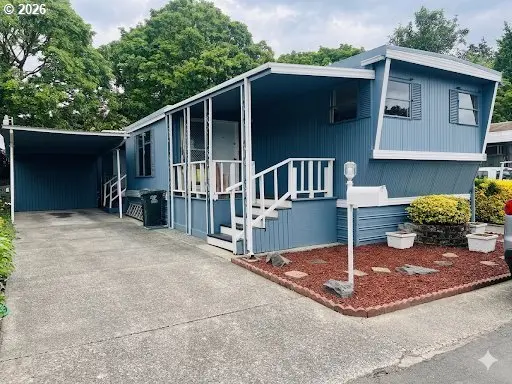
4424 SE Roethe Rd #42 · Jennings Lodge, OR
Flood risk 1/10 · Minimal
- FEMA flood zone
- X (unshaded)
- Chance of flooding over 30 yrs
- 0.0%
- Est. flood insurance / yr
- $507 – $1,088
Fire risk 1/10 · Minimal
- Est. fire insurance / yr
- $498 – $926
Heat risk 3/10 · Minor
- Hot days now (above 94°F)
- 7 days/yr
- Hot days in 30 yrs
- 16 days/yr
Wind risk 1/10 · Minimal
- Chance of severe wind over 30 yrs
- —
Air-quality risk 10/10 · Severe
- Unhealthy air days now
- 18 days/yr
- Unhealthy air days in 30 yrs
- 20 days/yr
Risk factors via First Street. Map © Google.
Why this score? — see what drove the B grade
The composite is a weighted blend of 9 inputs, each scored 0–100. Each bar is that input's sub-score; the figure is the points it added to the 100-point composite (weight × sub-score).
- Cash flow +30.0/30.0
- 1% rule +10.0/10.0
- DSCR +10.0/10.0
- ARV discount +7.5/15.0
- Livability +4.2/5.0
- Schools +3.2/10.0
- Rent growth +2.7/5.0
- Condition / age +2.5/5.0
- Appreciation +0.0/10.0
$59,900
🖨 Deal sheet (PDF) 📄 Offer letter ✓ Due diligence
Listing remarks MLS
Move-in ready single-wide home featuring 2 bedrooms and 1 bathroom. This solid, manufactured home offers fresh updates including all new flooring, trim boards, and updated interior/exterior paint. Spacious living room provides a comfortable and inviting layout. Enjoy the covered deck perfect for relaxing year-round. Located in a friendly 55 and over manufactured home park close to shopping, dining, and other amenities. Space rent is $755/month and includes water, sewer, and garbage. A great opportunity for an affordable, clean, and easy-to-care-for home in a convenient location.
Key facts
- Covered deck
- All new flooring
- Close to dining
Tags
Property features AI
Finance
- Other: Main level area approximately 684; Lot size under 3,000 sq ft; View of the city; Located at 4424 SE Roethe Rd #42, Portland, OR 97267
- HOA & community: Land lease in place (monthly lot rent); Lot rent $755 per month; Land lease expires February 5, 2027; Not a senior community
Exterior
- Parking: Carport
- Utilities: Public water; Public sewer; Electricity
- Home design: Manufactured home in a park; Residential property; Not attached; Main living area on a single level
- Construction: Built in 1967; Block foundation; Metal roof
- Exterior features: Metal siding; Level lot; Concrete road access; City view
Interior
- Kitchen: Built-in oven
- Bedrooms: Primary bedroom on the main level; Second bedroom on the main level
- Bathrooms: 1 full bathroom
- Heating & cooling: Heat pump heating; Central air conditioning; Electric hot water
- Interior features: Crawl space basement
Neighborhood map
What this means for you Summary
Snapshot
- This is a 2-bed/1.0-bath other listed at $60k.
Deal economics
- At list price, monthly cash flow is $776 ($9k/yr) — positive.
- The deal already cash-flows at list — no discount required.
- Meets the 1% rule at list price ($2k rent vs $60k).
- Recommended offer: $59k (1.5% below list) — sets the bar for market timing.
- Cap rate 21.8% vs local median 2.9% in Jennings Lodge — top-decile yield for the area; either an underpriced asset or a hidden risk that comps aren't pricing in. Stress-test before assuming the spread holds.
Location & tenants
- Location reads 84/100 on livability (#34 in OR, #808 nationally) — a professional / high-income tenant draw. Strengths: commute A+, health & safety A+, housing A-; Watch: cost of living D+.
- North Clackamas SD 12 (suburban): math 29% / reading 43% proficiency, ranked #22 of 58 in OR (top 38%) — families likely to look elsewhere, expect single-tenant / working-renter base with shorter leases.
- Zoned schools: Ardenwald Elementary School (math 24% / reading 30%, grade F, #288 of 412 statewide, top 73%, 407 students, 70% FRL); Alder Creek Middle School (math 13% / reading 36%, grade F, #108 of 128 statewide, top 89%, 846 students, 49% FRL); Putnam High School (math 34% / reading 74%, grade C-, #30 of 143 statewide, top 20%, 1,106 students, 38% FRL) — zoned schools average 52% FRL vs 34% district-wide (18 pts higher); higher-poverty schools than district average — tighter screening recommended.
- Market conditions: Rents flat; 176 active listings in the ZIP; 6 comparable units currently listed for rent nearby; rentals at typical pace (median 26d on market — plan ~3-4 weeks tenant-placement turnaround); solid renter incomes; 946 units permitted in Clackamas County in 2024 (188 in 5+ unit buildings).
Forward outlook
- Local home prices are declining (-3.0%/yr); year-one equity from $414 of loan paydown is wiped out by about $2k of value loss. Plan a longer hold.
- Clackamas County population projected at +25% by 2050 — long-run rental-demand tailwind backs the buy-and-hold thesis.
- At projected returns (-3.0% appreciation + 0.8% rent growth), your $17k cash investment doubles in ~3 years — after that, you're playing with house money.
Negotiation context
- It's been on market 15 days — a 2% lower offer ($59k) is reasonable based on typical stale-listing flexibility.
- 3 sale attempts with the ask held roughly flat each time — persistent listings suggest the price (not the market) is what's stuck; bring a comps-based counter.
Questions for the listing agent
- Built in 1967 — when were the roof, HVAC, electrical panel, plumbing, and water heater last replaced?
- Is there a deadline driving the sale (1031 exchange, divorce, estate, relocation)? That informs how much negotiation room exists.
- What's the average days-on-market for RENTAL listings here right now (not sales)? A rising rental-DOM trend means longer vacancies and softer asking-rent achievability than the comps imply.
- What's the recent tenant-quality profile in this submarket — average credit score on applications, eviction rate, late-payment / NSF rate, and stable-employment percentage? A property-management company in the area should have these aggregated.
- How much new for-sale + rental construction is in the pipeline within 1–3 miles? Heavy new supply typically softens prices + rents 12–24 months out; constrained supply supports both.
Investment metrics
- 1% rule
- 2.51% ✓
- Cap rate
- 21.84%
- Cash-on-cash
- 55.52%
- DSCR
- 3.47
- GRM
- 3.3
CMA / ARV
No comps found within radius.
Projected returns pro-forma
-3.0% appreciation · 0.81% rent growth · sell at horizon
- IRR
- 51.3%
- Equity multiple
- 3.18×
- Total profit
- $36,494
- Equity at exit
- $8,931
- IRR
- 55.8%
- Equity multiple
- 5.93×
- Total profit
- $82,758
- Equity at exit
- $5,179
Cash invested: $16,772 (down + closing). Projections, not guarantees.
Landlord ↔ Tenant lean methodology
- Overall (STATE)
- 28 Tenant-Leaning
- State Oregon
- 28 Tenant-Leaning · D+6
- County
- — inherits STATE
- City
- — inherits STATE
ZIP-level market 97267
- Rents YoY
- 0.8%
- Active inventory
- 176
- Price-to-rent
- 3.3×
Monthly cashflow live
- Estimated rent
- $1,506 high interval (Pro) →
- Mortgage (P&I)
- −$314
- Tax est. 1.5%
- −$75 /mo · $898/yr
- Insurance
- −$25
- HOA
- −$0
- Vacancy / Maint / Mgmt
- −$316
- Net cashflow
- $776
Break-even live
Sensitivity live
| Price | -10% $817 | -5% $797 | +0% $776 | +5% $755 | +10% $735 |
|---|---|---|---|---|---|
| Rent | -10% $657 | -5% $717 | +0% $776 | +5% $836 | +10% $895 |
| Rate | -1.0pp $806 | -0.5pp $791 | base $776 | +0.5pp $761 | +1.0pp $745 |
UW: 25.0% down · 7.5% · 30yr · 1.5% tax · 5.0% vac · 8.0% maint · 8.0% mgmt
Financing live
Cash to close
- Down payment
- $14,975
- Closing costs
- $1,797
- Reserves months
- —
- Total cash needed
- —
Loan-product check · same deal, 3 products live
Conventional
25% down · 7.5% · 30yr
- Down + closing
- —
- Monthly P&I
- —
- Monthly cashflow
- —
- DSCR
- —
- Eligible?
- —
Personal DTI + credit; lowest rate.
DSCR
20% down · 8.5% · 30yr
- Down + closing
- —
- Monthly P&I
- —
- Monthly cashflow
- —
- DSCR
- —
- Eligible?
- —
No personal income docs; deal must DSCR.
Hard money
10% down · 12.0% · 12mo
- Down + closing
- —
- Monthly P&I
- —
- Monthly cashflow
- —
- DSCR
- —
- Eligible?
- —
Short-term bridge; refi at stabilization.
Rent comps 6 comps
| Address | Beds | Baths | Sqft | Rent | $/sqft | DOM | Units | Dist |
|---|---|---|---|---|---|---|---|---|
| 4400 SE Naef Rd Apt B22 Milwaukie, OR | 1.0 | 1.0 | 717 | $1,385 | $1.93 | 25d | 1 | 0.30mi |
| 4400 SE Naef Rd Portland, OR | 1.0 | 1.0 | 717 | $1,350 | $1.88 | 25d | 1 | 0.31mi |
| 4400 SE Naef Rd Portland, OR | 1.0 | 1.0 | 717 | $1,375 | $1.92 | 0d | 9 | 0.31mi |
| 5200 SE Jennings Ave Portland, OR | 1.0 | 1.0 | 423 | $1,497 | $3.54 | 5d | 2 | 0.60mi |
| 4900 SE Meldrum Ave Unit B Milwaukie, OR | 1.0 | 1.0 | 750 | $1,695 | $2.26 | 45d | 1 | 0.97mi |
| 3190 Furman Dr Lake Oswego, OR | 1.0–2.0 | 1.0 | 648 | $1,554 | $2.40 | 45d | 1 | 1.38mi |
Listing history 10 events
-
2026-06-21days on market $59,900 Active 15 DOM
-
2026-06-18days on market $59,900 Active 12 DOM
-
2026-06-17days on market $59,900 Active 11 DOM
-
2026-06-16days on market $59,900 Active 10 DOM
-
2026-06-15days on market $59,900 Active 9 DOM
-
2026-06-13days on market $59,900 Active 7 DOM
-
2026-06-09days on market $59,900 Active 3 DOM
-
2026-06-08days on market $59,900 Active 2 DOM
-
2026-06-07remarks 699-char remark
-
2026-06-07$59,900 Active 1 DOM
ⓘ Source: listings_history table (triggers on properties + properties_extension) + one-shot
backfill from property_details.listing_events for pre-trigger history.
Climate risk First Street
- Flood 1/10 Low FEMA zone X (unshaded) · 0% chance over 30 yrs
- Wildfire 1/10 Low
- Heat 3/10 Moderate 7 d/yr ≥94°F today · 16 d/yr by 30 yrs out
- Wind 1/10 Low
- Air quality 10/10 Extreme 18 unhealthy d/yr today · 20 by 30 yrs out
Nearby sold comps map
Loading sold comps map…
Walkable amenities ~0.75 mi
Loading nearby amenities…
Taxation est. · year 1
- Rental income
- $18,076
- − Mortgage interest
- −$3,355
- − Property taxes
- −$898
- − Insurance
- −$300
- − Repairs & maintenance
- −$1,446
- − Management
- −$1,446
- − Depreciation
- −$1,743
- Taxable income
- $8,888
- Est. tax owed @ 24.0%
- −$2,133
- After-tax cash flow
- $7,179/yr
For passive investors: Depreciation is non-cash, so a rental often shows a tax loss while cash-flowing — sheltering income. Rental losses are passive: they offset passive income freely, and up to $25,000/yr can offset ordinary (W-2) income if you actively participate and your MAGI is under $100k (phasing out to $0 by $150k); unused losses carry forward. On sale, claimed depreciation is recaptured at up to 25%, and gains may owe capital-gains tax (a 1031 exchange can defer both). Figures are a year-1 estimate at your 24.0% rate — not tax advice; consult a CPA.
Schools (NCES district)
- District
- North Clackamas SD 12
- NCES district ID
- 4108830
- Math proficiency
- 29% ▼ -14.00%
- Reading proficiency
- 43% ▼ -13.00%
- Median HH income
- $60,217
- Composite
- 32.1/100
- National rank
- #5807
- State rank
- #22 of 58 in OR
Livability — Jennings Lodge
- Score
- 84/100
- State rank
- #34
- US rank
- #808
Category grades
Schools grade is shown separately in the Schools card above.
Census & demographics
- Census place
- Jennings Lodge, OR
- County
- Clackamas County · 361,406 people
- Metro
- Portland-Vancouver-Hillsboro, OR-WA
- Population (ZIP)
- 31,311
- Household income
- $87,418
- Rent vs Own
- Severe rent burden
- 1226.0
Population outlook (Clackamas County) Hauer SSP2
- Today (2025)
- 458,456 people
- By 2030
- 485,185 · +5.8%
- By 2040
- 532,932 · +16.2%
- By 2050
- 574,445 · +25.3%
- By 2075
- 665,497 · +45.2%
- By 2100
- 697,488 · +52.1%
Race, ethnicity, and origin ACS 2023
- Neighborhood character
- Predominantly White (78%)
- Race & ethnicity
- White 78% Hispanic / Latino 12% Two or more races 10% Asian 2% Native American 1%
- Hispanic origin (detail)
- Mexican 9%
- Common ancestry
- Portuguese 5% Lithuanian 4% Italian 3%
- Foreign-born
- 8% · Canada
- Languages at home
- 88% English-only · Spanish 7% Russian/Polish/Slavic 2% Other Indo-European 1%
Political lean MEDSL · Clackamas
- 2024 margin
- Lean D (+9.7) · D 53.4% · R 43.6% · Other 3.0%
- 2008→2024 swing
- -0.6pp no change · 2008: 10.4pp · 2024: 9.7pp
- All cycles
- 2024: D+9.7 2020: D+11.1 2016: D+6.1 2012: D+3.5 2008: D+10.4
Not yet ingested
- Civics
- —
Market trends
- HPI YoY
- ▼ -526.38%
- Current HPI
- 292.1818
- Rent YoY
- ▲ 0.81%
- Metro
- Portland-Vancouver-Hillsboro, OR-WA
- State GDP YoY
- ▲ 2.05%
- F500 in state
- 2
Industry mix (Fortune 500 HQ in OR)
| Industry | F500 HQs | Revenue |
|---|---|---|
| Consumer Goods | 1 | $51B |
|
||
Price history
-4.2% since first listed9 events — show timeline
- 2026-06-06 Listed $59,900 RMLS
- 2026-02-12 Sold (MLS) $56,000 WVMLS
- 2026-02-12 Sold (MLS) $56,000 RMLS
- 2026-01-14 Contingent — WVMLS
- 2026-01-14 Pending — RMLS
- 2026-01-06 Price Changed $60,000 WVMLS
- 2026-01-05 Price Changed $60,000 RMLS
- 2025-12-07 Listed $62,500 WVMLS
- 2025-12-04 Listed $62,500 RMLS
Property tax history
-4.4%/yrLatest (2018): $66 · +15.7% YoY. Source: county tax records.
Cash-flow waterfall
monthlySold comps — $/sqft
last 12 mo · ≤1 miLoading sold comps…