1770 Tucker Ln · Suncoast Estates, FL
Flood risk 1/10 · Minimal
- FEMA flood zone
- X (unshaded)
- Chance of flooding over 30 yrs
- 0.0%
- Est. flood insurance / yr
- $507 – $1,088
Fire risk 8/10 · Major
- Est. fire insurance / yr
- $947 – $1,759
Heat risk 10/10 · Severe
- Hot days now (above 107°F)
- 7 days/yr
- Hot days in 30 yrs
- 29 days/yr
Wind risk 10/10 · Severe
- Chance of severe wind over 30 yrs
- 99.0%
Air-quality risk 2/10 · Minimal
- Unhealthy air days now
- 1 days/yr
- Unhealthy air days in 30 yrs
- 1 days/yr
Risk factors via First Street. Map © Google.
Why this score? — see what drove the C- grade
The composite is a weighted blend of 9 inputs, each scored 0–100. Each bar is that input's sub-score; the figure is the points it added to the 100-point composite (weight × sub-score).
- Cash flow +19.5/30.0
- ARV discount +7.5/15.0
- DSCR +6.2/10.0
- Schools +4.1/10.0
- 1% rule +3.9/10.0
- Livability +3.4/5.0
- Rent growth +3.2/5.0
- Condition / age +2.5/5.0
- Appreciation +0.0/10.0
$235,900
🖨 Deal sheet 📄 Offer letter ✓ Due diligence
Listing remarks MLS
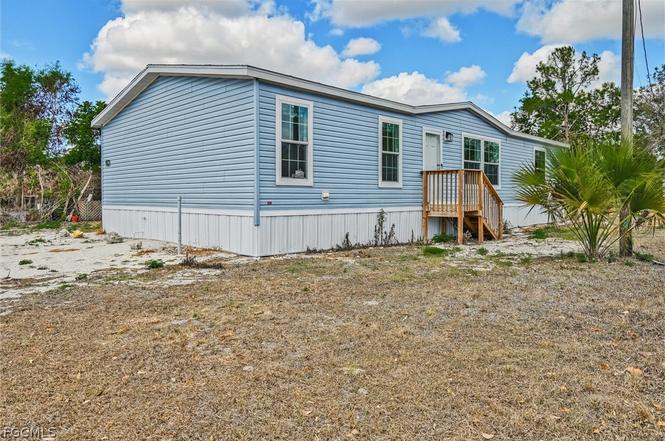
Check out this 2025 built double wide mobile home located on half an acre of land. This home features an Island kitchen with Whirlpool Stainless appliances, wood cabinetry & tile backsplash. Crown molding in living room, dining room, kitchen and master bedroom. Dining room has sliding glass doors that lead to wooden stairs. All three bedrooms include a walk in closet. Spacious master suite includes a large Master bath with shower only. Inside Utility room off the kitchen with door leading to wooden stairs. This property is conveniently located to shopping and dining. Also, Easy access to highway I75. This home would make for a great investment property, check it out today!
Key facts
- Island kitchen
- Walk in closet
- Wood cabinetry
Tags
Property features AI
Finance
- Other: Property is completed; Zoned AG-2; Lot approximately 0.5 acre (80 x 280)
- Financial info: Financial details not provided
- HOA & community: No HOA/association; Community street lights; Pets allowed
Exterior
- Parking: Parking details not provided
- Security: Security details not provided
- Utilities: Well water; Septic tank; Electricity connected
- Home design: Residential manufactured home; Double wide; One story; East-facing
- Construction: Vinyl siding; Shingle roof; Other foundation
- Exterior features: Sliding doors; Cleared lot; Paved road access
Interior
- Kitchen: Dishwasher; Microwave; Range; Refrigerator
- Bedrooms: 3 bedrooms
- Flooring: Vinyl flooring
- Bathrooms: 2 full bathrooms
- Heating & cooling: Central heating (electric); Central air conditioning
- Interior features: Crown molding; Eat-in kitchen; Split bedroom layout; Walk-in closet(s); Blinds on windows; Inside utility/additional room
- Laundry & utility: Laundry inside
Neighborhood map
What this means for you Summary
Snapshot
- This is a 3-bed/2.0-bath land listed at $236k.
Deal economics
- At list price, monthly cash flow is $266 ($3k/yr) — positive.
- The deal already cash-flows at list — no discount required.
- To meet the 1% rule (rent ≥ 1% of price), the offer needs to be $210k (11.0% below list).
- Recommended offer: $210k (11.0% below list) — sets the bar for 1% rule.
Location & tenants
- Location reads 68/100 on livability (#507 in FL) — a middle-class / working-renter tenant base. Strengths: cost of living A+, housing A+, crime B; Watch: commute D, schools F, amenities F.
- Lee (suburban): math 47% / reading 50% proficiency, ranked #42 of 73 in FL (top 58%) — families likely to look elsewhere, expect single-tenant / working-renter base with shorter leases.
- Market conditions: Rents rising (+2.6%/yr); 841 active listings in the ZIP; 33 comparable units currently listed for rent nearby; rentals at typical pace (median 16d on market — plan ~3-4 weeks tenant-placement turnaround); 15,411 units permitted in Lee County in 2024 (4,686 in 5+ unit buildings).
- At $2,101/mo this rent would consume 46% of the median local household income ($55k/yr) (locally 775% of renters already pay >50% of income on rent) — very limited rent-growth headroom before tenants either downsize or default.
Forward outlook
- Local home prices are declining (-3.0%/yr); year-one equity from $2k of loan paydown is wiped out by about $7k of value loss. Plan a longer hold.
- Lee County population projected at +44% by 2050 — long-run rental-demand tailwind backs the buy-and-hold thesis.
Negotiation context
- It's been on market 100 days — a 9% lower offer ($215k) is reasonable based on typical stale-listing flexibility.
- 4 sale attempts since 9y ago with the ask held roughly flat each time — persistent listings suggest the price (not the market) is what's stuck; bring a comps-based counter.
- Current owner paid $22k; list at $236k implies a 997% gain — meaningful room to come down on a strong offer.
Risks & watch-outs
- Climate carrying-cost: severe wind risk, 99% chance of damaging wind over 30y; severe wildfire risk; extreme-heat days projected 7→29/yr by 2055 (HVAC capex compounding) — expect insurance premiums to compound above CPI over the hold.
Questions for the listing agent
- It's been on market 100 days. Have you received any prior offers? Is the seller open to a 11% concession, seller financing, or rate buy-down credit?
- Why hasn't it sold? Are there any deal-killer items the seller is aware of (foundation, flood, title, zoning, code violations)?
- Is there a deadline driving the sale (1031 exchange, divorce, estate, relocation)? That informs how much negotiation room exists.
- Schools are F-rated, which usually means shorter tenancies and higher turnover. Who's the typical renter profile here, and what's been the actual vacancy rate?
- What's the average days-on-market for RENTAL listings here right now (not sales)? A rising rental-DOM trend means longer vacancies and softer asking-rent achievability than the comps imply.
- What's the recent tenant-quality profile in this submarket — average credit score on applications, eviction rate, late-payment / NSF rate, and stable-employment percentage? A property-management company in the area should have these aggregated.
- How much new for-sale + rental construction is in the pipeline within 1–3 miles? Heavy new supply typically softens prices + rents 12–24 months out; constrained supply supports both.
Investment metrics
- 1% rule
- 0.89% ✗
- Cap rate
- 7.65%
- Cash-on-cash
- 4.84%
- DSCR
- 1.22
- GRM
- 9.4
CMA / ARV
No comps found within radius.
Projected returns pro-forma
-3.0% appreciation · 2.63% rent growth · sell at horizon
- IRR
- -9.2%
- Equity multiple
- 0.66×
- Total profit
- $-22,166
- Equity at exit
- $35,173
- IRR
- -0.2%
- Equity multiple
- 0.98×
- Total profit
- $-1,109
- Equity at exit
- $20,396
Cash invested: $66,052 (down + closing). Projections, not guarantees.
Landlord ↔ Tenant lean methodology
- Overall (STATE)
- 87 Strongly Landlord-Friendly
- State Florida
- 87 Strongly Landlord-Friendly · R+3
- County
- — inherits STATE
- City
- — inherits STATE
ZIP-level market 33917
- Home prices YoY
- -30.2%
- Rents YoY
- 2.6%
- Active inventory
- 841
- Price-to-rent
- 9.4×
Monthly cashflow live
- Estimated rent
- $2,101 high interval (Pro) →
- Mortgage (P&I)
- −$1,237
- Tax from tax record
- −$58 /mo · $695/yr
- Insurance
- −$98
- HOA
- −$0
- Vacancy / Maint / Mgmt
- −$441
- Net cashflow
- $266
Break-even live
UW: 25.0% down · 7.5% · 30yr · 1.5% tax · 5.0% vac · 8.0% maint · 8.0% mgmt
Financing live
Cash to close
- Down payment
- $58,975
- Closing costs
- $7,077
- Reserves months
- —
- Total cash needed
- —
Loan-product check · same deal, 3 products live
Conventional
25% down · 7.5% · 30yr
- Down + closing
- —
- Monthly P&I
- —
- Monthly cashflow
- —
- DSCR
- —
- Eligible?
- —
Personal DTI + credit; lowest rate.
DSCR
20% down · 8.5% · 30yr
- Down + closing
- —
- Monthly P&I
- —
- Monthly cashflow
- —
- DSCR
- —
- Eligible?
- —
No personal income docs; deal must DSCR.
Hard money
10% down · 12.0% · 12mo
- Down + closing
- —
- Monthly P&I
- —
- Monthly cashflow
- —
- DSCR
- —
- Eligible?
- —
Short-term bridge; refi at stabilization.
Rent comps 33 comps
| Address | Beds | Baths | Sqft | Rent | $/sqft | DOM | Units | Dist |
|---|---|---|---|---|---|---|---|---|
| 4275 Cirella Ct North Fort Myers, FL | 3.0 | 2.5 | 1378 | $1,800 | $1.31 | 24d | 1 | 0.43mi |
| 17392 Monte Isola Way North Fort Myers, FL | 4.0 | 2.5 | 1871 | $2,299 | $1.23 | 24d | 1 | 0.45mi |
| 4263 Villa Rapallo Way North Fort Myers, FL | 4.0 | 2.0 | 1936 | $2,200 | $1.14 | 16d | 1 | 0.47mi |
| 4263 Villa Rapallo Way North Fort Myers, FL | 4.0 | 2.0 | 1937 | $2,200 | $1.14 | 3d | 1 | 0.47mi |
| 4276 Cirella Ct North Fort Myers, FL | 3.0 | 2.5 | 1378 | $1,800 | $1.31 | 24d | 1 | 0.48mi |
| 4264 Cirella Ct North Fort Myers, FL | 3.0 | 2.5 | 1442 | $2,000 | $1.39 | 12d | 1 | 0.49mi |
| 4241 Caterina Ct North Fort Myers, FL | 3.0 | 2.5 | 1529 | $1,900 | $1.24 | 16d | 1 | 0.52mi |
| 17400 Monte Isola Way North Fort Myers, FL | 3.0 | 2.0 | 1448 | $1,875 | $1.29 | 24d | 1 | 0.52mi |
| 4232 Villa Rapallo Way North Fort Myers, FL | 4.0 | 2.0 | 1812 | $1,900 | $1.05 | 24d | 1 | 0.53mi |
| 4228 Caterina Ct North Fort Myers, FL | 3.0 | 2.5 | 1700 | $1,850 | $1.09 | 11d | 1 | 0.55mi |
| 4216 Villa Rapallo Way North Fort Myers, FL | 4.0 | 2.0 | 1817 | $2,000 | $1.10 | 2d | 1 | 0.57mi |
| 4208 Caterina Ct North Fort Myers, FL | 3.0 | 2.5 | 1347 | $1,800 | $1.34 | 14d | 1 | 0.58mi |
| 17489 Monte Isola Way North Fort Myers, FL | 3.0 | 2.5 | 1347 | $1,800 | $1.34 | 14d | 1 | 0.69mi |
| 17499 Monte Isola Way Unit 17499 North Fort Myers, FL | 3.0 | 2.5 | 1405 | $1,800 | $1.28 | 14d | 1 | 0.71mi |
| 17669 Paradiso Way North Fort Myers, FL | 3.0 | 2.0 | 1551 | $1,999 | $1.29 | 24d | 1 | 0.71mi |
| 17669 Paradiso Way North Fort Myers, FL | 3.0 | 2.0 | 1551 | $1,999 | $1.29 | 3d | 1 | 0.71mi |
| 4106 Granita Ct North Fort Myers, FL | 4.0 | 2.5 | 1812 | $2,300 | $1.27 | 24d | 1 | 0.79mi |
| 4106 Lattuca Ln North Fort Myers, FL | 4.0 | 2.5 | 1874 | $2,200 | $1.17 | 24d | 1 | 0.83mi |
| 4106 San Felice Ln North Fort Myers, FL | 4.0 | 2.5 | 1874 | $2,400 | $1.28 | 24d | 1 | 0.87mi |
| 17225 Cantu Ct North Fort Myers, FL | 4.0 | 2.0 | 1824 | $2,200 | $1.21 | 24d | 1 | 0.95mi |
| 17920 Antherium Ln North Fort Myers, FL | 2.0 | 2.0 | 1693 | $2,400 | $1.42 | 24d | 1 | 0.97mi |
| 17244 Cantu Ct North Fort Myers, FL | 4.0 | 2.0 | 1824 | $2,200 | $1.21 | 14d | 1 | 1.00mi |
| 2376 Case Ln Unit A North Fort Myers, FL | 2.0 | 2.0 | 1440 | $1,800 | $1.25 | 24d | 1 | 1.02mi |
| 2388 Case Ln North Fort Myers, FL | 3.0 | 2.0 | 1064 | $1,825 | $1.72 | 3d | 1 | 1.04mi |
| 535 Zebra Dr #535 North Fort Myers, FL | 3.0 | 2.0 | 1352 | $1,499 | $1.11 | 14d | 1 | 1.07mi |
| 17158 Pompeii Way North Fort Myers, FL | 4.0 | 3.0 | 2205 | $2,600 | $1.18 | 14d | 1 | 1.10mi |
| 574 Leopard Ln #574 North Fort Myers, FL | 4.0 | 2.0 | 1459 | $1,599 | $1.10 | 13d | 1 | 1.16mi |
| 2861 N 2nd St North Fort Myers, FL | 3.0 | 2.0 | 1951 | $2,500 | $1.28 | 21d | 1 | 1.32mi |
| 2861 N 2nd St North Fort Myers, FL | 3.0 | 2.0 | 1951 | $2,500 | $1.28 | 24d | 1 | 1.32mi |
| 3358 Sabal Springs Blvd North Fort Myers, FL | 3.0 | 2.0 | 1621 | $2,200 | $1.36 | 24d | 1 | 1.35mi |
| 4232 Pine Drop Ln North Fort Myers, FL | 3.0 | 2.0 | 1914 | $1,495 | $0.78 | 3d | 1 | 1.36mi |
| 4234 Pine Drop Ln North Fort Myers, FL | 3.0 | 2.0 | 1914 | $1,495 | $0.78 | 3d | 1 | 1.36mi |
| 266 Mongoose Ln #266 North Fort Myers, FL | 3.0 | 2.0 | 1372 | $1,499 | $1.09 | 3d | 1 | 1.41mi |
Listing history 21 events
-
2026-06-17days on market $235,900 Active 100 DOM
-
2026-06-16days on market $235,900 Active 99 DOM
-
2026-06-15days on market $235,900 Active 98 DOM
-
2026-06-13days on market $235,900 Active 96 DOM
-
2026-06-10days on market $235,900 Active 93 DOM
-
2026-06-09days on market $235,900 Active 92 DOM
-
2026-06-07days on market $235,900 Active 90 DOM
-
2026-06-02days on market $235,900 Active 85 DOM
-
2026-06-01days on market $235,900 Active 84 DOM
-
2026-06-01days on market $235,900 Active 83 DOM
-
2026-03-06$235,900 Active
Show marketing remark (687 chars)
Check out this 2025 built double wide mobile home located on half an acre of land. This home features an Island kitchen with Whirlpool Stainless appliances, wood cabinetry & tile backsplash. Crown molding in living room, dining room, kitchen and master bedroom. Dining room has sliding glass doors that lead to wooden stairs. All three bedrooms include a walk in closet. Spacious master suite includes a large Master bath with shower only. Inside Utility room off the kitchen with door leading to wooden stairs. This property is conveniently located to shopping and dining. Also, Easy access to highway I75. This home would make for a great investment property, check it out today!
-
2026-03-06$235,900 Active 687-char remark
Show marketing remark (687 chars)
Check out this 2025 built double wide mobile home located on half an acre of land. This home features an Island kitchen with Whirlpool Stainless appliances, wood cabinetry & tile backsplash. Crown molding in living room, dining room, kitchen and master bedroom. Dining room has sliding glass doors that lead to wooden stairs. All three bedrooms include a walk in closet. Spacious master suite includes a large Master bath with shower only. Inside Utility room off the kitchen with door leading to wooden stairs. This property is conveniently located to shopping and dining. Also, Easy access to highway I75. This home would make for a great investment property, check it out today!
-
2017-04-16historical
-
2017-03-08$20,000 Active
-
2017-03-08historical
-
2017-03-06price $22,000
-
2017-03-02$20,000 Active
-
2004-09-20soldstatus $21,500
-
1999-04-05soldstatus $20,900
-
1996-12-03soldstatus $15,500
-
1986-11-01soldstatus $13,000
ⓘ Source: listings_history table (triggers on properties + properties_extension) + one-shot
backfill from property_details.listing_events for pre-trigger history.
Tax reassessment forecast FL · Resets to sale price
- Current annual tax
- $695 · $58/mo
- Projected year-2 tax
- $1,958 · $163/mo
- Expected delta
- +$1,262/yr (+$105/mo · 181.5%)
ⓘ Screening estimate from a state-policy table — verify with the county assessor before closing.
Climate risk First Street
- Flood 1/10 Low FEMA zone X (unshaded) · 0% chance over 30 yrs
- Wildfire 8/10 Severe
- Heat 10/10 Extreme 7 d/yr ≥107°F today · 29 d/yr by 30 yrs out
- Wind 10/10 Extreme 99% chance of damaging wind over 30 yrs
- Air quality 2/10 Low 1 unhealthy d/yr today · 1 by 30 yrs out
Nearby sold comps map
Loading sold comps map…
Walkable amenities ~0.75 mi
Loading nearby amenities…
Taxation est. · year 1
- Rental income
- $25,208
- − Mortgage interest
- −$13,214
- − Property taxes
- −$695
- − Insurance
- −$1,180
- − Repairs & maintenance
- −$2,017
- − Management
- −$2,017
- − Depreciation
- −$6,863
- Taxable loss
- −$777
- Est. tax savings @ 24.0%
- +$187
- After-tax cash flow
- $3,381/yr
For passive investors: Depreciation is non-cash, so a rental often shows a tax loss while cash-flowing — sheltering income. Rental losses are passive: they offset passive income freely, and up to $25,000/yr can offset ordinary (W-2) income if you actively participate and your MAGI is under $100k (phasing out to $0 by $150k); unused losses carry forward. On sale, claimed depreciation is recaptured at up to 25%, and gains may owe capital-gains tax (a 1031 exchange can defer both). Figures are a year-1 estimate at your 24.0% rate — not tax advice; consult a CPA.
Schools (NCES district)
- District
- Lee
- NCES district ID
- 1201080
- Math proficiency
- 47% ▼ -11.00%
- Reading proficiency
- 50% ▼ -4.00%
- Median HH income
- $49,518
- Composite
- 41.49/100
- National rank
- #3458
- State rank
- #42 of 73 in FL
Livability — Suncoast Estates
- Score
- 68/100
- State rank
- #507
- US rank
- #9351
Category grades
Schools grade is shown separately in the Schools card above.
Census & demographics
- Census place
- Suncoast Estates, FL
- County
- Lee County · 788,662 people
- Metro
- Cape Coral-Fort Myers, FL
- Population (ZIP)
- 33,380
- Household income
- $55,000
- Rent vs Own
- Severe rent burden
- 775.0
Population outlook (Lee County) Hauer SSP2
- Today (2025)
- 871,946 people
- By 2030
- 955,468 · +9.6%
- By 2040
- 1,113,587 · +27.7%
- By 2050
- 1,256,891 · +44.1%
- By 2075
- 1,560,270 · +78.9%
- By 2100
- 1,726,848 · +98.0%
Race, ethnicity, and origin ACS 2023
- Neighborhood character
- Predominantly White (85%)
- Race & ethnicity
- White 85% Hispanic / Latino 10% Two or more races 7% Asian 1% Black 1%
- Hispanic origin (detail)
- Mexican 2% Puerto Rican 1% Cuban 3%
- Common ancestry
- Lithuanian 3% Romanian 3% Slovak 2%
- Foreign-born
- 10% · Canada
- Languages at home
- 88% English-only · Spanish 9% Other Indo-European 1% Russian/Polish/Slavic 1%
Political lean MEDSL · Lee
- 2024 margin
- Strong R (+28.4) · D 35.5% · R 63.9%
- 2008→2024 swing
- -18.0pp toward R · 2008: -10.4pp · 2024: -28.4pp
- All cycles
- 2024: R+28.4 2020: R+19.2 2016: R+20.4 2012: R+16.6 2008: R+10.4
Not yet ingested
- Civics
- —
Market trends
- HPI YoY
- ▼ -122.28%
- Current HPI
- 282.2895
- Rent YoY
- ▲ 2.63%
- Metro
- Cape Coral-Fort Myers, FL
- State GDP YoY
- ▲ 3.28%
- F500 in state
- 36
Industry mix (Fortune 500 HQ in FL)
| Industry | F500 HQs | Revenue |
|---|---|---|
| Industrial Technology | 2 | $29B |
|
||
| Insurance | 2 | $17B |
|
||
| Retail | 1 | $60B |
|
||
| Technology Distribution | 1 | $58B |
|
||
| Homebuilding | 1 | $35B |
|
||
| Technology Manufacturing | 1 | $35B |
|
||
Price history
+1714.6% since first listed11 events — show timeline
- 2026-03-06 Listed $235,900 FORTMLS
- 2026-03-06 Listed $235,900 Stellar MLS as Distributed by MLS Grid
- 2017-04-16 Listing Removed — FORTMLS
- 2017-03-08 Listed $20,000 FORTMLS
- 2017-03-08 Listing Removed — FORTMLS
- 2017-03-06 Price Changed $22,000 FORTMLS
- 2017-03-02 Listed $20,000 FORTMLS
- 2004-09-20 Sold (Public Records) $21,500 Public Records
- 1999-04-05 Sold (Public Records) $20,900 Public Records
- 1996-12-03 Sold (Public Records) $15,500 Public Records
- 1986-11-01 Sold (Public Records) $13,000 Public Records
Property tax history
+4.6%/yrLatest (2025): $695 · +145.3% YoY. Source: county tax records.
Cash-flow waterfall
monthlySold comps — $/sqft
last 12 mo · ≤1 miLoading sold comps…