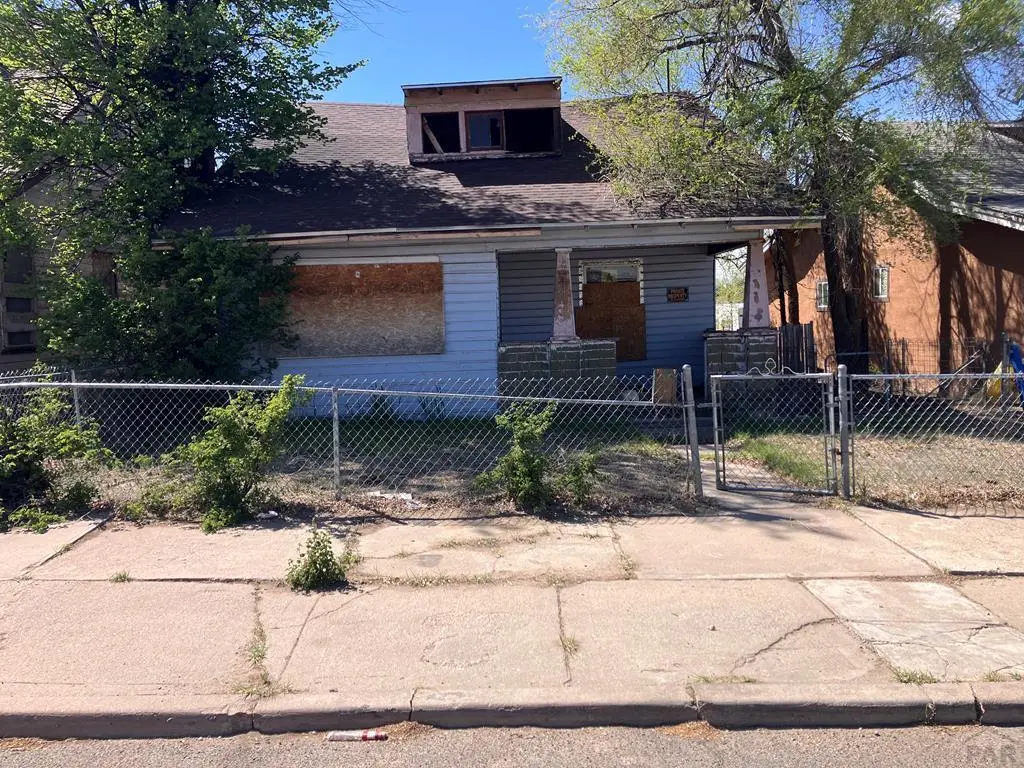
1006 Raton Ave · La Junta, CO
Flood risk 1/10 · Minimal
- FEMA flood zone
- X
- Chance of flooding over 30 yrs
- 0.0%
- Est. flood insurance / yr
- $507 – $1,088
Fire risk 7/10 · Major
- Est. fire insurance / yr
- $939 – $1,743
Heat risk 4/10 · Minor
- Hot days now (above 99°F)
- 7 days/yr
- Hot days in 30 yrs
- 20 days/yr
Wind risk 2/10 · Minimal
- Chance of severe wind over 30 yrs
- —
Air-quality risk 2/10 · Minimal
- Unhealthy air days now
- 1 days/yr
- Unhealthy air days in 30 yrs
- 2 days/yr
Risk factors via First Street. Map © Google.
Why this score? — see what drove the D grade
The composite is a weighted blend of 9 inputs, each scored 0–100. Each bar is that input's sub-score; the figure is the points it added to the 100-point composite (weight × sub-score).
- Cash flow +15.0/30.0
- ARV discount +7.5/15.0
- 1% rule +5.0/10.0
- DSCR +5.0/10.0
- Livability +3.4/5.0
- Rent growth +2.5/5.0
- Condition / age +2.5/5.0
- Schools +1.3/10.0
- Appreciation +0.0/10.0
$20,000
🖨 Deal sheet (PDF) 📄 Offer letter ✓ Due diligence
Listing remarks
This home and property is a great opportunity for a fix and flip! Close proximity to all the schools, park and hospital. Has great potential to be a 3 bed, 2 bath.
Key facts
- 5,249 sq ft lot
- Built 1922
- Listed 66 days
Property features AI
Finance
- Other: Zoned R-1
- HOA & community: No association amenities
Exterior
- Parking: No garage
- Utilities: Public sewer; Public water available
- Home design: Single-family residential; Frame construction with wood siding
- Construction: Composition roof
- Exterior features: Covered patio/porch; Irregular lot
Interior
- Kitchen: No appliances included
- Bedrooms: 2 main-level bedrooms
- Flooring: Hardwood; Wood; Vinyl
- Bathrooms: 1 full bathroom on the main level
- Heating & cooling: No heating; No cooling
- Interior features: Double-pane windows with wood frames; Unfinished, partial basement; Covered porch
- Laundry & utility: Laundry on main level in the kitchen
Neighborhood map
What this means for you Summary
Snapshot
- This is a 3-bed/1.0-bath single-family listed at $20k.
Deal economics
- At list price, monthly cash flow is $757 ($9k/yr) — positive.
- The deal already cash-flows at list — no discount required.
- Meets the 1% rule at list price ($1k rent vs $20k).
- Recommended offer: $19k (6.0% below list) — sets the bar for market timing.
- Cap rate 51.7% vs local median 4.1% in La Junta — top-decile yield for the area; either an underpriced asset or a hidden risk that comps aren't pricing in. Stress-test before assuming the spread holds.
Location & tenants
- Location reads 67/100 on livability (#126 in CO) — a middle-class / working-renter tenant base. Strengths: cost of living A+, housing A+, health & safety A+; Watch: employment D+, crime F, amenities F.
- East Otero School District No. R1 (town): math 7% / reading 26% proficiency, ranked #83 of 86 in CO (top 96%) — low school quality limits family demand, transient renter base, plan for 1-2y turnover; 65% free/reduced lunch — lower-income household profile, screen leases tightly.
- Zoned schools: La Junta Intermediate School (math 2% / reading 27%, grade F, #793 of 966 statewide, top 84%, 407 students, 79% FRL); La Junta Jr/Sr High School (math 12% / reading 32%, grade F, #307 of 381 statewide, top 82%, 539 students, 72% FRL).
- Market conditions: 87 active listings in the ZIP; 11 units permitted in Otero County in 2024 (0 in 5+ unit buildings).
Forward outlook
- Local home prices are declining (-3.0%/yr); year-one equity from $138 of loan paydown is wiped out by about $600 of value loss. Plan a longer hold.
- Otero County population projected at -17% by 2050 — secular population decline; favor cash flow + early exit over multi-decade hold.
- At projected returns (-3.0% appreciation + 3.0% rent growth), your $6k cash investment doubles in ~1 year — after that, you're playing with house money.
Negotiation context
- It's been on market 66 days — a 6% lower offer ($19k) is reasonable based on typical stale-listing flexibility.
- 7 sale attempts since 19y ago with the ask held roughly flat each time — persistent listings suggest the price (not the market) is what's stuck; bring a comps-based counter.
- Current owner paid $5k; list at $20k implies a 292% gain — meaningful room to come down on a strong offer.
Risks & watch-outs
- Watch-outs: built in 1922 — expect roof / HVAC / electrical / plumbing capex.
- Climate carrying-cost: major wildfire risk — expect insurance premiums to compound above CPI over the hold.
Questions for the listing agent
- It's been on market 66 days. Have you received any prior offers? Is the seller open to a 6% concession, seller financing, or rate buy-down credit?
- Built in 1922 — when were the roof, HVAC, electrical panel, plumbing, and water heater last replaced?
- Why hasn't it sold? Are there any deal-killer items the seller is aware of (foundation, flood, title, zoning, code violations)?
- Is there a deadline driving the sale (1031 exchange, divorce, estate, relocation)? That informs how much negotiation room exists.
- Schools are F-rated, which usually means shorter tenancies and higher turnover. Who's the typical renter profile here, and what's been the actual vacancy rate?
- Crime grade is F in this area — have there been break-ins, vandalism, or insurance claims at this property in the last 3 years? What carrier currently insures it and at what premium?
- The area grade is low — what's the realistic commute time and amenity access for the typical tenant pool here? Any planned neighborhood developments (good or bad) we should know about?
- What's the average days-on-market for RENTAL listings here right now (not sales)? A rising rental-DOM trend means longer vacancies and softer asking-rent achievability than the comps imply.
- What's the recent tenant-quality profile in this submarket — average credit score on applications, eviction rate, late-payment / NSF rate, and stable-employment percentage? A property-management company in the area should have these aggregated.
- How much new for-sale + rental construction is in the pipeline within 1–3 miles? Heavy new supply typically softens prices + rents 12–24 months out; constrained supply supports both.
Investment metrics
- 1% rule
- 5.53% ✓
- Cap rate
- 51.72%
- Cash-on-cash
- 162.23%
- DSCR
- 8.22
- GRM
- 1.5
CMA / ARV
- ARV (on-the-fly)
- $200,880
- Comps found
- 12
Show comp detail 12 sales within ~0.75 mi
| Address | Dist | Beds/Ba | Sqft | Sold | Price | $/sf | Match |
|---|---|---|---|---|---|---|---|
| 1115 Cimarron Ave | 0.11mi | 3/1.0 | 1,209 (-7%) | 12mo | $140,000 | $116 | 74 |
| 308 E 10th St | 0.16mi | 2/1.0 (-1) | 1,234 (-5%) | 15mo | $150,000 | $122 | 66 |
| 702 Smithland Ave | 0.26mi | 3/2.0 | 1,250 (-4%) | 16mo | $275,000 | $220 | 65 |
| 410 Raton Ave | 0.40mi | 3/2.0 | 1,400 (+8%) | 2mo | $80,000 | $57 | 62 |
| 822 Colorado Ave | 0.12mi | 2/2.0 (-1) | 1,452 (+12%) | 5mo | $225,000 | $155 | 61 |
| 1401 Bradish Ave | 0.53mi | 3/2.0 | 1,372 (+6%) | 2mo | $285,000 | $208 | 60 |
| 1417 Bradish Ave | 0.55mi | 3/2.0 | 1,250 (-4%) | 10mo | $217,000 | $174 | 56 |
| 501 Lewis Ave | 0.49mi | 3/2.0 | 1,180 (-9%) | 3mo | $77,000 | $65 | 55 |
| 914 Santa Fe | 0.15mi | 2/1.0 (-1) | 1,109 (-14%) | 11mo | $175,000 | $158 | 54 |
| 621 Edison Ave | 0.35mi | 3/2.0 | 1,144 (-12%) | 13mo | $156,000 | $136 | 49 |
| 324 Lewis Ave | 0.54mi | 3/2.0 | 1,201 (-7%) | 16mo | $52,000 | $43 | 45 |
| 1320 Bradish Ave | 0.49mi | 4/2.0 (+1) | 1,432 (+10%) | 12mo | $237,000 | $166 | 41 |
Match score weights: distance 35% · size 25% · config 20% · recency 20%. Top-matched comps best support the ARV.
Projected returns pro-forma
-3.0% appreciation · 3.0% rent growth · sell at horizon
- IRR
- —
- Equity multiple
- 9.03×
- Total profit
- $44,982
- Equity at exit
- $2,982
- IRR
- —
- Equity multiple
- 19.08×
- Total profit
- $101,276
- Equity at exit
- $1,729
Cash invested: $5,600 (down + closing). Projections, not guarantees.
Landlord ↔ Tenant lean methodology
- Overall (STATE)
- 38 Tenant-Leaning
- State Colorado
- 38 Tenant-Leaning · D+4
- County
- — inherits STATE
- City
- — inherits STATE
ZIP-level market 81050
- Active inventory
- 87
- Price-to-rent
- 1.5×
Monthly cashflow live
- Estimated rent
- $1,107 medium interval (Pro) →
- Mortgage (P&I)
- −$105
- Tax from tax record
- −$4 /mo · $49/yr
- Insurance
- −$8
- HOA
- −$0
- Vacancy / Maint / Mgmt
- −$232
- Net cashflow
- $757
Break-even live
Sensitivity live
| Price | -10% $768 | -5% $763 | +0% $757 | +5% $751 | +10% $746 |
|---|---|---|---|---|---|
| Rent | -10% $670 | -5% $713 | +0% $757 | +5% $801 | +10% $845 |
| Rate | -1.0pp $767 | -0.5pp $762 | base $757 | +0.5pp $752 | +1.0pp $747 |
UW: 25.0% down · 7.5% · 30yr · 1.5% tax · 5.0% vac · 8.0% maint · 8.0% mgmt
Financing live
Cash to close
- Down payment
- $5,000
- Closing costs
- $600
- Reserves months
- —
- Total cash needed
- —
Loan-product check · same deal, 3 products live
Conventional
25% down · 7.5% · 30yr
- Down + closing
- —
- Monthly P&I
- —
- Monthly cashflow
- —
- DSCR
- —
- Eligible?
- —
Personal DTI + credit; lowest rate.
DSCR
20% down · 8.5% · 30yr
- Down + closing
- —
- Monthly P&I
- —
- Monthly cashflow
- —
- DSCR
- —
- Eligible?
- —
No personal income docs; deal must DSCR.
Hard money
10% down · 12.0% · 12mo
- Down + closing
- —
- Monthly P&I
- —
- Monthly cashflow
- —
- DSCR
- —
- Eligible?
- —
Short-term bridge; refi at stabilization.
Listing history 31 events
-
2026-06-21days on market $20,000 Active 66 DOM
-
2026-06-21days on market $20,000 Active 65 DOM
-
2026-06-18days on market $20,000 Active 63 DOM
-
2026-06-17days on market $20,000 Active 62 DOM
-
2026-06-16days on market $20,000 Active 61 DOM
-
2026-06-15days on market $20,000 Active 60 DOM
-
2026-06-13days on market $20,000 Active 58 DOM
-
2026-06-12days on market $20,000 Active 57 DOM
-
2026-06-09days on market $20,000 Active 54 DOM
-
2026-06-08days on market $20,000 Active 53 DOM
-
2026-06-07days on market $20,000 Active 52 DOM
-
2026-06-07days on market $20,000 Active 51 DOM
-
2026-06-04days on market $20,000 Active 48 DOM
-
2026-06-02days on market $20,000 Active 47 DOM
-
2026-06-01days on market $20,000 Active 46 DOM
-
2026-05-31days on market $20,000 Active 45 DOM
-
2026-05-31days on market $20,000 Active 44 DOM
-
2026-04-16$20,000 Active
-
2025-12-13historical
-
2025-12-13historical
-
2025-10-24price $39,900
-
2025-10-24price $39,900
-
2025-10-24price $39,900
-
2025-10-24price $39,900
-
2025-06-14$45,000 Active
-
2025-06-14$45,000 Active
-
2025-06-14$45,000 Active
-
2008-06-24soldstatus $5,100
-
2008-04-30$5,000
-
2007-11-30$5,000
-
2007-07-04$12,112
ⓘ Source: listings_history table (triggers on properties + properties_extension) + one-shot
backfill from property_details.listing_events for pre-trigger history.
Tax reassessment forecast CO · Resets to sale price
- Current annual tax
- $49 · $4/mo
- Projected year-2 tax
- $110 · $9/mo
- Expected delta
- +$61/yr (+$5/mo · 125.3%)
ⓘ Screening estimate from a state-policy table — verify with the county assessor before closing.
Climate risk First Street
- Flood 1/10 Low FEMA zone X · 0% chance over 30 yrs
- Wildfire 7/10 Severe
- Heat 4/10 Moderate 7 d/yr ≥99°F today · 20 d/yr by 30 yrs out
- Wind 2/10 Low
- Air quality 2/10 Low 1 unhealthy d/yr today · 2 by 30 yrs out
Nearby sold comps map
Loading sold comps map…
Walkable amenities ~0.75 mi
Loading nearby amenities…
Taxation est. · year 1
- Rental income
- $13,282
- − Mortgage interest
- −$1,120
- − Property taxes
- −$49
- − Insurance
- −$100
- − Repairs & maintenance
- −$1,063
- − Management
- −$1,063
- − Depreciation
- −$582
- Taxable income
- $9,306
- Est. tax owed @ 24.0%
- −$2,233
- After-tax cash flow
- $6,852/yr
For passive investors: Depreciation is non-cash, so a rental often shows a tax loss while cash-flowing — sheltering income. Rental losses are passive: they offset passive income freely, and up to $25,000/yr can offset ordinary (W-2) income if you actively participate and your MAGI is under $100k (phasing out to $0 by $150k); unused losses carry forward. On sale, claimed depreciation is recaptured at up to 25%, and gains may owe capital-gains tax (a 1031 exchange can defer both). Figures are a year-1 estimate at your 24.0% rate — not tax advice; consult a CPA.
Schools (NCES district)
- District
- East Otero School District No. R1
- NCES district ID
- 0805130
- Math proficiency
- 7% ▼ -2.00%
- Reading proficiency
- 26% ▲ 5.00%
- Median HH income
- $33,475
- Composite
- 13.36/100
- National rank
- #9534
- State rank
- #83 of 86 in CO
Livability — La Junta
- Score
- 67/100
- State rank
- #126
- US rank
- #10703
Category grades
Schools grade is shown separately in the Schools card above.
Census & demographics
- Census place
- La Junta, CO
- Population (ZIP)
- 9,774
Population outlook (Otero County) Hauer SSP2
- Today (2025)
- 17,363 people
- By 2030
- 16,776 · -3.4%
- By 2040
- 15,534 · -10.5%
- By 2050
- 14,467 · -16.7%
- By 2075
- 12,054 · -30.6%
- By 2100
- 9,392 · -45.9%
Race, ethnicity, and origin ACS 2023
- Neighborhood character
- Diverse neighborhood (Simpson 0.57)
- Race & ethnicity
- White 52% Hispanic / Latino 40% Two or more races 10% Native American 2% Black 1%
- Hispanic origin (detail)
- Mexican 34%
- Common ancestry
- Lithuanian 2% Iranian 2% Slovak 2%
- Foreign-born
- 4% · Canada
- Languages at home
- 85% English-only · Spanish 14%
Political lean MEDSL · Otero
- 2024 margin
- Strong R (+26.4) · D 35.5% · R 61.9% · Other 2.7%
- 2008→2024 swing
- -15.9pp toward R · 2008: -10.5pp · 2024: -26.4pp
- All cycles
- 2024: R+26.4 2020: R+22.5 2016: R+25.2 2012: R+9.3 2008: R+10.5
Not yet ingested
- Civics
- —
Market trends
- HPI YoY
- ▼ -188.44%
- Current HPI
- 232.984
- Rent YoY
- —
- Metro
- —
- State GDP YoY
- ▲ 1.95%
- F500 in state
- 14
Industry mix (Fortune 500 HQ in CO)
| Industry | F500 HQs | Revenue |
|---|---|---|
| Technology Distribution | 1 | $31B |
|
||
| Food / Agriculture | 1 | $18B |
|
||
| Packaging | 1 | $14B |
|
||
| Healthcare | 1 | $13B |
|
||
| Energy | 1 | $10B |
|
||
| Technology | 1 | $4B |
|
||
Price history
+65.1% since first listed14 events — show timeline
- 2026-04-16 Listed $20,000 PARMLS
- 2025-12-13 Listing Removed — IRES
- 2025-12-13 Listing Removed — REColorado as Distributed by MLS Grid
- 2025-10-24 Price Changed $39,900 elevateMLS
- 2025-10-24 Price Changed $39,900 IRES
- 2025-10-24 Price Changed $39,900 PARMLS
- 2025-10-24 Price Changed $39,900 REColorado as Distributed by MLS Grid
- 2025-06-14 Listed $45,000 PARMLS
- 2025-06-14 Listed $45,000 IRES
- 2025-06-14 Listed $45,000 REColorado as Distributed by MLS Grid
- 2008-06-24 Sold (MLS) $5,100 PARMLS
- 2008-04-30 Listed $5,000 PARMLS
- 2007-11-30 Listed $5,000 PARMLS
- 2007-07-04 Listed $12,112 PARMLS
Property tax history
-1.4%/yrLatest (2024): $49 · -1.3% YoY. Source: county tax records.
Cash-flow waterfall
monthlySold comps — $/sqft
last 12 mo · ≤1 miLoading sold comps…