107 Deer Chase Dr · Canon, GA
Flood risk No data
- FEMA flood zone
- —
- Chance of flooding over 30 yrs
- —
- Est. flood insurance / yr
- —
Fire risk No data
- Est. fire insurance / yr
- —
Heat risk No data
- Hot days now (above threshold)
- —
- Hot days in 30 yrs
- —
Wind risk No data
- Chance of severe wind over 30 yrs
- —
Air-quality risk No data
- Unhealthy air days now
- —
- Unhealthy air days in 30 yrs
- —
Risk factors via First Street. Map © Google.
Why this score? — see what drove the D- grade
The composite is a weighted blend of 9 inputs, each scored 0–100. Each bar is that input's sub-score; the figure is the points it added to the 100-point composite (weight × sub-score).
- Appreciation +10.0/10.0
- Cash flow +7.9/30.0
- ARV discount +4.6/15.0
- Livability +3.3/5.0
- Schools +2.7/10.0
- Rent growth +2.5/5.0
- Condition / age +2.5/5.0
- 1% rule +2.4/10.0
- DSCR +2.0/10.0
$214,900
🖨 Deal sheet 📄 Offer letter ✓ Due diligence
Listing remarks
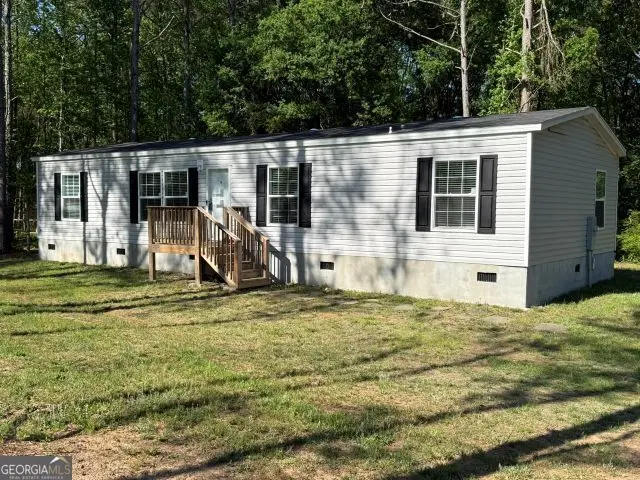
Well maintained 2024 Fleetwood double wide mobile home in Hart County on 1.25 acres! Featuring an open floor plan, a split-bedroom plan with 4 bedrooms, 2 baths, a spacious kitchen with stainless steel appliances, this home is ready to move in! Permanent block foundation. This property is eligible under the Freddie Mac First Look Initiative through 6/5/26.
Key facts
- 1.25 acre lot
- Built 2024
- Listed 43 days
Property features AI
Finance
- Other: Property listed as resale
- HOA & community: No homeowners association
Exterior
- Parking: Off-street parking
- Utilities: Public water available; Septic tank; Water service available
- Home design: Single-family residence; Residential property; Built in 2024
- Construction: Vinyl siding; Block foundation; Composition roof
- Exterior features: Deck; Level, open and partially sloped lot; Grassed and partially wooded vegetation; Double pane windows
Interior
- Kitchen: Breakfast area; Kitchen island; Pantry; Dishwasher; Refrigerator; Electric water heater
- Bedrooms: 4 bedrooms on the main level
- Flooring: Laminate flooring
- Bathrooms: 2 full bathrooms on the main level
- Heating & cooling: Electric heating; Heat pump; Central air conditioning; Electric cooling
- Interior features: Double vanity; Split-bedroom floor plan; One-level living; Crawl space basement; Family room
- Laundry & utility: Mud room; Laundry room
Neighborhood map
What this means for you Summary
Snapshot
- This is a 4-bed/2.0-bath manufactured listed at $215k.
Deal economics
- At list price, monthly cash flow is $-225 ($-3k/yr) — negative.
- To cash-flow at today's rent, offer at most $182k (15.2% below list).
- To meet the 1% rule (rent ≥ 1% of price), the offer needs to be $159k (25.8% below list).
- Recommended offer: $159k (25.8% below list) — sets the bar for 1% rule.
Location & tenants
- Location reads 66/100 on livability (#189 in GA) — a middle-class / working-renter tenant base. Strengths: crime A+, cost of living A+, housing A+; Watch: amenities F, commute F, employment F.
- Hart County (town): math 32% / reading 33% proficiency, ranked #82 of 174 in GA (top 47%) — families likely to look elsewhere, expect single-tenant / working-renter base with shorter leases.
- Zoned schools: North Hart Elementary School (math 38% / reading 35%, grade F, #509 of 1,228 statewide, top 42%, 656 students, 57% FRL) — zoned schools at 57% FRL track the district average.
- Market conditions: 27 active listings in the ZIP; 170 units permitted in Hart County in 2024 (8 in 5+ unit buildings).
Forward outlook
- In year one you build about $23k of equity ($1k loan paydown + $21k appreciation (10.0% local appreciation)).
- Hart County population projected to shrink 4% by 2050 — rents likely to lag national; underwrite the cash flow, not the appreciation.
- By year 2, paydown + projected appreciation supports a ~$37k cash-out refi (75% LTV) — recoverable capital for the next deal without selling this one.
Negotiation context
- It's been on market 44 days — a 3% lower offer ($208k) is reasonable based on typical stale-listing flexibility.
- 3 sale attempts with the ask held roughly flat each time — persistent listings suggest the price (not the market) is what's stuck; bring a comps-based counter.
- Current owner paid $166k; 29% above their basis — modest negotiation headroom, anchor on the comps not their cost.
Questions for the listing agent
- What do current leases actually rent for vs. the listed asking? Can we see a recent rent roll and the last 12 months of T-12 income?
- It's been on market 44 days. Have you received any prior offers? Is the seller open to a 26% concession, seller financing, or rate buy-down credit?
- Is there a deadline driving the sale (1031 exchange, divorce, estate, relocation)? That informs how much negotiation room exists.
- Schools are F-rated, which usually means shorter tenancies and higher turnover. Who's the typical renter profile here, and what's been the actual vacancy rate?
- The area grade is low — what's the realistic commute time and amenity access for the typical tenant pool here? Any planned neighborhood developments (good or bad) we should know about?
- What's the average days-on-market for RENTAL listings here right now (not sales)? A rising rental-DOM trend means longer vacancies and softer asking-rent achievability than the comps imply.
- What's the recent tenant-quality profile in this submarket — average credit score on applications, eviction rate, late-payment / NSF rate, and stable-employment percentage? A property-management company in the area should have these aggregated.
- How much new for-sale + rental construction is in the pipeline within 1–3 miles? Heavy new supply typically softens prices + rents 12–24 months out; constrained supply supports both.
Investment metrics
- 1% rule
- 0.74% ✗
- Cap rate
- 5.04%
- Cash-on-cash
- -4.49%
- DSCR
- 0.80
- GRM
- 11.2
CMA / ARV
- ARV (median comp)
- $202,003
- List price
- $214,900
- Delta
- 6.38%
- Verdict
- FAIR
- Comps
- 20 within 1.0 mi
Show comp detail 1 sale within ~0.75 mi
| Address | Dist | Beds/Ba | Sqft | Sold | Price | $/sf | Match |
|---|---|---|---|---|---|---|---|
| 566 Hoke Hill Rd | 0.21mi | 3/2.0 (-1) | 1,350 (+0%) | 3mo | $205,000 | $152 | 82 |
Match score weights: distance 35% · size 25% · config 20% · recency 20%. Top-matched comps best support the ARV.
Projected returns pro-forma
10.0% appreciation · 3.0% rent growth · sell at horizon
- IRR
- 21.1%
- Equity multiple
- 2.71×
- Total profit
- $102,726
- Equity at exit
- $193,599
- IRR
- 19.1%
- Equity multiple
- 6.22×
- Total profit
- $313,834
- Equity at exit
- $417,503
Cash invested: $60,172 (down + closing). Projections, not guarantees.
Landlord ↔ Tenant lean methodology
- Overall (STATE)
- 90 Strongly Landlord-Friendly
- State Georgia
- 90 Strongly Landlord-Friendly · R+3
- County
- — inherits STATE
- City
- — inherits STATE
ZIP-level market 30520
- Home prices YoY
- 9.0%
- Active inventory
- 27
- Price-to-rent
- 11.2×
Monthly cashflow live
- Estimated rent
- $1,595 medium interval (Pro) →
- Mortgage (P&I)
- −$1,127
- Tax est. 1.5%
- −$269 /mo · $3,224/yr
- Insurance
- −$90
- HOA
- −$0
- Vacancy / Maint / Mgmt
- −$335
- Net cashflow
- $-225
Break-even live
UW: 25.0% down · 7.5% · 30yr · 1.5% tax · 5.0% vac · 8.0% maint · 8.0% mgmt
Financing live
Cash to close
- Down payment
- $53,725
- Closing costs
- $6,447
- Reserves months
- —
- Total cash needed
- —
Loan-product check · same deal, 3 products live
Conventional
25% down · 7.5% · 30yr
- Down + closing
- —
- Monthly P&I
- —
- Monthly cashflow
- —
- DSCR
- —
- Eligible?
- —
Personal DTI + credit; lowest rate.
DSCR
20% down · 8.5% · 30yr
- Down + closing
- —
- Monthly P&I
- —
- Monthly cashflow
- —
- DSCR
- —
- Eligible?
- —
No personal income docs; deal must DSCR.
Hard money
10% down · 12.0% · 12mo
- Down + closing
- —
- Monthly P&I
- —
- Monthly cashflow
- —
- DSCR
- —
- Eligible?
- —
Short-term bridge; refi at stabilization.
Listing history 24 events
-
2026-06-19days on market $214,900 Active 44 DOM
-
2026-06-18days on market $214,900 Active 43 DOM
-
2026-06-17days on market $214,900 Active 42 DOM
-
2026-06-16days on market $214,900 Active 41 DOM
-
2026-06-15days on market $214,900 Active 40 DOM
-
2026-06-14days on market $214,900 Active 38 DOM
-
2026-06-13days on market $214,900 Active 37 DOM
-
2026-06-10days on market $214,900 Active 35 DOM
-
2026-06-09days on market $214,900 Active 34 DOM
-
2026-06-08days on market $214,900 Active 33 DOM
-
2026-06-07days on market $214,900 Active 32 DOM
-
2026-06-02days on market $214,900 Active 27 DOM
-
2026-06-01days on market $214,900 Active 26 DOM
-
2026-05-31days on market $214,900 Active 25 DOM
-
2026-05-30days on market $214,900 Active 24 DOM
-
2026-05-06$214,900 New 358-char remark
-
2025-11-18soldstatus $166,500
-
2025-10-06historical
-
2025-09-24price $207,500
-
2025-09-10price $208,500
-
2025-08-29status Price Change
-
2025-08-29price $210,000
-
2025-08-22status Under Contract
-
2025-08-06$213,000 New
ⓘ Source: listings_history table (triggers on properties + properties_extension) + one-shot
backfill from property_details.listing_events for pre-trigger history.
Nearby sold comps map
Loading sold comps map…
Walkable amenities ~0.75 mi
Loading nearby amenities…
Taxation est. · year 1
- Rental income
- $19,139
- − Mortgage interest
- −$12,038
- − Property taxes
- −$3,224
- − Insurance
- −$1,074
- − Repairs & maintenance
- −$1,531
- − Management
- −$1,531
- − Depreciation
- −$6,252
- Taxable loss
- −$6,510
- Est. tax savings @ 24.0%
- +$1,563
- After-tax cash flow
- $-1,139/yr
For passive investors: Depreciation is non-cash, so a rental often shows a tax loss while cash-flowing — sheltering income. Rental losses are passive: they offset passive income freely, and up to $25,000/yr can offset ordinary (W-2) income if you actively participate and your MAGI is under $100k (phasing out to $0 by $150k); unused losses carry forward. On sale, claimed depreciation is recaptured at up to 25%, and gains may owe capital-gains tax (a 1031 exchange can defer both). Figures are a year-1 estimate at your 24.0% rate — not tax advice; consult a CPA.
Schools (NCES district)
- District
- Hart County
- NCES district ID
- 1302730
- Math proficiency
- 32% ▼ -6.00%
- Reading proficiency
- 33% ▼ -6.00%
- Median HH income
- $37,494
- Composite
- 27.08/100
- National rank
- #7047
- State rank
- #82 of 174 in GA
Livability — Canon
- Score
- 66/100
- State rank
- #189
- US rank
- #11742
Category grades
Schools grade is shown separately in the Schools card above.
Census & demographics
- Census place
- Canon, GA
- Population (ZIP)
- 4,617
Population outlook (Hart County) Hauer SSP2
- Today (2025)
- 25,855 people
- By 2030
- 25,887 · +0.1%
- By 2040
- 25,627 · -0.9%
- By 2050
- 24,939 · -3.5%
- By 2075
- 23,150 · -10.5%
- By 2100
- 19,492 · -24.6%
Race, ethnicity, and origin ACS 2023
- Neighborhood character
- Predominantly White (85%)
- Race & ethnicity
- White 85% Hispanic / Latino 12% Two or more races 4%
- Hispanic origin (detail)
- Mexican 10%
- Common ancestry
- Slovak 3% Hungarian 1% Portuguese 1%
- Foreign-born
- 3% · Canada
- Languages at home
- 92% English-only · Spanish 8%
Political lean MEDSL · Hart
- 2024 margin
- Solid R (+54.8) · D 22.4% · R 77.2%
- 2008→2024 swing
- -23.1pp toward R · 2008: -31.7pp · 2024: -54.8pp
- All cycles
- 2024: R+54.8 2020: R+49.6 2016: R+46.7 2012: R+38.4 2008: R+31.7
Not yet ingested
- Civics
- —
Market trends
- HPI YoY
- ▲ 29.72%
- Current HPI
- 361.1507
- Rent YoY
- —
- Metro
- —
- State GDP YoY
- ▲ 2.66%
- F500 in state
- 28
Industry mix (Fortune 500 HQ in GA)
| Industry | F500 HQs | Revenue |
|---|---|---|
| Paper / Packaging | 2 | $29B |
|
||
| Retail | 1 | $160B |
|
||
| Transportation / Logistics | 1 | $91B |
|
||
| Airlines | 1 | $62B |
|
||
| Consumer Goods | 1 | $47B |
|
||
| Utilities | 1 | $25B |
|
||
Price history
+0.9% since first listed9 events — show timeline
- 2026-05-06 Listed $214,900 GAMLS
- 2025-11-18 Sold (Public Records) $166,500 Public Records
- 2025-10-06 Listing Removed — GAMLS
- 2025-09-24 Price Changed $207,500 GAMLS
- 2025-09-10 Price Changed $208,500 GAMLS
- 2025-08-29 Relisted — GAMLS
- 2025-08-29 Price Changed $210,000 GAMLS
- 2025-08-22 Pending — GAMLS
- 2025-08-06 Listed $213,000 GAMLS
Property tax history
+0.7%/yrLatest (2025): $424 · +0.7% YoY. Source: county tax records.
Cash-flow waterfall
monthlySold comps — $/sqft
last 12 mo · ≤1 miLoading sold comps…