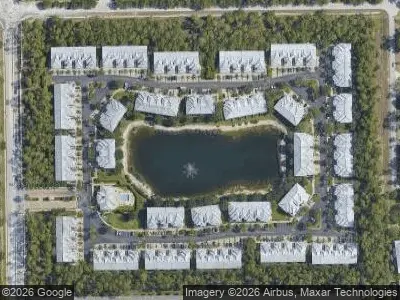
1385 Mariposa Cir · Vineyards, FL
Flood risk 3/10 · Minor
- FEMA flood zone
- X (unshaded)
- Chance of flooding over 30 yrs
- 0.12%
- Est. flood insurance / yr
- $507 – $1,088
Fire risk 1/10 · Minimal
- Est. fire insurance / yr
- $947 – $1,759
Heat risk 10/10 · Severe
- Hot days now (above 107°F)
- 7 days/yr
- Hot days in 30 yrs
- 27 days/yr
Wind risk 10/10 · Severe
- Chance of severe wind over 30 yrs
- 99.0%
Air-quality risk 2/10 · Minimal
- Unhealthy air days now
- 2 days/yr
- Unhealthy air days in 30 yrs
- 2 days/yr
Risk factors via First Street. Map © Google.
Why this score? — see what drove the C grade
The composite is a weighted blend of 9 inputs, each scored 0–100. Each bar is that input's sub-score; the figure is the points it added to the 100-point composite (weight × sub-score).
- Cash flow +25.1/30.0
- DSCR +8.2/10.0
- ARV discount +7.5/15.0
- 1% rule +6.6/10.0
- Schools +5.0/10.0
- Livability +3.2/5.0
- Rent growth +2.7/5.0
- Condition / age +1.0/5.0
- Appreciation +0.0/10.0
$425,000
🖨 Deal sheet (PDF) 📄 Offer letter ✓ Due diligence
Listing remarks
23.000 under air two car garage sold as is. Appointment only does need some repair minor. No realtors please are allowed to show my property. This is for individuals that are looking on their own. Will use a title company should go into sale no realtors not interested. Do not call if you are a realtor. I will just hang up the phone.
Key facts
- Built 2005
- Listed 23 days
Property features AI
Exterior
- Home design: Built in 2005
- Construction: 1985 square feet of living area
- Exterior features: Located in the Urban Estates subdivision
Neighborhood map
What this means for you Summary
Snapshot
- This is a 3-bed/3.0-bath other listed at $425k. Condition is rated poor.
Deal economics
- At list price, monthly cash flow is $941 ($11k/yr) — positive.
- The deal already cash-flows at list — no discount required.
- Meets the 1% rule at list price ($5k rent vs $425k).
- Recommended offer: $419k (1.5% below list) — sets the bar for market timing.
Location & tenants
- Location reads 64/100 on livability (#679 in FL) — a middle-class / working-renter tenant base. Strengths: crime A+, employment A+, housing A-; Watch: health & safety D, amenities F, commute F.
- Collier (suburban): math 60% / reading 56% proficiency, ranked #16 of 73 in FL (top 22%) — acceptable for families but not a draw, mixed tenant base, ~2y average lease.
- Market conditions: Rents flat; 329 active listings in the ZIP; 40 comparable units currently listed for rent nearby; rentals at typical pace (median 22d on market — plan ~3-4 weeks tenant-placement turnaround); solid renter incomes; 3,520 units permitted in Collier County in 2024 (959 in 5+ unit buildings).
- At $4,909/mo this rent would consume 64% of the median local household income ($92k/yr) (locally 780% of renters already pay >50% of income on rent) — very limited rent-growth headroom before tenants either downsize or default.
Forward outlook
- Local home prices are declining (-3.0%/yr); year-one equity from $3k of loan paydown is wiped out by about $13k of value loss. Plan a longer hold.
- Collier County population projected at +30% by 2050 — long-run rental-demand tailwind backs the buy-and-hold thesis.
Negotiation context
- It's been on market 23 days — a 2% lower offer ($419k) is reasonable based on typical stale-listing flexibility.
Risks & watch-outs
- Climate carrying-cost: severe wind risk, 99% chance of damaging wind over 30y; extreme-heat days projected 7→27/yr by 2055 (HVAC capex compounding) — expect insurance premiums to compound above CPI over the hold.
Questions for the listing agent
- Have any recent inspections been done? Can we get a copy of the seller's disclosures and any deferred-maintenance estimates?
- Is there a deadline driving the sale (1031 exchange, divorce, estate, relocation)? That informs how much negotiation room exists.
- What's the average days-on-market for RENTAL listings here right now (not sales)? A rising rental-DOM trend means longer vacancies and softer asking-rent achievability than the comps imply.
- What's the recent tenant-quality profile in this submarket — average credit score on applications, eviction rate, late-payment / NSF rate, and stable-employment percentage? A property-management company in the area should have these aggregated.
- How much new for-sale + rental construction is in the pipeline within 1–3 miles? Heavy new supply typically softens prices + rents 12–24 months out; constrained supply supports both.
Investment metrics
- 1% rule
- 1.16% ✓
- Cap rate
- 8.95%
- Cash-on-cash
- 9.49%
- DSCR
- 1.42
- GRM
- 7.2
CMA / ARV
No comps found within radius.
Projected returns pro-forma
-3.0% appreciation · 0.85% rent growth · sell at horizon
- IRR
- -4.4%
- Equity multiple
- 0.84×
- Total profit
- $-19,266
- Equity at exit
- $63,369
- IRR
- 2.6%
- Equity multiple
- 1.17×
- Total profit
- $19,827
- Equity at exit
- $36,746
Cash invested: $119,000 (down + closing). Projections, not guarantees.
Landlord ↔ Tenant lean methodology
- Overall (STATE)
- 87 Strongly Landlord-Friendly
- State Florida
- 87 Strongly Landlord-Friendly · R+3
- County
- — inherits STATE
- City
- — inherits STATE
ZIP-level market 34105
- Home prices YoY
- -30.5%
- Rents YoY
- 0.8%
- Active inventory
- 329
- Price-to-rent
- 7.2×
Monthly cashflow live
- Estimated rent
- $4,909 high interval (Pro) →
- Mortgage (P&I)
- −$2,229
- Tax est. 1.5%
- −$531 /mo · $6,375/yr
- Insurance
- −$177
- HOA
- −$0
- Vacancy / Maint / Mgmt
- −$1,031
- Net cashflow
- $941
Break-even live
Sensitivity live
| Price | -10% $1,235 | -5% $1,088 | +0% $941 | +5% $794 | +10% $647 |
|---|---|---|---|---|---|
| Rent | -10% $553 | -5% $747 | +0% $941 | +5% $1,135 | +10% $1,329 |
| Rate | -1.0pp $1,155 | -0.5pp $1,049 | base $941 | +0.5pp $831 | +1.0pp $719 |
UW: 25.0% down · 7.5% · 30yr · 1.5% tax · 5.0% vac · 8.0% maint · 8.0% mgmt
Financing live
Cash to close
- Down payment
- $106,250
- Closing costs
- $12,750
- Reserves months
- —
- Total cash needed
- —
Loan-product check · same deal, 3 products live
Conventional
25% down · 7.5% · 30yr
- Down + closing
- —
- Monthly P&I
- —
- Monthly cashflow
- —
- DSCR
- —
- Eligible?
- —
Personal DTI + credit; lowest rate.
DSCR
20% down · 8.5% · 30yr
- Down + closing
- —
- Monthly P&I
- —
- Monthly cashflow
- —
- DSCR
- —
- Eligible?
- —
No personal income docs; deal must DSCR.
Hard money
10% down · 12.0% · 12mo
- Down + closing
- —
- Monthly P&I
- —
- Monthly cashflow
- —
- DSCR
- —
- Eligible?
- —
Short-term bridge; refi at stabilization.
Rent comps 40 comps
| Address | Beds | Baths | Sqft | Rent | $/sqft | DOM | Units | Dist |
|---|---|---|---|---|---|---|---|---|
| 1299 Verde Dr Unit 1503 Naples, FL | 3.0 | 2.0 | 1744 | $4,200 | $2.41 | 14d | 1 | 0.16mi |
| 1303 Verde Dr Unit 1603 Naples, FL | 3.0 | 2.0 | 1877 | $2,500 | $1.33 | 14d | 1 | 0.18mi |
| 1256 Carpazi Ct Unit 502 Naples, FL | 3.0 | 2.0 | 1744 | $2,495 | $1.43 | 14d | 1 | 0.21mi |
| 1256 Carpazi Ct #502 Naples, FL | 3.0 | 2.0 | 1744 | $2,495 | $1.43 | 24d | 1 | 0.21mi |
| 836 Hampton Cir #171 Naples, FL | 3.0 | 2.5 | 1580 | $5,000 | $3.16 | 24d | 1 | 0.27mi |
| 836 Hampton Cir #171 Naples, FL | 3.0 | 2.5 | 1580 | $5,000 | $3.16 | 21d | 1 | 0.27mi |
| 1205 Reserve Way #302 Naples, FL | 3.0 | 2.0 | 1239 | $2,300 | $1.86 | 14d | 1 | 0.30mi |
| 1105 Reserve Ct #307 Naples, FL | 3.0 | 2.0 | 1239 | $1,995 | $1.61 | 14d | 1 | 0.33mi |
| 12839 Carrington Cir Unit 8-102 Naples, FL | 3.0 | 2.0 | 2063 | $6,500 | $3.15 | 24d | 1 | 0.51mi |
| 12885 Brynwood Way Naples, FL | 3.0 | 3.0 | 2489 | $10,000 | $4.02 | 24d | 1 | 0.51mi |
| 13078 Pembroke Dr Naples, FL | 3.0 | 2.5 | 2024 | $6,500 | $3.21 | 24d | 1 | 0.53mi |
| 12914 Brynwood Preserve Ln Naples, FL | 2.0 | 2.0 | 1720 | $7,000 | $4.07 | 24d | 1 | 0.55mi |
| 6525 Monterey Pt Unit 203 Naples, FL | 3.0 | 2.5 | 2288 | $5,250 | $2.29 | 14d | 1 | 0.55mi |
| 12902 Brynwood Preserve Ln Naples, FL | 3.0 | 3.0 | 2100 | $7,500 | $3.57 | 24d | 1 | 0.58mi |
| 6559 Monterey Pt Naples, FL | 3.0 | 2.0 | 2300 | $9,000 | $3.91 | 21d | 1 | 0.59mi |
| 6548 Monterey Pt Unit 204 Naples, FL | 3.0 | 2.5 | 2288 | $6,000 | $2.62 | 14d | 1 | 0.61mi |
| 12832 Brynwood Way Naples, FL | 3.0 | 2.0 | 1714 | $5,250 | $3.06 | 14d | 1 | 0.63mi |
| 12667 Biscayne Ct Naples, FL | 4.0 | 3.5 | 2600 | $8,500 | $3.27 | 24d | 1 | 0.65mi |
| 6542 Marbella Dr Naples, FL | 3.0 | 2.5 | 2144 | $6,250 | $2.92 | 24d | 1 | 0.70mi |
| 6670 Marbella Ln Naples, FL | 3.0 | 3.0 | 2439 | $8,400 | $3.44 | 24d | 1 | 0.72mi |
| 3105 La Costa Cir Naples, FL | 1.0–3.0 | 1.0–2.0 | 1050 | $2,235 | $2.13 | 14d | 20 | 0.94mi |
| 104 Siena Way #1407 Naples, FL | 2.0 | 2.0 | 1450 | $7,000 | $4.83 | 24d | 1 | 0.99mi |
| 106 Siena Way #1508 Naples, FL | 2.0 | 2.0 | 1414 | $4,500 | $3.18 | 24d | 1 | 1.00mi |
| 103 Tuscana Ct #1107 Naples, FL | 2.0 | 2.0 | 1412 | $5,000 | $3.54 | 24d | 1 | 1.03mi |
| 155 Vintage Cir #103 Naples, FL | 2.0 | 2.0 | 1500 | $5,000 | $3.33 | 14d | 1 | 1.05mi |
| 172 Vintage Cir #202 Naples, FL | 3.0 | 2.0 | 1774 | $5,195 | $2.93 | 14d | 1 | 1.06mi |
| 102 Tuscana Ct #901 Naples, FL | 2.0 | 2.0 | 1631 | $2,300 | $1.41 | 24d | 1 | 1.07mi |
| 6025 Chardonnay Ln Unit 1Unit 102 Naples, FL | 2.0 | 2.0 | 1414 | $2,195 | $1.55 | 24d | 1 | 1.08mi |
| 230 Vintage Cir Unit A-404 Naples, FL | 2.0 | 2.0 | 1290 | $5,000 | $3.88 | 14d | 1 | 1.09mi |
| 3099 Lancaster Dr Unit 7-701 Naples, FL | 2.0 | 2.0 | 2160 | $10,000 | $4.63 | 24d | 1 | 1.09mi |
| 210 Vintage Cir Unit C401 Naples, FL | 3.0 | 2.0 | 1520 | $6,500 | $4.28 | 14d | 1 | 1.13mi |
| 200 Vintage Cir Unit D304 Naples, FL | 3.0 | 2.0 | 1492 | $2,800 | $1.88 | 14d | 1 | 1.15mi |
| 3255 Tamara Dr #4 Naples, FL | 3.0 | 2.5 | 1437 | $2,500 | $1.74 | 14d | 1 | 1.16mi |
| 3250 Cypress Glen Way Naples, FL | 2.0 | 2.0 | 1242 | $3,300 | $2.66 | 21d | 3 | 1.19mi |
| 152 Napa Ridge Way Naples, FL | 3.0 | 2.0 | 1775 | $7,000 | $3.94 | 24d | 1 | 1.21mi |
| 3268 Amanda Ln #3 Naples, FL | 3.0 | 2.5 | 1437 | $2,350 | $1.64 | 14d | 1 | 1.21mi |
| 224 Via Perignon Unit 5-4 Naples, FL | 2.0 | 2.5 | 2085 | $6,000 | $2.88 | 21d | 1 | 1.23mi |
| 116 Fountain Cir Naples, FL | 3.0 | 2.0 | 1561 | $4,500 | $2.88 | 24d | 1 | 1.25mi |
| 89 Silver Oaks Cir #5103 Naples, FL | 2.0 | 2.0 | 1373 | $2,800 | $2.04 | 21d | 1 | 1.26mi |
| 3304 Lisa Ln Unit 102 Naples, FL | 2.0 | 2.5 | 1272 | $2,350 | $1.85 | 14d | 1 | 1.27mi |
Listing history 13 events
-
2026-06-18days on market $425,000 Active 23 DOM
-
2026-06-17days on market $425,000 Active 22 DOM
-
2026-06-16days on market $425,000 Active 21 DOM
-
2026-06-15days on market $425,000 Active 20 DOM
-
2026-06-10days on market $425,000 Active 15 DOM
-
2026-06-09days on market $425,000 Active 14 DOM
-
2026-06-08days on market $425,000 Active 13 DOM
-
2026-06-07days on market $425,000 Active 12 DOM
-
2026-06-02days on market $425,000 Active 7 DOM
-
2026-06-01days on market $425,000 Active 6 DOM
-
2026-05-31days on market $425,000 Active 5 DOM
-
2026-05-30days on market $425,000 Active 4 DOM
-
2026-05-26$425,000 Active
ⓘ Source: listings_history table (triggers on properties + properties_extension) + one-shot
backfill from property_details.listing_events for pre-trigger history.
Climate risk First Street
- Flood 3/10 Moderate FEMA zone X (unshaded) · 12% chance over 30 yrs
- Wildfire 1/10 Low
- Heat 10/10 Extreme 7 d/yr ≥107°F today · 27 d/yr by 30 yrs out
- Wind 10/10 Extreme 99% chance of damaging wind over 30 yrs
- Air quality 2/10 Low 2 unhealthy d/yr today · 2 by 30 yrs out
Nearby sold comps map
Loading sold comps map…
Walkable amenities ~0.75 mi
Loading nearby amenities…
Taxation est. · year 1
- Rental income
- $58,906
- − Mortgage interest
- −$23,807
- − Property taxes
- −$6,375
- − Insurance
- −$2,125
- − Repairs & maintenance
- −$4,712
- − Management
- −$4,712
- − Depreciation
- −$12,364
- Taxable income
- $4,810
- Est. tax owed @ 24.0%
- −$1,155
- After-tax cash flow
- $10,136/yr
For passive investors: Depreciation is non-cash, so a rental often shows a tax loss while cash-flowing — sheltering income. Rental losses are passive: they offset passive income freely, and up to $25,000/yr can offset ordinary (W-2) income if you actively participate and your MAGI is under $100k (phasing out to $0 by $150k); unused losses carry forward. On sale, claimed depreciation is recaptured at up to 25%, and gains may owe capital-gains tax (a 1031 exchange can defer both). Figures are a year-1 estimate at your 24.0% rate — not tax advice; consult a CPA.
Condition & rehab AI · 2 photos
This property requires extensive repairs and updates to bring it up to a livable condition. Significant investment is needed to improve the roof, exterior, flooring, and interior, as well as updating the HVAC system and landscaping. The home's current condition is poor, and substantial work is required to increase its resale and rental value.
Repairs flagged
- Major roof — No visible roof in the satellite image.
- Major exterior — No visible exterior in the satellite image.
- Major flooring — No visible flooring in the satellite image.
- Major interior walls/paint — No visible interior walls/paint in the satellite image.
- Major bathrooms — No visible bathrooms in the satellite image.
- Major kitchen — No visible kitchen in the satellite image.
- Major systems — No visible systems in the satellite image.
- Major HVAC/mechanicals — No visible HVAC/mechanicals in the satellite image.
- Major landscaping/curb appeal — No visible landscaping/curb appeal in the satellite image.
Value-add opportunities
- Both roof replacement — A new roof would significantly improve the home's appearance and functionality.
- Both exterior painting/staining — A fresh coat of paint or stain would enhance curb appeal and value.
- Both flooring replacement — New flooring would improve the home's aesthetic and functionality.
- Both interior painting — Fresh paint would improve the home's appearance and value.
- Both bathroom updates — Modernizing bathrooms would improve functionality and value.
- Both kitchen updates — Updating the kitchen would improve functionality and value.
- Both HVAC system replacement — A new HVAC system would improve comfort and energy efficiency.
- Both landscaping — Well-maintained landscaping would enhance curb appeal and value.
Renovation cost estimate screening
| Repair item | Severity | Est. cost |
|---|---|---|
| roof · No visible roof in the satellite image. | Major | $15,000–50,000 |
| exterior · No visible exterior in the satellite image. | Major | $15,000–50,000 |
| flooring · No visible flooring in the satellite image. | Major | $15,000–50,000 |
| interior walls/paint · No visible interior walls/paint in the satellite image. | Major | $15,000–50,000 |
| bathrooms · No visible bathrooms in the satellite image. | Major | $15,000–50,000 |
| kitchen · No visible kitchen in the satellite image. | Major | $15,000–50,000 |
| systems · No visible systems in the satellite image. | Major | $15,000–50,000 |
| HVAC/mechanicals · No visible HVAC/mechanicals in the satellite image. | Major | $15,000–50,000 |
| landscaping/curb appeal · No visible landscaping/curb appeal in the satellite image. | Major | $15,000–50,000 |
| Total estimated repair cost · 9 items | $135,000–450,000 |
Value-add ROI direction
- Both roof replacement — A new roof would significantly improve the home's appearance and functionality. ↑
- Both exterior painting/staining — A fresh coat of paint or stain would enhance curb appeal and value. ↑
- Both flooring replacement — New flooring would improve the home's aesthetic and functionality. ↑
- Both interior painting — Fresh paint would improve the home's appearance and value. ↑
- Both bathroom updates — Modernizing bathrooms would improve functionality and value. ↑
- Both kitchen updates — Updating the kitchen would improve functionality and value. ↑
- Both HVAC system replacement — A new HVAC system would improve comfort and energy efficiency. ↑
- Both landscaping — Well-maintained landscaping would enhance curb appeal and value. ↑
ⓘ Cost ranges are severity-bucket heuristics (US national rule-of-thumb). Get contractor quotes + a written scope before underwriting a rehab budget.
Schools (NCES district)
- District
- Collier
- NCES district ID
- 1200330
- Math proficiency
- 60% ▼ -4.00%
- Reading proficiency
- 56% ▼ -2.00%
- Median HH income
- $58,275
- Composite
- 50.23/100
- National rank
- #1892
- State rank
- #16 of 73 in FL
Livability — Vineyards
- Score
- 64/100
- State rank
- #679
- US rank
- #14101
Category grades
Schools grade is shown separately in the Schools card above.
Census & demographics
- County
- Collier County · 396,295 people
- Metro
- Naples-Marco Island, FL
- Population (ZIP)
- 15,441
- Household income
- $92,214
- Rent vs Own
- Severe rent burden
- 780.0
Population outlook (Collier County) Hauer SSP2
- Today (2025)
- 420,858 people
- By 2030
- 450,054 · +6.9%
- By 2040
- 502,232 · +19.3%
- By 2050
- 544,932 · +29.5%
- By 2075
- 627,203 · +49.0%
- By 2100
- 659,015 · +56.6%
Race, ethnicity, and origin ACS 2023
- Neighborhood character
- Predominantly White (79%)
- Race & ethnicity
- White 79% Hispanic / Latino 14% Two or more races 7% Asian 5%
- Hispanic origin (detail)
- Mexican 3% Puerto Rican 1% Cuban 3% Salvadoran 1%
- Common ancestry
- Romanian 3% Lithuanian 3% Italian 3%
- Foreign-born
- 22% · Canada, China, Jamaica
- Languages at home
- 77% English-only · Spanish 11% Other Indo-European 3% Russian/Polish/Slavic 3%
Political lean MEDSL · Collier
- 2024 margin
- Solid R (+33.1) · D 33.1% · R 66.2%
- 2008→2024 swing
- -10.6pp toward R · 2008: -22.5pp · 2024: -33.1pp
- All cycles
- 2024: R+33.1 2020: R+24.7 2016: R+26.0 2012: R+30.1 2008: R+22.5
Not yet ingested
- Civics
- —
Market trends
- HPI YoY
- ▼ -124.65%
- Current HPI
- 283.9084
- Rent YoY
- ▲ 0.85%
- Metro
- Naples-Marco Island, FL
- State GDP YoY
- ▲ 3.28%
- F500 in state
- 36
Industry mix (Fortune 500 HQ in FL)
| Industry | F500 HQs | Revenue |
|---|---|---|
| Industrial Technology | 2 | $29B |
|
||
| Insurance | 2 | $17B |
|
||
| Retail | 1 | $60B |
|
||
| Technology Distribution | 1 | $58B |
|
||
| Homebuilding | 1 | $35B |
|
||
| Technology Manufacturing | 1 | $35B |
|
||
Price history
1 event — show timeline
- 2026-05-26 Listed $425,000 FSBO.com
Cash-flow waterfall
monthlySold comps — $/sqft
last 12 mo · ≤1 miLoading sold comps…