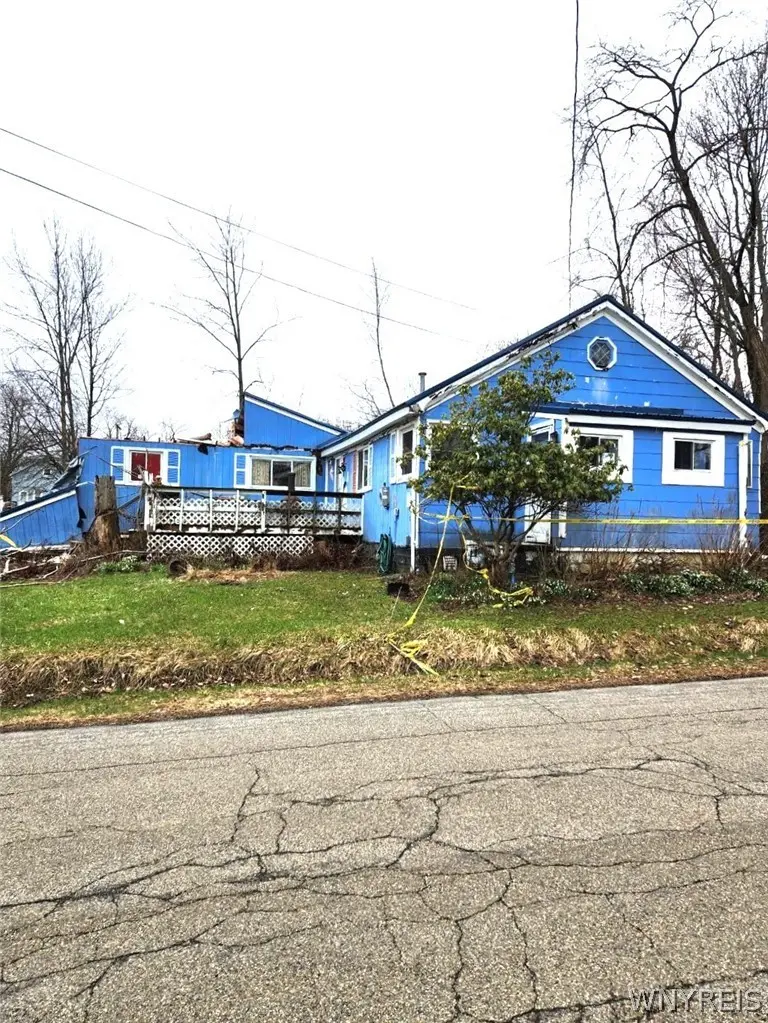
155 Argyle Ave · Lake Erie Beach, NY
Flood risk 1/10 · Minimal
- FEMA flood zone
- X (unshaded)
- Chance of flooding over 30 yrs
- 0.0%
- Est. flood insurance / yr
- $507 – $1,088
Fire risk 3/10 · Minor
- Est. fire insurance / yr
- $691 – $1,283
Heat risk 2/10 · Minimal
- Hot days now (above 92°F)
- 7 days/yr
- Hot days in 30 yrs
- 16 days/yr
Wind risk 1/10 · Minimal
- Chance of severe wind over 30 yrs
- —
Air-quality risk 2/10 · Minimal
- Unhealthy air days now
- 2 days/yr
- Unhealthy air days in 30 yrs
- 2 days/yr
Risk factors via First Street. Map © Google.
Why this score? — see what drove the D grade
The composite is a weighted blend of 9 inputs, each scored 0–100. Each bar is that input's sub-score; the figure is the points it added to the 100-point composite (weight × sub-score).
- Cash flow +15.0/30.0
- ARV discount +7.5/15.0
- 1% rule +5.0/10.0
- DSCR +5.0/10.0
- Schools +4.1/10.0
- Livability +3.1/5.0
- Rent growth +2.5/5.0
- Condition / age +2.5/5.0
- Appreciation +0.0/10.0
$30,000
🖨 Deal sheet (PDF) 📄 Offer letter ✓ Due diligence
Listing remarks
Rare opportunity for flippers, rehabbers, or buyers with a vision. Drive-by only. This property will be sold sight unseen with no interior access. Sold "As-Is, Where-Is". Buyer assumes all responsibility for cleanout and repairs. This property is currently 100% condemned prohibiting occupancy due to safety concerns. While the structure is in disrepair, there is potential for rehabilitation depending on the results of a professional assessment. Specifically, a structural engineer must evaluate the right rear corner of the house (facing from the front) to determine the integrity of the foundation and framing. If the engineer deems the structural damage repairable, the building insp
Key facts
- 0.37 acre lot
- Built 1949
- Listed 17 days
Neighborhood map
What this means for you Summary
Snapshot
- This is a 3-bed/1.0-bath single-family listed at $30k.
Deal economics
- At list price, monthly cash flow is $1k ($13k/yr) — positive.
- The deal already cash-flows at list — no discount required.
- Meets the 1% rule at list price ($2k rent vs $30k).
- Recommended offer: $30k (1.5% below list) — sets the bar for market timing.
- Cap rate 50.1% vs local median 2.8% in Lake Erie Beach — top-decile yield for the area; either an underpriced asset or a hidden risk that comps aren't pricing in. Stress-test before assuming the spread holds.
Location & tenants
- Location reads 62/100 on livability (#836 in NY) — a middle-class / working-renter tenant base. Strengths: cost of living A+, housing A+, crime B; Watch: schools D-, amenities F, commute F.
- Evans-Brant Central School District (Lake Shore) (suburban): math 43% / reading 51% proficiency, ranked #424 of 590 in NY (top 72%) — families likely to look elsewhere, expect single-tenant / working-renter base with shorter leases.
- Market conditions: 102 active listings in the ZIP; 1 comparable units currently listed for rent nearby; 1,244 units permitted in Erie County in 2024 (563 in 5+ unit buildings).
Forward outlook
- Local home prices are declining (-3.0%/yr); year-one equity from $207 of loan paydown is wiped out by about $900 of value loss. Plan a longer hold.
- At projected returns (-3.0% appreciation + 3.0% rent growth), your $8k cash investment doubles in ~1 year — after that, you're playing with house money.
Negotiation context
- It's been on market 17 days — a 2% lower offer ($30k) is reasonable based on typical stale-listing flexibility.
- Current owner paid $250; list at $30k implies a 11900% gain — meaningful room to come down on a strong offer.
Risks & watch-outs
- Watch-outs: built in 1949 — expect roof / HVAC / electrical / plumbing capex.
Questions for the listing agent
- Built in 1949 — when were the roof, HVAC, electrical panel, plumbing, and water heater last replaced?
- Is there a deadline driving the sale (1031 exchange, divorce, estate, relocation)? That informs how much negotiation room exists.
- Schools are D-rated, which usually means shorter tenancies and higher turnover. Who's the typical renter profile here, and what's been the actual vacancy rate?
- The area grade is low — what's the realistic commute time and amenity access for the typical tenant pool here? Any planned neighborhood developments (good or bad) we should know about?
- What's the average days-on-market for RENTAL listings here right now (not sales)? A rising rental-DOM trend means longer vacancies and softer asking-rent achievability than the comps imply.
- What's the recent tenant-quality profile in this submarket — average credit score on applications, eviction rate, late-payment / NSF rate, and stable-employment percentage? A property-management company in the area should have these aggregated.
- How much new for-sale + rental construction is in the pipeline within 1–3 miles? Heavy new supply typically softens prices + rents 12–24 months out; constrained supply supports both.
Investment metrics
- 1% rule
- 5.50% ✓
- Cap rate
- 50.14%
- Cash-on-cash
- 156.60%
- DSCR
- 7.97
- GRM
- 1.5
CMA / ARV
- ARV (on-the-fly)
- $203,136
- Comps found
- 10
Show comp detail 10 sales within ~0.75 mi
| Address | Dist | Beds/Ba | Sqft | Sold | Price | $/sf | Match |
|---|---|---|---|---|---|---|---|
| 163 Rosewood Ave | 0.05mi | 3/1.0 | 1,113 (+1%) | 11mo | $82,500 | $74 | 87 |
| 147 Argyle Ave | 0.04mi | 4/1.0 (+1) | 1,021 (-8%) | 1mo | $230,000 | $225 | 80 |
| 255 Kennedy Ave | 0.56mi | 3/1.0 | 1,030 (-7%) | 5mo | $190,000 | $184 | 58 |
| 9815 Lake Shore Rd | 0.11mi | 3/1.0 | 1,248 (+13%) | 20mo | $72,500 | $58 | 56 |
| 64 Summerdale Rd | 0.35mi | 3/1.5 | 1,032 (-6%) | 21mo | $325,000 | $315 | 53 |
| 200 Porter Ave | 0.23mi | 4/1.0 (+1) | 1,239 (+12%) | 15mo | $52,500 | $42 | 51 |
| 171 Humboldt Ave | 0.07mi | 2/1.0 (-1) | 960 (-13%) | 22mo | $45,000 | $47 | 51 |
| 9690 Oak Grove Dr | 0.27mi | 2/2.0 (-1) | 1,200 (+9%) | 22mo | $365,000 | $304 | 45 |
| 9816 Shorecliff Rd | 0.44mi | 2/1.0 (-1) | 1,198 (+8%) | 19mo | $178,516 | $149 | 44 |
| 30 South Ln | 0.55mi | 3/1.5 | 1,248 (+13%) | 16mo | $250,000 | $200 | 37 |
Match score weights: distance 35% · size 25% · config 20% · recency 20%. Top-matched comps best support the ARV.
Projected returns pro-forma
-3.0% appreciation · 3.0% rent growth · sell at horizon
- IRR
- —
- Equity multiple
- 8.74×
- Total profit
- $64,980
- Equity at exit
- $4,473
- IRR
- —
- Equity multiple
- 18.45×
- Total profit
- $146,584
- Equity at exit
- $2,594
Cash invested: $8,400 (down + closing). Projections, not guarantees.
Landlord ↔ Tenant lean methodology
- Overall (STATE)
- 15 Strongly Tenant-Friendly
- State New York
- 15 Strongly Tenant-Friendly · D+10
- County
- — inherits STATE
- City
- — inherits STATE
ZIP-level market 14006
- Home prices YoY
- -16.8%
- Active inventory
- 102
- Price-to-rent
- 1.5×
Monthly cashflow live
- Estimated rent
- $1,650 medium interval (Pro) →
- Mortgage (P&I)
- −$157
- Tax est. 1.5%
- −$38 /mo · $450/yr
- Insurance
- −$12
- HOA
- −$0
- Vacancy / Maint / Mgmt
- −$346
- Net cashflow
- $1,096
Break-even live
Sensitivity live
| Price | -10% $1,117 | -5% $1,107 | +0% $1,096 | +5% $1,086 | +10% $1,075 |
|---|---|---|---|---|---|
| Rent | -10% $966 | -5% $1,031 | +0% $1,096 | +5% $1,161 | +10% $1,227 |
| Rate | -1.0pp $1,111 | -0.5pp $1,104 | base $1,096 | +0.5pp $1,088 | +1.0pp $1,080 |
UW: 25.0% down · 7.5% · 30yr · 1.5% tax · 5.0% vac · 8.0% maint · 8.0% mgmt
Financing live
Cash to close
- Down payment
- $7,500
- Closing costs
- $900
- Reserves months
- —
- Total cash needed
- —
Loan-product check · same deal, 3 products live
Conventional
25% down · 7.5% · 30yr
- Down + closing
- —
- Monthly P&I
- —
- Monthly cashflow
- —
- DSCR
- —
- Eligible?
- —
Personal DTI + credit; lowest rate.
DSCR
20% down · 8.5% · 30yr
- Down + closing
- —
- Monthly P&I
- —
- Monthly cashflow
- —
- DSCR
- —
- Eligible?
- —
No personal income docs; deal must DSCR.
Hard money
10% down · 12.0% · 12mo
- Down + closing
- —
- Monthly P&I
- —
- Monthly cashflow
- —
- DSCR
- —
- Eligible?
- —
Short-term bridge; refi at stabilization.
Rent comps 1 comps
| Address | Beds | Baths | Sqft | Rent | $/sqft | DOM | Units | Dist |
|---|---|---|---|---|---|---|---|---|
| 9563 Oakland St Angola, NY | 3.0 | 1.0 | 1352 | $1,650 | $1.22 | 44d | 1 | 0.68mi |
Listing history 3 events
-
2026-04-19status Pending
-
2026-04-01$30,000 Active
-
2000-06-12soldstatus $250
ⓘ Source: listings_history table (triggers on properties + properties_extension) + one-shot
backfill from property_details.listing_events for pre-trigger history.
Climate risk First Street
- Flood 1/10 Low FEMA zone X (unshaded) · 0% chance over 30 yrs
- Wildfire 3/10 Moderate
- Heat 2/10 Low 7 d/yr ≥92°F today · 16 d/yr by 30 yrs out
- Wind 1/10 Low
- Air quality 2/10 Low 2 unhealthy d/yr today · 2 by 30 yrs out
Nearby sold comps map
Loading sold comps map…
Walkable amenities ~0.75 mi
Loading nearby amenities…
Taxation est. · year 1
- Rental income
- $19,800
- − Mortgage interest
- −$1,680
- − Property taxes
- −$450
- − Insurance
- −$150
- − Repairs & maintenance
- −$1,584
- − Management
- −$1,584
- − Depreciation
- −$873
- Taxable income
- $13,479
- Est. tax owed @ 24.0%
- −$3,235
- After-tax cash flow
- $9,919/yr
For passive investors: Depreciation is non-cash, so a rental often shows a tax loss while cash-flowing — sheltering income. Rental losses are passive: they offset passive income freely, and up to $25,000/yr can offset ordinary (W-2) income if you actively participate and your MAGI is under $100k (phasing out to $0 by $150k); unused losses carry forward. On sale, claimed depreciation is recaptured at up to 25%, and gains may owe capital-gains tax (a 1031 exchange can defer both). Figures are a year-1 estimate at your 24.0% rate — not tax advice; consult a CPA.
Schools (NCES district)
- District
- Evans-Brant Central School District (Lake Shore)
- NCES district ID
- 3616560
- Math proficiency
- 43% ▼ -9.00%
- Reading proficiency
- 51% ▲ 6.00%
- Median HH income
- $56,433
- Composite
- 40.89/100
- National rank
- #3619
- State rank
- #424 of 590 in NY
Livability — Lake Erie Beach
- Score
- 62/100
- State rank
- #836
- US rank
- #16262
Category grades
Schools grade is shown separately in the Schools card above.
Census & demographics
- Census place
- Lake Erie Beach, NY
- Population (ZIP)
- 9,354
Population outlook (Erie County) Hauer SSP2
- Today (2025)
- 933,037 people
- By 2030
- 935,181 · +0.2%
- By 2040
- 928,531 · -0.5%
- By 2050
- 905,725 · -2.9%
- By 2075
- 834,037 · -10.6%
- By 2100
- 708,033 · -24.1%
Race, ethnicity, and origin ACS 2023
- Neighborhood character
- Predominantly White (92%)
- Race & ethnicity
- White 92% Two or more races 3% Black 2% Asian 1% Hispanic / Latino 1%
- Common ancestry
- Romanian 16% Italian 4% Lithuanian 2%
- Foreign-born
- 3% · Canada, China
- Languages at home
- 96% English-only · French/Haitian/Cajun 1% Spanish 1% Other Asian/Pacific 1%
Political lean MEDSL · Erie
- 2024 margin
- Lean D (+9.7) · D 54.8% · R 45.2%
- 2008→2024 swing
- -7.9pp toward R · 2008: 17.5pp · 2024: 9.7pp
- All cycles
- 2024: D+9.7 2020: D+14.7 2016: D+4.8 2012: D+15.6 2008: D+17.5
Not yet ingested
- Civics
- —
Market trends
- HPI YoY
- ▼ -80.95%
- Current HPI
- 401.7461
- Rent YoY
- —
- Metro
- —
- State GDP YoY
- ▲ 2.60%
- F500 in state
- 92
Industry mix (Fortune 500 HQ in NY)
| Industry | F500 HQs | Revenue |
|---|---|---|
| Financial Services | 10 | $950B |
|
||
| Consumer Goods | 9 | $162B |
|
||
| Insurance | 4 | $225B |
|
||
| Telecommunications | 2 | $144B |
|
||
| Pharmaceuticals | 2 | $112B |
|
||
| Media / Entertainment | 2 | $69B |
|
||
Price history
3 events — show timeline
- 2026-04-19 Pending — WNYREIS
- 2026-04-01 Listed $30,000 WNYREIS
- 2000-06-12 Sold (Public Records) $250 Public Records
Property tax history
+3.4%/yrLatest (2025): $3,695 · +1.1% YoY. Source: county tax records.
Cash-flow waterfall
monthlySold comps — $/sqft
last 12 mo · ≤1 miLoading sold comps…