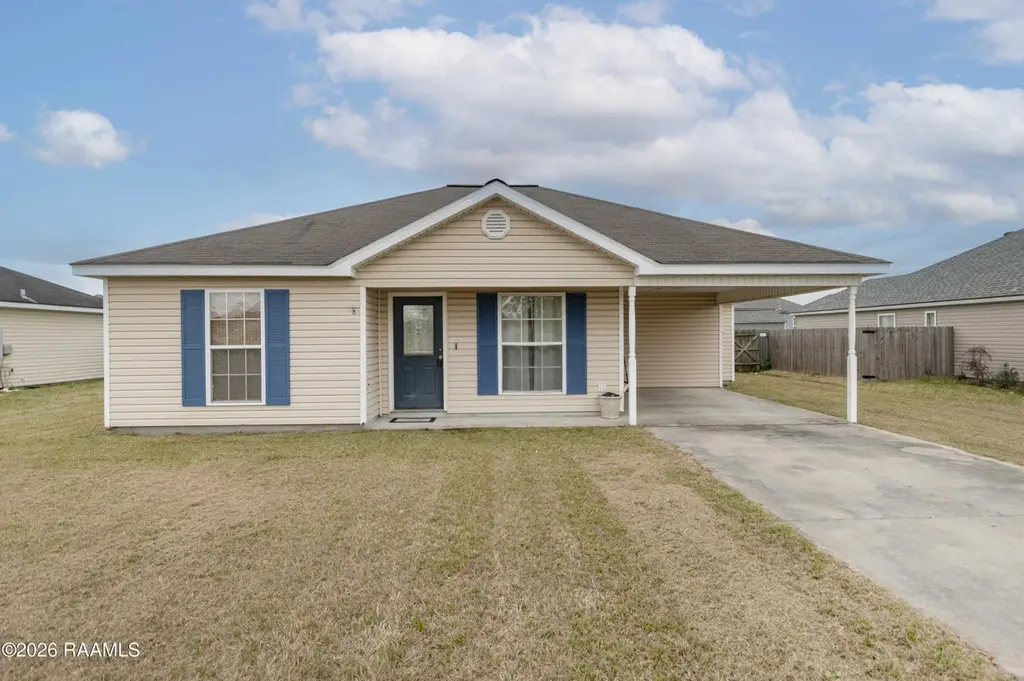
1049 Gary Dr · Breaux Bridge, LA
Flood risk 1/10 · Minimal
- FEMA flood zone
- X
- Chance of flooding over 30 yrs
- 0.0%
- Est. flood insurance / yr
- $507 – $1,088
Fire risk 1/10 · Minimal
- Est. fire insurance / yr
- $1,269 – $2,357
Heat risk 9/10 · Severe
- Hot days now (above 109°F)
- 7 days/yr
- Hot days in 30 yrs
- 20 days/yr
Wind risk 9/10 · Severe
- Chance of severe wind over 30 yrs
- 99.0%
Air-quality risk 2/10 · Minimal
- Unhealthy air days now
- 1 days/yr
- Unhealthy air days in 30 yrs
- 1 days/yr
Risk factors via First Street. Map © Google.
Why this score? — see what drove the D+ grade
The composite is a weighted blend of 9 inputs, each scored 0–100. Each bar is that input's sub-score; the figure is the points it added to the 100-point composite (weight × sub-score).
- Cash flow +19.9/30.0
- ARV discount +7.6/15.0
- DSCR +6.3/10.0
- 1% rule +4.9/10.0
- Livability +3.1/5.0
- Rent growth +2.5/5.0
- Condition / age +2.5/5.0
- Schools +2.3/10.0
- Appreciation +0.0/10.0
$164,900
🖨 Deal sheet 📄 Offer letter ✓ Due diligence
Listing remarks
Located within the city limits of Breaux Bridge, this charming 3 bed 2 bath home offers the perfect blend of comfort, convivence, and small-town charm. With a functional layout designed for everyday living, the home features a welcoming living area, a well-appointed kitchen with ample cabinet space, and dining area for the family or entertaining guests. The spacious primary suite includes a private bath, while the additional bedrooms provide flexibility. Outside, enjoy a manageable yard with room to relax, garden, or host weekend gatherings. Situated just minutes from locals schools, shopping, dining, and the heart of the historic Breaux Bridge, this property offers easy access to everythin
Key facts
- Easy access
- Manageable yard
- 8,400 sq ft lot
Tags
Neighborhood map
What this means for you Summary
Snapshot
- This is a 3-bed/2.0-bath single-family listed at $165k.
Deal economics
- At list price, monthly cash flow is $198 ($2k/yr) — positive.
- The deal already cash-flows at list — no discount required.
- To meet the 1% rule (rent ≥ 1% of price), the offer needs to be $163k (1.1% below list).
- Recommended offer: $160k (3.0% below list) — sets the bar for market timing.
- Cap rate 7.7% vs local median 3.4% in Breaux Bridge — top-decile yield for the area; either an underpriced asset or a hidden risk that comps aren't pricing in. Stress-test before assuming the spread holds.
Location & tenants
- Location reads 62/100 on livability (#210 in LA) — a middle-class / working-renter tenant base. Strengths: cost of living A+, health & safety B+; Watch: crime F, amenities F, commute F.
- St. Martin Parish (rural): math 23% / reading 32% proficiency, ranked #49 of 98 in LA (top 50%) — low school quality limits family demand, transient renter base, plan for 1-2y turnover; 68% free/reduced lunch — lower-income household profile, screen leases tightly.
- Zoned schools: Breaux Bridge Primary School (571 students, 80% FRL); Breaux Bridge Junior High School (math 12% / reading 22%, grade F, #174 of 218 statewide, top 81%, 397 students, 76% FRL); Breaux Bridge High School (math 22% / reading 27%, grade F, #153 of 265 statewide, top 62%, 851 students, 62% FRL) — zoned schools at 73% FRL track the district average.
- Market conditions: 276 active listings in the ZIP; 3 comparable units currently listed for rent nearby; rentals lingering (median 44d on market — plan ~5-8 weeks vacancy on turnover, expect pricing pressure); 67% of comp listings sitting > 30 days — soft ceiling on asking rent; 54 units permitted in St. Martin Parish in 2024 (0 in 5+ unit buildings).
Forward outlook
- Local home prices are declining (-3.0%/yr); year-one equity from $1k of loan paydown is wiped out by about $5k of value loss. Plan a longer hold.
- St. Martin County population projected at +7% by 2050 — modest demand growth; plan on rents tracking national, not racing it.
Negotiation context
- It's been on market 35 days — a 3% lower offer ($160k) is reasonable based on typical stale-listing flexibility.
- 6 sale attempts since 18y ago with the ask held roughly flat each time — persistent listings suggest the price (not the market) is what's stuck; bring a comps-based counter.
Risks & watch-outs
- Climate carrying-cost: severe wind risk, 99% chance of damaging wind over 30y; extreme-heat days projected 7→20/yr by 2055 (HVAC capex compounding) — expect insurance premiums to compound above CPI over the hold.
Questions for the listing agent
- It's been on market 35 days. Have you received any prior offers? Is the seller open to a 3% concession, seller financing, or rate buy-down credit?
- What does the HOA fee cover, when was the last increase, and are there any pending special assessments or reserve-fund shortfalls?
- Is there a deadline driving the sale (1031 exchange, divorce, estate, relocation)? That informs how much negotiation room exists.
- Crime grade is F in this area — have there been break-ins, vandalism, or insurance claims at this property in the last 3 years? What carrier currently insures it and at what premium?
- The area grade is low — what's the realistic commute time and amenity access for the typical tenant pool here? Any planned neighborhood developments (good or bad) we should know about?
- What's the average days-on-market for RENTAL listings here right now (not sales)? A rising rental-DOM trend means longer vacancies and softer asking-rent achievability than the comps imply.
- What's the recent tenant-quality profile in this submarket — average credit score on applications, eviction rate, late-payment / NSF rate, and stable-employment percentage? A property-management company in the area should have these aggregated.
- How much new for-sale + rental construction is in the pipeline within 1–3 miles? Heavy new supply typically softens prices + rents 12–24 months out; constrained supply supports both.
Investment metrics
- 1% rule
- 0.99% ✗
- Cap rate
- 7.73%
- Cash-on-cash
- 5.15%
- DSCR
- 1.23
- GRM
- 8.4
CMA / ARV
- ARV (on-the-fly)
- $165,375
- Comps found
- 12
Show comp detail 12 sales within ~0.75 mi
| Address | Dist | Beds/Ba | Sqft | Sold | Price | $/sf | Match |
|---|---|---|---|---|---|---|---|
| 1042 Lillian Michel Dr | 0.02mi | 3/2.0 | 1,298 (-2%) | 4mo | $162,000 | $125 | 93 |
| 925 Lillian Michel Dr | 0.23mi | 3/2.0 | 1,323 (0%) | 4mo | $181,500 | $137 | 86 |
| 918 Lillian Michel Dr | 0.24mi | 3/2.0 | 1,360 (+3%) | 8mo | $185,000 | $136 | 78 |
| 1409 Grand Pointe Ave | 0.26mi | 2/1.0 (-1) | 1,235 (-7%) | 2mo | $120,000 | $97 | 66 |
| 114 Van Buren St | 0.67mi | 3/2.0 | 1,267 (-4%) | 2mo | $151,000 | $119 | 60 |
| 744 N Belle Cir | 0.22mi | 3/2.0 | 1,475 (+12%) | 13mo | $225,000 | $153 | 60 |
| 728 S Poydras St | 0.68mi | 3/1.0 | 1,338 (+1%) | 13mo | $165,000 | $123 | 52 |
| 708 S Belle Cir | 0.36mi | 3/2.0 | 1,512 (+14%) | 16mo | $210,000 | $139 | 46 |
| — | 0.71mi | 2/2.0 (-1) | 1,251 (-5%) | 11mo | $215,000 | $172 | 44 |
| 403 Marian Dr | 0.72mi | 3/1.5 | 1,420 (+7%) | 12mo | $130,000 | $92 | 42 |
| 134 Saint Phillip St | 0.65mi | 2/2.5 (-1) | 1,200 (-9%) | 10mo | $124,900 | $104 | 39 |
| — | 0.71mi | 3/1.0 | 1,150 (-13%) | 12mo | $45,000 | $39 | 31 |
Match score weights: distance 35% · size 25% · config 20% · recency 20%. Top-matched comps best support the ARV.
Projected returns pro-forma
-3.0% appreciation · 3.0% rent growth · sell at horizon
- IRR
- -8.3%
- Equity multiple
- 0.69×
- Total profit
- $-14,113
- Equity at exit
- $24,587
- IRR
- 1.2%
- Equity multiple
- 1.09×
- Total profit
- $3,930
- Equity at exit
- $14,258
Cash invested: $46,172 (down + closing). Projections, not guarantees.
Landlord ↔ Tenant lean methodology
- Overall (STATE)
- 90 Strongly Landlord-Friendly
- State Louisiana
- 90 Strongly Landlord-Friendly · R+12
- County
- — inherits STATE
- City
- — inherits STATE
ZIP-level market 70517
- Home prices YoY
- -33.7%
- Active inventory
- 276
- Price-to-rent
- 8.4×
Monthly cashflow live
- Estimated rent
- $1,631 medium interval (Pro) →
- Mortgage (P&I)
- −$865
- Tax from tax record
- −$132 /mo · $1,581/yr
- Insurance
- −$69
- HOA
- −$25
- Vacancy / Maint / Mgmt
- −$342
- Net cashflow
- $198
Break-even live
UW: 25.0% down · 7.5% · 30yr · 1.5% tax · 5.0% vac · 8.0% maint · 8.0% mgmt
Financing live
Cash to close
- Down payment
- $41,225
- Closing costs
- $4,947
- Reserves months
- —
- Total cash needed
- —
Loan-product check · same deal, 3 products live
Conventional
25% down · 7.5% · 30yr
- Down + closing
- —
- Monthly P&I
- —
- Monthly cashflow
- —
- DSCR
- —
- Eligible?
- —
Personal DTI + credit; lowest rate.
DSCR
20% down · 8.5% · 30yr
- Down + closing
- —
- Monthly P&I
- —
- Monthly cashflow
- —
- DSCR
- —
- Eligible?
- —
No personal income docs; deal must DSCR.
Hard money
10% down · 12.0% · 12mo
- Down + closing
- —
- Monthly P&I
- —
- Monthly cashflow
- —
- DSCR
- —
- Eligible?
- —
Short-term bridge; refi at stabilization.
Rent comps 3 comps
| Address | Beds | Baths | Sqft | Rent | $/sqft | DOM | Units | Dist |
|---|---|---|---|---|---|---|---|---|
| 740 S Belle Cir Breaux Bridge, LA | 3.0 | 2.0 | 1485 | $1,800 | $1.21 | 13d | 1 | 0.24mi |
| 117 S Poydras St Breaux Bridge, LA | 2.0 | 1.0 | 1200 | $1,500 | $1.25 | 43d | 1 | 0.35mi |
| 906 Cecile Blvd Breaux Bridge, LA | 3.0 | 1.5 | 1300 | $1,200 | $0.92 | 43d | 1 | 1.45mi |
HOA detail
- Monthly dues
- $25 · $300/yr
Listing history 12 events
-
2026-04-02status Pending
-
2026-02-26$164,900 Active
-
2025-06-06price $165,000
-
2025-05-02status Active
-
2025-05-02price $170,000
-
2024-11-18$175,000 Active
-
2024-04-16price $180,000
-
2024-03-30$185,000 Active
-
2018-07-24soldstatus $150,000
-
2018-07-20soldstatus $150,000
-
2018-06-11$150,000
-
2008-07-26$141,000
ⓘ Source: listings_history table (triggers on properties + properties_extension) + one-shot
backfill from property_details.listing_events for pre-trigger history.
Tax reassessment forecast LA · Resets to sale price
- Current annual tax
- $1,581 · $132/mo
- Projected year-2 tax
- $1,581 · $132/mo
- Expected delta
- $0/yr ($0/mo · -0.0%)
ⓘ Screening estimate from a state-policy table — verify with the county assessor before closing.
Climate risk First Street
- Flood 1/10 Low FEMA zone X · 0% chance over 30 yrs
- Wildfire 1/10 Low
- Heat 9/10 Extreme 7 d/yr ≥109°F today · 20 d/yr by 30 yrs out
- Wind 9/10 Extreme 99% chance of damaging wind over 30 yrs
- Air quality 2/10 Low 1 unhealthy d/yr today · 1 by 30 yrs out
Nearby sold comps map
Loading sold comps map…
Walkable amenities ~0.75 mi
Loading nearby amenities…
Taxation est. · year 1
- Rental income
- $19,568
- − Mortgage interest
- −$9,237
- − Property taxes
- −$1,581
- − Insurance
- −$824
- − Repairs & maintenance
- −$1,565
- − Management
- −$1,565
- − HOA
- −$300
- − Depreciation
- −$4,797
- Taxable loss
- −$302
- Est. tax savings @ 24.0%
- +$72
- After-tax cash flow
- $2,449/yr
For passive investors: Depreciation is non-cash, so a rental often shows a tax loss while cash-flowing — sheltering income. Rental losses are passive: they offset passive income freely, and up to $25,000/yr can offset ordinary (W-2) income if you actively participate and your MAGI is under $100k (phasing out to $0 by $150k); unused losses carry forward. On sale, claimed depreciation is recaptured at up to 25%, and gains may owe capital-gains tax (a 1031 exchange can defer both). Figures are a year-1 estimate at your 24.0% rate — not tax advice; consult a CPA.
Schools (NCES district)
- District
- St. Martin Parish
- NCES district ID
- 2201590
- Math proficiency
- 23% ▼ -44.00%
- Reading proficiency
- 32% ▼ -36.00%
- Median HH income
- $42,813
- Composite
- 23.41/100
- National rank
- #7897
- State rank
- #49 of 98 in LA
Livability — Breaux Bridge
- Score
- 62/100
- State rank
- #210
- US rank
- #16362
Category grades
Schools grade is shown separately in the Schools card above.
Census & demographics
- Census place
- Breaux Bridge, LA
- Population (ZIP)
- 26,570
Population outlook (St. Martin County) Hauer SSP2
- Today (2025)
- 57,446 people
- By 2030
- 58,857 · +2.5%
- By 2040
- 60,859 · +5.9%
- By 2050
- 61,419 · +6.9%
- By 2075
- 61,574 · +7.2%
- By 2100
- 57,253 · -0.3%
Race, ethnicity, and origin ACS 2023
- Neighborhood character
- Majority White (62%)
- Race & ethnicity
- White 62% Black 30% Two or more races 5% Hispanic / Latino 4% Asian 1%
- Common ancestry
- Lithuanian 18% Slovak 1% Romanian 1%
- Foreign-born
- 3% · Canada, Vietnam, China
- Languages at home
- 87% English-only · French/Haitian/Cajun 9% Spanish 3% Vietnamese 1%
Political lean MEDSL · St. Martin
- 2024 margin
- Solid R (+40.7) · D 29.1% · R 69.8% · Other 1.0%
- 2008→2024 swing
- -20.0pp toward R · 2008: -20.7pp · 2024: -40.7pp
- All cycles
- 2024: R+40.7 2020: R+36.1 2016: R+33.4 2012: R+24.5 2008: R+20.7
Not yet ingested
- Civics
- —
Market trends
- HPI YoY
- ▼ -73.00%
- Current HPI
- 143.4293
- Rent YoY
- —
- Metro
- —
- State GDP YoY
- ▲ 3.29%
- F500 in state
- 10
Industry mix (Fortune 500 HQ in LA)
| Industry | F500 HQs | Revenue |
|---|---|---|
| Telecommunications | 2 | $23B |
|
||
| Utilities | 1 | $12B |
|
||
| Wholesale / Distribution | 1 | $5B |
|
||
| Advertising | 1 | $2B |
|
||
Price history
+17.0% since first listed12 events — show timeline
- 2026-04-02 Pending — AcadianaMLS
- 2026-02-26 Listed $164,900 AcadianaMLS
- 2025-06-06 Price Changed $165,000 AcadianaMLS
- 2025-05-02 Relisted — AcadianaMLS
- 2025-05-02 Price Changed $170,000 AcadianaMLS
- 2024-11-18 Listed $175,000 AcadianaMLS
- 2024-04-16 Price Changed $180,000 AcadianaMLS
- 2024-03-30 Listed $185,000 AcadianaMLS
- 2018-07-24 Sold (Public Records) $150,000 Public Records
- 2018-07-20 Sold (MLS) $150,000 AcadianaMLS
- 2018-06-11 Listed $150,000 AcadianaMLS
- 2008-07-26 Listed $141,000 AcadianaMLS
Property tax history
+1.2%/yrLatest (2025): $1,581 · -0.6% YoY. Source: county tax records.
Cash-flow waterfall
monthlySold comps — $/sqft
last 12 mo · ≤1 miLoading sold comps…