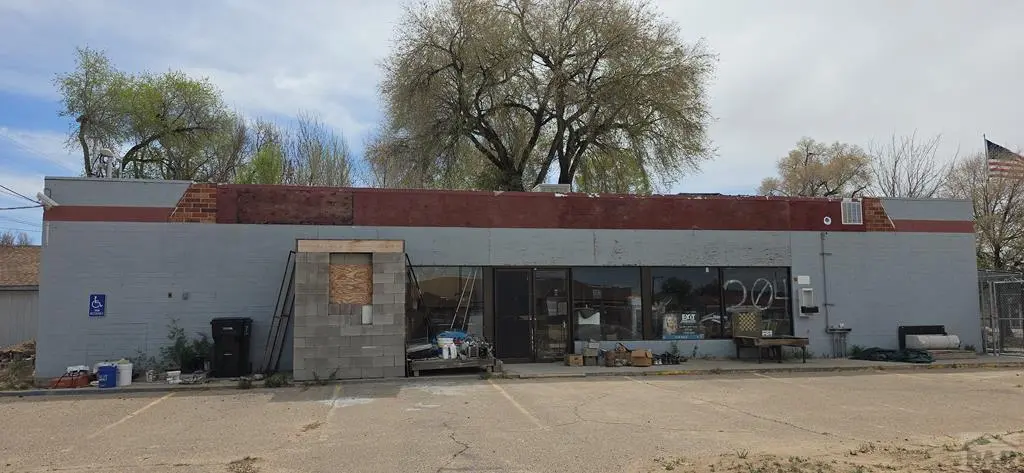
204 E Cranston Ave · Fowler, CO
Flood risk 1/10 · Minimal
- FEMA flood zone
- —
- Chance of flooding over 30 yrs
- 0.0%
- Est. flood insurance / yr
- —
Fire risk 4/10 · Minor
- Est. fire insurance / yr
- $939 – $1,743
Heat risk 4/10 · Minor
- Hot days now (above 98°F)
- 5 days/yr
- Hot days in 30 yrs
- 15 days/yr
Wind risk 2/10 · Minimal
- Chance of severe wind over 30 yrs
- —
Air-quality risk 2/10 · Minimal
- Unhealthy air days now
- 0 days/yr
- Unhealthy air days in 30 yrs
- 2 days/yr
Risk factors via First Street. Map © Google.
Why this score? — see what drove the B- grade
The composite is a weighted blend of 9 inputs, each scored 0–100. Each bar is that input's sub-score; the figure is the points it added to the 100-point composite (weight × sub-score).
- Cash flow +24.3/30.0
- Appreciation +10.0/10.0
- DSCR +7.8/10.0
- ARV discount +7.5/15.0
- 1% rule +5.6/10.0
- Livability +3.6/5.0
- Schools +3.2/10.0
- Rent growth +2.5/5.0
- Condition / age +2.5/5.0
$90,000
🖨 Deal sheet (PDF) 📄 Offer letter ✓ Due diligence
Listing remarks
BIG Business - Location Location! Average Daily Traffic (AADT): 3,000 to 19,000 vehicles per day. While specific, site-specific counts for 204 E Cranston are not directly displayed in public online maps, traffic on this segment of US-50 (W/ E Cranston Ave) within the town of Fowler generally ranges within 3,000 to 19,000 vehicles per day based on studies of the 1999–2022 period. Priced right! Assessors site: https://oteroco-search. gsacorp. io/parcel/000000101022
Key facts
- 0.32 acre lot
- Built 1997
- Listed 73 days
Property features AI
Finance
- Other: Lot roughly 140 x 100 (0.321 acre)
- Financial info: Property tax amount not included per instructions
- HOA & community: No association amenities
Exterior
- Parking: No garage
- Security: Smoke detector(s)
- Utilities: Public water; Public sewer
- Home design: Single family residential; Zoning: R-2
- Construction: Block construction
- Exterior features: Flat rubber roof
Interior
- Kitchen: No kitchen appliances listed
- Bedrooms: Bedrooms not specified
- Bathrooms: 1 full bathroom
- Heating & cooling: No heating; No cooling
- Interior features: No built-in appliances listed; No fireplace
- Laundry & utility: Main level laundry
Neighborhood map
What this means for you Summary
Snapshot
- This is a 1-bed/1.0-bath single-family listed at $90k.
Deal economics
- At list price, monthly cash flow is $181 ($2k/yr) — positive.
- The deal already cash-flows at list — no discount required.
- Meets the 1% rule at list price ($950 rent vs $90k).
- Recommended offer: $85k (6.0% below list) — sets the bar for market timing.
Location & tenants
- Location reads 72/100 on livability (#66 in CO) — a middle-class / working-renter tenant base. Strengths: cost of living A+, housing A+, crime B; Watch: health & safety C-, schools D+, amenities F.
- Fowler School District No. R4J (rural): math 29% / reading 41% proficiency, ranked #80 of 176 in CO (top 46%) — families likely to look elsewhere, expect single-tenant / working-renter base with shorter leases.
- Market conditions: 19 active listings in the ZIP; 11 units permitted in Otero County in 2024 (0 in 5+ unit buildings).
Forward outlook
- In year one you build about $10k of equity ($622 loan paydown + $9k appreciation (10.0% local appreciation)).
- Otero County population projected at -17% by 2050 — secular population decline; favor cash flow + early exit over multi-decade hold.
- At projected returns (10.0% appreciation + 3.0% rent growth), your $25k cash investment doubles in ~3 years — after that, you're playing with house money.
- By year 4, paydown + projected appreciation supports a ~$34k cash-out refi (75% LTV) — recoverable capital for the next deal without selling this one.
Negotiation context
- It's been on market 73 days — a 6% lower offer ($85k) is reasonable based on typical stale-listing flexibility.
- 2 sale attempts with the ask held roughly flat each time — persistent listings suggest the price (not the market) is what's stuck; bring a comps-based counter.
Questions for the listing agent
- It's been on market 73 days. Have you received any prior offers? Is the seller open to a 6% concession, seller financing, or rate buy-down credit?
- Why hasn't it sold? Are there any deal-killer items the seller is aware of (foundation, flood, title, zoning, code violations)?
- Is there a deadline driving the sale (1031 exchange, divorce, estate, relocation)? That informs how much negotiation room exists.
- Schools are D-rated, which usually means shorter tenancies and higher turnover. Who's the typical renter profile here, and what's been the actual vacancy rate?
- What's the average days-on-market for RENTAL listings here right now (not sales)? A rising rental-DOM trend means longer vacancies and softer asking-rent achievability than the comps imply.
- What's the recent tenant-quality profile in this submarket — average credit score on applications, eviction rate, late-payment / NSF rate, and stable-employment percentage? A property-management company in the area should have these aggregated.
- How much new for-sale + rental construction is in the pipeline within 1–3 miles? Heavy new supply typically softens prices + rents 12–24 months out; constrained supply supports both.
Investment metrics
- 1% rule
- 1.06% ✓
- Cap rate
- 8.71%
- Cash-on-cash
- 8.64%
- DSCR
- 1.38
- GRM
- 7.9
CMA / ARV
No comps found within radius.
Projected returns pro-forma
10.0% appreciation · 3.0% rent growth · sell at horizon
- IRR
- 30.6%
- Equity multiple
- 3.40×
- Total profit
- $60,549
- Equity at exit
- $81,079
- IRR
- 26.5%
- Equity multiple
- 7.71×
- Total profit
- $169,187
- Equity at exit
- $174,850
Cash invested: $25,200 (down + closing). Projections, not guarantees.
Landlord ↔ Tenant lean methodology
- Overall (STATE)
- 38 Tenant-Leaning
- State Colorado
- 38 Tenant-Leaning · D+4
- County
- — inherits STATE
- City
- — inherits STATE
ZIP-level market 81039
- Home prices YoY
- 7.0%
- Active inventory
- 19
- Price-to-rent
- 7.9×
Monthly cashflow live
- Estimated rent
- $950 medium interval (Pro) →
- Mortgage (P&I)
- −$472
- Tax from tax record
- −$60 /mo · $715/yr
- Insurance
- −$38
- HOA
- −$0
- Vacancy / Maint / Mgmt
- −$199
- Net cashflow
- $181
Break-even live
Sensitivity live
| Price | -10% $232 | -5% $207 | +0% $181 | +5% $156 | +10% $130 |
|---|---|---|---|---|---|
| Rent | -10% $106 | -5% $144 | +0% $181 | +5% $219 | +10% $256 |
| Rate | -1.0pp $227 | -0.5pp $204 | base $181 | +0.5pp $158 | +1.0pp $134 |
UW: 25.0% down · 7.5% · 30yr · 1.5% tax · 5.0% vac · 8.0% maint · 8.0% mgmt
Financing live
Cash to close
- Down payment
- $22,500
- Closing costs
- $2,700
- Reserves months
- —
- Total cash needed
- —
Loan-product check · same deal, 3 products live
Conventional
25% down · 7.5% · 30yr
- Down + closing
- —
- Monthly P&I
- —
- Monthly cashflow
- —
- DSCR
- —
- Eligible?
- —
Personal DTI + credit; lowest rate.
DSCR
20% down · 8.5% · 30yr
- Down + closing
- —
- Monthly P&I
- —
- Monthly cashflow
- —
- DSCR
- —
- Eligible?
- —
No personal income docs; deal must DSCR.
Hard money
10% down · 12.0% · 12mo
- Down + closing
- —
- Monthly P&I
- —
- Monthly cashflow
- —
- DSCR
- —
- Eligible?
- —
Short-term bridge; refi at stabilization.
Listing history 18 events
-
2026-06-21days on market $90,000 Active 73 DOM
-
2026-06-18days on market $90,000 Active 71 DOM
-
2026-06-17days on market $90,000 Active 70 DOM
-
2026-06-16days on market $90,000 Active 69 DOM
-
2026-06-15days on market $90,000 Active 68 DOM
-
2026-06-13days on market $90,000 Active 66 DOM
-
2026-06-12days on market $90,000 Active 65 DOM
-
2026-06-09days on market $90,000 Active 62 DOM
-
2026-06-08days on market $90,000 Active 61 DOM
-
2026-06-07days on market $90,000 Active 60 DOM
-
2026-06-05days on market $90,000 Active 58 DOM
-
2026-06-04days on market $90,000 Active 56 DOM
-
2026-06-02days on market $90,000 Active 55 DOM
-
2026-06-01days on market $90,000 Active 54 DOM
-
2026-05-31days on market $90,000 Active 53 DOM
-
2026-05-31days on market $90,000 Active 52 DOM
-
2026-04-09$90,000 Active
-
2026-04-09$90,000 Active
ⓘ Source: listings_history table (triggers on properties + properties_extension) + one-shot
backfill from property_details.listing_events for pre-trigger history.
Tax reassessment forecast CO · Resets to sale price
- Current annual tax
- $715 · $60/mo
- Projected year-2 tax
- $715 · $60/mo
- Expected delta
- $0/yr ($0/mo · 0.0%)
ⓘ Screening estimate from a state-policy table — verify with the county assessor before closing.
Climate risk First Street
- Flood 1/10 Low 0% chance over 30 yrs
- Wildfire 4/10 Moderate
- Heat 4/10 Moderate 5 d/yr ≥98°F today · 15 d/yr by 30 yrs out
- Wind 2/10 Low
- Air quality 2/10 Low 0 unhealthy d/yr today · 2 by 30 yrs out
Nearby sold comps map
Loading sold comps map…
Walkable amenities ~0.75 mi
Loading nearby amenities…
Taxation est. · year 1
- Rental income
- $11,399
- − Mortgage interest
- −$5,041
- − Property taxes
- −$715
- − Insurance
- −$450
- − Repairs & maintenance
- −$912
- − Management
- −$912
- − Depreciation
- −$2,618
- Taxable income
- $750
- Est. tax owed @ 24.0%
- −$180
- After-tax cash flow
- $1,996/yr
For passive investors: Depreciation is non-cash, so a rental often shows a tax loss while cash-flowing — sheltering income. Rental losses are passive: they offset passive income freely, and up to $25,000/yr can offset ordinary (W-2) income if you actively participate and your MAGI is under $100k (phasing out to $0 by $150k); unused losses carry forward. On sale, claimed depreciation is recaptured at up to 25%, and gains may owe capital-gains tax (a 1031 exchange can defer both). Figures are a year-1 estimate at your 24.0% rate — not tax advice; consult a CPA.
Schools (NCES district)
- District
- Fowler School District No. R4J
- NCES district ID
- 0804110
- Math proficiency
- 29% ▼ -6.00%
- Reading proficiency
- 41% ▲ 5.00%
- Median HH income
- $39,770
- Composite
- 31.98/100
- National rank
- #11024
- State rank
- #80 of 176 in CO
Livability — Fowler
- Score
- 72/100
- State rank
- #66
- US rank
- #6320
Category grades
Schools grade is shown separately in the Schools card above.
Census & demographics
- Census place
- Fowler, CO
- Population (ZIP)
- 1,686
Population outlook (Otero County) Hauer SSP2
- Today (2025)
- 17,363 people
- By 2030
- 16,776 · -3.4%
- By 2040
- 15,534 · -10.5%
- By 2050
- 14,467 · -16.7%
- By 2075
- 12,054 · -30.6%
- By 2100
- 9,392 · -45.9%
Race, ethnicity, and origin ACS 2023
- Neighborhood character
- Predominantly White (81%)
- Race & ethnicity
- White 81% Hispanic / Latino 16% Two or more races 5% Black 1%
- Hispanic origin (detail)
- Mexican 13%
- Common ancestry
- Italian 4% Slovak 3% Lithuanian 3%
- Foreign-born
- 2% · Canada
- Languages at home
- 96% English-only · Spanish 4%
Political lean MEDSL · Otero
- 2024 margin
- Strong R (+26.4) · D 35.5% · R 61.9% · Other 2.7%
- 2008→2024 swing
- -15.9pp toward R · 2008: -10.5pp · 2024: -26.4pp
- All cycles
- 2024: R+26.4 2020: R+22.5 2016: R+25.2 2012: R+9.3 2008: R+10.5
Not yet ingested
- Civics
- —
Market trends
- HPI YoY
- ▲ 17.96%
- Current HPI
- 274.2024
- Rent YoY
- —
- Metro
- —
- State GDP YoY
- ▲ 1.95%
- F500 in state
- 14
Industry mix (Fortune 500 HQ in CO)
| Industry | F500 HQs | Revenue |
|---|---|---|
| Technology Distribution | 1 | $31B |
|
||
| Food / Agriculture | 1 | $18B |
|
||
| Packaging | 1 | $14B |
|
||
| Healthcare | 1 | $13B |
|
||
| Energy | 1 | $10B |
|
||
| Technology | 1 | $4B |
|
||
Price history
+0.0% since first listed2 events — show timeline
- 2026-04-09 Listed $90,000 PARMLS
- 2026-04-09 Listed $90,000 PARMLS
Property tax history
+3.1%/yrLatest (2024): $715 · -0.6% YoY. Source: county tax records.
Cash-flow waterfall
monthlySold comps — $/sqft
last 12 mo · ≤1 miLoading sold comps…