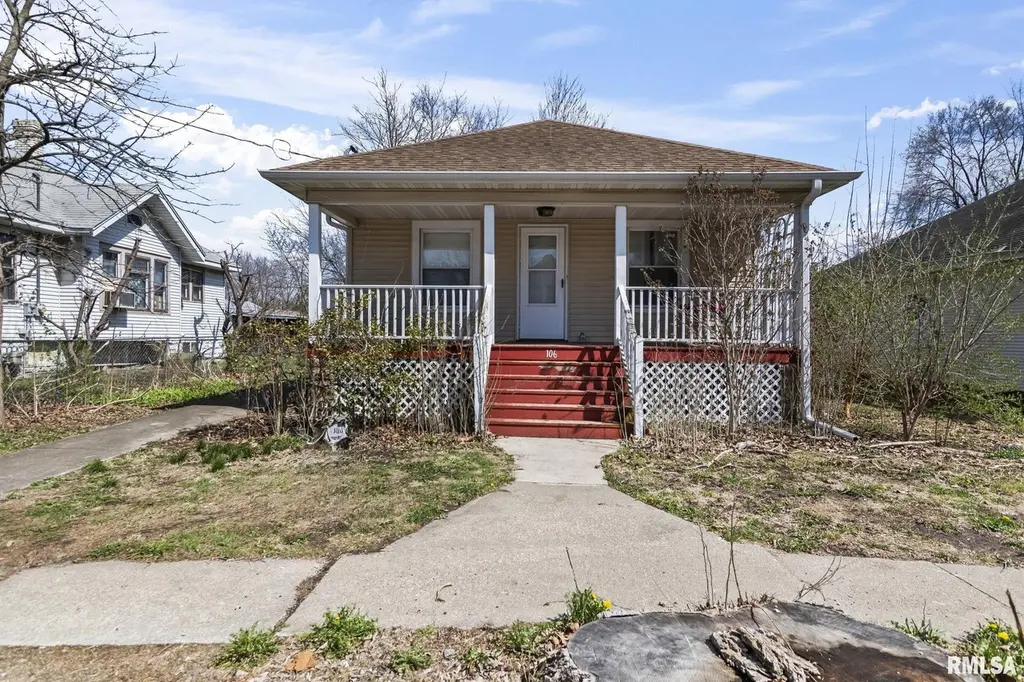
106 Henry St · Bulpitt, IL
Flood risk 1/10 · Minimal
- FEMA flood zone
- X (unshaded)
- Chance of flooding over 30 yrs
- 0.0%
- Est. flood insurance / yr
- $473 – $860
Fire risk 1/10 · Minimal
- Est. fire insurance / yr
- $804 – $1,492
Heat risk 4/10 · Minor
- Hot days now (above 105°F)
- 7 days/yr
- Hot days in 30 yrs
- 20 days/yr
Wind risk 2/10 · Minimal
- Chance of severe wind over 30 yrs
- 2.0%
Air-quality risk 2/10 · Minimal
- Unhealthy air days now
- 0 days/yr
- Unhealthy air days in 30 yrs
- 1 days/yr
Risk factors via First Street. Map © Google.
Why this score? — see what drove the D- grade
The composite is a weighted blend of 9 inputs, each scored 0–100. Each bar is that input's sub-score; the figure is the points it added to the 100-point composite (weight × sub-score).
- Cash flow +13.8/30.0
- Appreciation +5.0/10.0
- DSCR +4.2/10.0
- 1% rule +3.9/10.0
- Livability +3.0/5.0
- Rent growth +2.5/5.0
- Condition / age +2.5/5.0
- ARV discount +2.4/15.0
- Schools +1.8/10.0
$109,900
🖨 Deal sheet (PDF) 📄 Offer letter ✓ Due diligence
Listing remarks MLS
Take a look at this 3 bed, 2 bath home in Christian County. This cozy bungalow features a welcoming front porch, perfect for morning coffee. Inside, enjoy the warm atmosphere created by the craftsman-style wood trim and wooden cabinetry throughout the house.
Key facts
- Parking
- Listed 73 days
Neighborhood map
What this means for you Summary
Snapshot
- This is a 2-bed/2.0-bath single-family listed at $110k.
Deal economics
- At list price, monthly cash flow is $9 ($109/yr) — positive.
- The deal already cash-flows at list — no discount required.
- To meet the 1% rule (rent ≥ 1% of price), the offer needs to be $98k (10.9% below list).
- Recommended offer: $98k (10.9% below list) — sets the bar for 1% rule.
Location & tenants
- Location reads 59/100 on livability (#1,060 in IL) — a working-class tenant base; expect higher turnover. Strengths: cost of living A+, housing A+; Watch: employment C-, crime D-, amenities F.
- South Fork SD 14 (rural): math 10% / reading 25% proficiency, ranked #744 of 919 in IL (top 81%) — low school quality limits family demand, transient renter base, plan for 1-2y turnover.
- Zoned schools: South Fork Elementary School (math 5% / reading 15%, grade F, #1,477 of 2,056 statewide, top 74%, 146 students, 0% FRL); South Fork Jr Sr High School (math 2% / reading 17%, grade F, #567 of 693 statewide, top 83%, 155 students, 0% FRL) — zoned schools average 0% FRL vs 48% district-wide (48 pts lower); this property's tenant base skews higher-income than the district average.
- Market conditions: 2 active listings in the ZIP; 26 units permitted in Christian County in 2024 (0 in 5+ unit buildings).
Forward outlook
- In year one you build about $4k of equity ($760 loan paydown + $3k appreciation (3.0% local appreciation)).
- Christian County population projected at -24% by 2050 — secular population decline; favor cash flow + early exit over multi-decade hold.
- At projected returns (3.0% appreciation + 3.0% rent growth), your $31k cash investment doubles in ~6 years — after that, you're playing with house money.
- By year 8, paydown + projected appreciation supports a ~$30k cash-out refi (75% LTV) — recoverable capital for the next deal without selling this one.
Negotiation context
- It's been on market 73 days — a 6% lower offer ($103k) is reasonable based on typical stale-listing flexibility.
- 2 sale attempts since 5y ago with the ask held roughly flat each time — persistent listings suggest the price (not the market) is what's stuck; bring a comps-based counter.
- Current owner paid $78k; 41% above their basis — modest negotiation headroom, anchor on the comps not their cost.
Risks & watch-outs
- Watch-outs: built in 1920 — expect roof / HVAC / electrical / plumbing capex.
Questions for the listing agent
- It's been on market 73 days. Have you received any prior offers? Is the seller open to a 11% concession, seller financing, or rate buy-down credit?
- Built in 1920 — when were the roof, HVAC, electrical panel, plumbing, and water heater last replaced?
- Why hasn't it sold? Are there any deal-killer items the seller is aware of (foundation, flood, title, zoning, code violations)?
- Is there a deadline driving the sale (1031 exchange, divorce, estate, relocation)? That informs how much negotiation room exists.
- Schools are F-rated, which usually means shorter tenancies and higher turnover. Who's the typical renter profile here, and what's been the actual vacancy rate?
- Crime grade is D in this area — have there been break-ins, vandalism, or insurance claims at this property in the last 3 years? What carrier currently insures it and at what premium?
- The area grade is low — what's the realistic commute time and amenity access for the typical tenant pool here? Any planned neighborhood developments (good or bad) we should know about?
- What's the average days-on-market for RENTAL listings here right now (not sales)? A rising rental-DOM trend means longer vacancies and softer asking-rent achievability than the comps imply.
- What's the recent tenant-quality profile in this submarket — average credit score on applications, eviction rate, late-payment / NSF rate, and stable-employment percentage? A property-management company in the area should have these aggregated.
- How much new for-sale + rental construction is in the pipeline within 1–3 miles? Heavy new supply typically softens prices + rents 12–24 months out; constrained supply supports both.
Investment metrics
- 1% rule
- 0.89% ✗
- Cap rate
- 6.39%
- Cash-on-cash
- 0.35%
- DSCR
- 1.02
- GRM
- 9.4
CMA / ARV
- ARV (median comp)
- $98,759
- List price
- $109,900
- Delta
- 11.28%
- Verdict
- OVERPRICED
- Comps
- 20 within 1.0 mi
Show comp detail 12 sales within ~0.75 mi
| Address | Dist | Beds/Ba | Sqft | Sold | Price | $/sf | Match |
|---|---|---|---|---|---|---|---|
| 108 Garrison St | 0.07mi | 2/1.0 | 1,100 (-0%) | 11mo | $130,000 | $118 | 83 |
| 201 Miss Debra Ave | 0.34mi | 2/1.0 | 1,048 (-5%) | 6mo | $121,000 | $115 | 66 |
| 223 Elm St | 0.43mi | 2/2.0 | 1,018 (-8%) | 6mo | $110,000 | $108 | 62 |
| 460 George St | 0.21mi | 1/1.0 (-1) | 1,237 (+12%) | 6mo | $61,000 | $49 | 56 |
| 200 Hickory St | 0.45mi | 3/2.0 (+1) | 1,244 (+13%) | 12mo | $145,000 | $117 | 43 |
| 313 Hickory St | 0.58mi | 3/1.0 (+1) | 1,128 (+2%) | 22mo | $88,000 | $78 | 42 |
| 326 Hickory St | 0.60mi | 3/1.0 (+1) | 1,128 (+2%) | 22mo | $103,500 | $92 | 41 |
| 214 Hickory St | 0.48mi | 3/1.0 (+1) | 1,190 (+8%) | 20mo | $126,000 | $106 | 39 |
| 319 Walnut St | 0.56mi | 2/1.0 | 948 (-14%) | 10mo | $97,000 | $102 | 38 |
| 305 North Ave | 0.60mi | 2/1.0 | 1,232 (+12%) | 19mo | $30,000 | $24 | 33 |
| 305 North Ave | 0.60mi | 2/1.0 | 1,232 (+12%) | 19mo | $30,000 | $24 | 33 |
| 760 Broccardo Ct | 0.71mi | 1/1.0 (-1) | 939 (-15%) | 20mo | $212,000 | $226 | 16 |
Match score weights: distance 35% · size 25% · config 20% · recency 20%. Top-matched comps best support the ARV.
Projected returns pro-forma
3.0% appreciation · 3.0% rent growth · sell at horizon
- IRR
- 7.8%
- Equity multiple
- 1.45×
- Total profit
- $13,836
- Equity at exit
- $49,416
- IRR
- 10.5%
- Equity multiple
- 2.58×
- Total profit
- $48,485
- Equity at exit
- $76,156
Cash invested: $30,772 (down + closing). Projections, not guarantees.
Landlord ↔ Tenant lean methodology
- Overall (STATE)
- 43 Moderately Tenant-Leaning
- State Illinois
- 43 Moderately Tenant-Leaning · D+7
- County
- — inherits STATE
- City
- — inherits STATE
ZIP-level market 62517
- Active inventory
- 2
- Price-to-rent
- 9.4×
Monthly cashflow live
- Estimated rent
- $979 medium interval (Pro) →
- Mortgage (P&I)
- −$576
- Tax from tax record
- −$142 /mo · $1,705/yr
- Insurance
- −$46
- HOA
- −$0
- Vacancy / Maint / Mgmt
- −$206
- Net cashflow
- $9
Break-even live
Sensitivity live
| Price | -10% $71 | -5% $40 | +0% $9 | +5% $-22 | +10% $-53 |
|---|---|---|---|---|---|
| Rent | -10% $-68 | -5% $-30 | +0% $9 | +5% $48 | +10% $86 |
| Rate | -1.0pp $64 | -0.5pp $37 | base $9 | +0.5pp $-19 | +1.0pp $-48 |
UW: 25.0% down · 7.5% · 30yr · 1.5% tax · 5.0% vac · 8.0% maint · 8.0% mgmt
Financing live
Cash to close
- Down payment
- $27,475
- Closing costs
- $3,297
- Reserves months
- —
- Total cash needed
- —
Loan-product check · same deal, 3 products live
Conventional
25% down · 7.5% · 30yr
- Down + closing
- —
- Monthly P&I
- —
- Monthly cashflow
- —
- DSCR
- —
- Eligible?
- —
Personal DTI + credit; lowest rate.
DSCR
20% down · 8.5% · 30yr
- Down + closing
- —
- Monthly P&I
- —
- Monthly cashflow
- —
- DSCR
- —
- Eligible?
- —
No personal income docs; deal must DSCR.
Hard money
10% down · 12.0% · 12mo
- Down + closing
- —
- Monthly P&I
- —
- Monthly cashflow
- —
- DSCR
- —
- Eligible?
- —
Short-term bridge; refi at stabilization.
Listing history 19 events
-
2026-06-15days on market $109,900 Active 73 DOM
-
2026-06-13days on market $109,900 Active 71 DOM
-
2026-06-12days on market $109,900 Active 70 DOM
-
2026-06-09days on market $109,900 Active 67 DOM
-
2026-06-08days on market $109,900 Active 66 DOM
-
2026-06-07days on market $109,900 Active 65 DOM
-
2026-06-05days on market $109,900 Active 63 DOM
-
2026-06-04days on market $109,900 Active 61 DOM
-
2026-06-02days on market $109,900 Active 60 DOM
-
2026-06-01days on market $109,900 Active 59 DOM
-
2026-05-31days on market $109,900 Active 58 DOM
-
2026-05-31days on market $109,900 Active 57 DOM
-
2026-04-03$109,900 Active 258-char remark
Show marketing remark (258 chars)
Take a look at this 3 bed, 2 bath home in Christian County. This cozy bungalow features a welcoming front porch, perfect for morning coffee. Inside, enjoy the warm atmosphere created by the craftsman-style wood trim and wooden cabinetry throughout the house.
-
2026-03-27historical $109,900 258-char remark
Show marketing remark (258 chars)
Take a look at this 3 bed, 2 bath home in Christian County. This cozy bungalow features a welcoming front porch, perfect for morning coffee. Inside, enjoy the warm atmosphere created by the craftsman-style wood trim and wooden cabinetry throughout the house.
-
2022-04-08soldstatus $78,000 324-char remark
Show marketing remark (324 chars)
Lovely 3 bedroom home with 2 full baths, lots of Character and Charm, original woodwork, and original hardwood in front bed and living room. Replacement windows throughout, updated wiring and plumbing, roof in 2012, gutters in 18', HVAC 9-10 yrs old. Unfinished basement. Covered front porch and newer composite side porch.
-
2021-09-01$79,900 324-char remark
Show marketing remark (324 chars)
Lovely 3 bedroom home with 2 full baths, lots of Character and Charm, original woodwork, and original hardwood in front bed and living room. Replacement windows throughout, updated wiring and plumbing, roof in 2012, gutters in 18', HVAC 9-10 yrs old. Unfinished basement. Covered front porch and newer composite side porch.
-
2021-08-06historical
-
2021-08-06historical
-
1984-10-01soldstatus $15,000
ⓘ Source: listings_history table (triggers on properties + properties_extension) + one-shot
backfill from property_details.listing_events for pre-trigger history.
Tax reassessment forecast IL · Partial reset (capped growth)
- Current annual tax
- $1,705 · $142/mo
- Projected year-2 tax
- $2,100 · $175/mo
- Expected delta
- +$395/yr (+$33/mo · 23.2%)
ⓘ Screening estimate from a state-policy table — verify with the county assessor before closing.
Climate risk First Street
- Flood 1/10 Low FEMA zone X (unshaded) · 0% chance over 30 yrs
- Wildfire 1/10 Low
- Heat 4/10 Moderate 7 d/yr ≥105°F today · 20 d/yr by 30 yrs out
- Wind 2/10 Low 2% chance of damaging wind over 30 yrs
- Air quality 2/10 Low 0 unhealthy d/yr today · 1 by 30 yrs out
Nearby sold comps map
Loading sold comps map…
Walkable amenities ~0.75 mi
Loading nearby amenities…
Taxation est. · year 1
- Rental income
- $11,746
- − Mortgage interest
- −$6,156
- − Property taxes
- −$1,705
- − Insurance
- −$550
- − Repairs & maintenance
- −$940
- − Management
- −$940
- − Depreciation
- −$3,197
- Taxable loss
- −$1,741
- Est. tax savings @ 24.0%
- +$418
- After-tax cash flow
- $527/yr
For passive investors: Depreciation is non-cash, so a rental often shows a tax loss while cash-flowing — sheltering income. Rental losses are passive: they offset passive income freely, and up to $25,000/yr can offset ordinary (W-2) income if you actively participate and your MAGI is under $100k (phasing out to $0 by $150k); unused losses carry forward. On sale, claimed depreciation is recaptured at up to 25%, and gains may owe capital-gains tax (a 1031 exchange can defer both). Figures are a year-1 estimate at your 24.0% rate — not tax advice; consult a CPA.
Schools (NCES district)
- District
- South Fork SD 14
- NCES district ID
- 1736640
- Math proficiency
- 10% ▼ -5.00%
- Reading proficiency
- 25% ▲ 5.00%
- Median HH income
- $41,398
- Composite
- 18.34/100
- National rank
- #14054
- State rank
- #744 of 919 in IL
Livability — Bulpitt
- Score
- 59/100
- State rank
- #1060
- US rank
- #20249
Category grades
Schools grade is shown separately in the Schools card above.
Census & demographics
- Census place
- Bulpitt, IL
- Population (ZIP)
- 213
Population outlook (Christian County) Hauer SSP2
- Today (2025)
- 31,182 people
- By 2030
- 29,787 · -4.5%
- By 2040
- 26,793 · -14.1%
- By 2050
- 23,757 · -23.8%
- By 2075
- 17,333 · -44.4%
- By 2100
- 11,573 · -62.9%
Race, ethnicity, and origin ACS 2023
- Neighborhood character
- Predominantly White (91%)
- Race & ethnicity
- White 91% Hispanic / Latino 9% Native American 2%
- Hispanic origin (detail)
- Mexican 9%
- Common ancestry
- English 1% Romanian 1% Slovak 1%
- Foreign-born
- 0%
- Languages at home
- 97% English-only · Spanish 2%
Political lean MEDSL · Christian
- 2024 margin
- Solid R (+46.7) · D 25.9% · R 72.6% · Other 1.5%
- 2008→2024 swing
- -40.4pp toward R · 2008: -6.3pp · 2024: -46.7pp
- All cycles
- 2024: R+46.7 2020: R+44.6 2016: R+42.7 2012: R+23.1 2008: R+6.3
Not yet ingested
- Civics
- —
Market trends
- HPI YoY
- —
- Current HPI
- —
- Rent YoY
- —
- Metro
- —
- State GDP YoY
- ▲ 1.59%
- F500 in state
- 60
Industry mix (Fortune 500 HQ in IL)
| Industry | F500 HQs | Revenue |
|---|---|---|
| Insurance | 4 | $201B |
|
||
| Consumer Goods | 4 | $87B |
|
||
| Industrial Machinery | 3 | $64B |
|
||
| Healthcare | 2 | $55B |
|
||
| Retail / Pharmacy | 1 | $148B |
|
||
| Agriculture / Food | 1 | $86B |
|
||
Price history
+632.7% since first listed7 events — show timeline
- 2026-04-03 Listed $109,900 RMLSA as Distributed by MLS Grid
- 2026-03-27 Coming Soon $109,900 RMLSA as Distributed by MLS Grid
- 2022-04-08 Sold (MLS) $78,000 RMLSA as Distributed by MLS Grid
- 2021-09-01 Listed $79,900 RMLSA as Distributed by MLS Grid
- 2021-08-06 Listing Removed — RMLSA as Distributed by MLS Grid
- 2021-08-06 Listing Removed — RMLSA as Distributed by MLS Grid
- 1984-10-01 Sold (Public Records) $15,000 Public Records
Property tax history
+17.1%/yrLatest (2024): $1,705 · +34.4% YoY. Source: county tax records.
Cash-flow waterfall
monthlySold comps — $/sqft
last 12 mo · ≤1 miLoading sold comps…