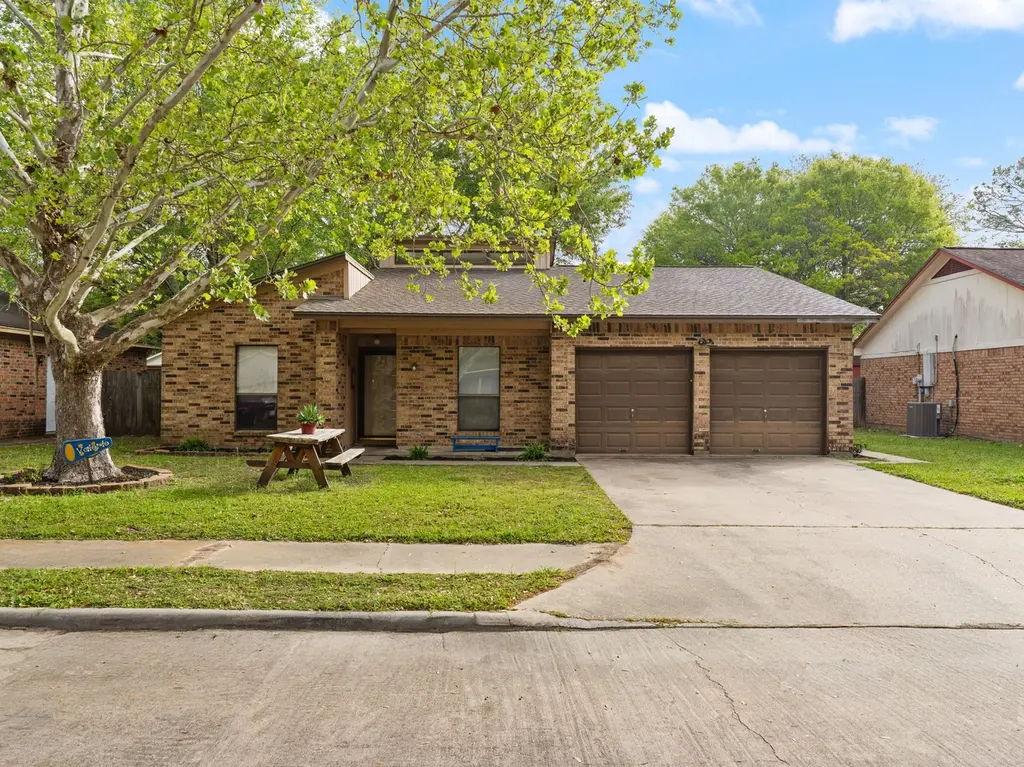
13 Columbella St · Bay City, TX
Flood risk 1/10 · Minimal
- FEMA flood zone
- X (unshaded)
- Chance of flooding over 30 yrs
- 0.0%
- Est. flood insurance / yr
- $507 – $1,088
Fire risk 3/10 · Minor
- Est. fire insurance / yr
- $1,222 – $2,270
Heat risk 9/10 · Severe
- Hot days now (above 109°F)
- 7 days/yr
- Hot days in 30 yrs
- 22 days/yr
Wind risk 9/10 · Severe
- Chance of severe wind over 30 yrs
- 99.0%
Air-quality risk 2/10 · Minimal
- Unhealthy air days now
- 0 days/yr
- Unhealthy air days in 30 yrs
- 1 days/yr
Risk factors via First Street. Map © Google.
Why this score? — see what drove the D grade
The composite is a weighted blend of 9 inputs, each scored 0–100. Each bar is that input's sub-score; the figure is the points it added to the 100-point composite (weight × sub-score).
- ARV discount +15.0/15.0
- Cash flow +7.9/30.0
- Livability +3.6/5.0
- Rent growth +3.3/5.0
- 1% rule +3.2/10.0
- Schools +2.6/10.0
- Condition / age +2.5/5.0
- DSCR +2.0/10.0
- Appreciation +0.0/10.0
$169,500
🖨 Deal sheet 📄 Offer letter ✓ Due diligence
Listing remarks MLS
Charming Bay City home tucked within a quiet cul-de-sac setting, offering both privacy and a welcoming neighborhood feel. The interior features vaulted ceilings and abundant natural light, creating an open and airy living space with a functional layout. The kitchen is well-positioned for everyday use, while the overall flow of the home supports comfortable living. Step outside to a spacious backyard with mature trees and a unique treehouse, adding character and flexibility for outdoor enjoyment. All-brick construction and a well-maintained condition further enhance the home’s appeal. Located in Flood Zone X, generally considered an area of minimal flood risk, with convenient access to local schools and amenities.
Key facts
- Spacious backyard
- Treehouse
- Natural light
Tags
Neighborhood map
What this means for you Summary
Snapshot
- This is a 3-bed/2.0-bath single-family listed at $170k.
Deal economics
- At list price, monthly cash flow is $-178 ($-2k/yr) — negative.
- To cash-flow at today's rent, offer at most $138k (18.5% below list).
- To meet the 1% rule (rent ≥ 1% of price), the offer needs to be $139k (18.0% below list).
- Recommended offer: $138k (18.5% below list) — sets the bar for cash-flow.
- Cap rate 5.0% vs local median 3.4% in Bay City — top-decile yield for the area; either an underpriced asset or a hidden risk that comps aren't pricing in. Stress-test before assuming the spread holds.
Location & tenants
- Location reads 71/100 on livability (#311 in TX) — a middle-class / working-renter tenant base. Strengths: cost of living A+, housing A+, health & safety A+; Watch: schools F, crime F, commute F.
- Bay City ISD (town): math 31% / reading 31% proficiency, ranked #604 of 826 in TX (top 73%) — families likely to look elsewhere, expect single-tenant / working-renter base with shorter leases; 66% free/reduced lunch — lower-income household profile, screen leases tightly.
- Market conditions: Rents rising (+3.3%/yr); 620 active listings in the ZIP; 2 comparable units currently listed for rent nearby; 153 units permitted in Matagorda County in 2024 (0 in 5+ unit buildings).
Forward outlook
- Local home prices are declining (-3.0%/yr); year-one equity from $1k of loan paydown is wiped out by about $5k of value loss. Plan a longer hold.
Negotiation context
- It's been on market 72 days — a 6% lower offer ($159k) is reasonable based on typical stale-listing flexibility.
Risks & watch-outs
- Climate carrying-cost: severe wind risk, 99% chance of damaging wind over 30y; extreme-heat days projected 7→22/yr by 2055 (HVAC capex compounding) — expect insurance premiums to compound above CPI over the hold.
Questions for the listing agent
- What do current leases actually rent for vs. the listed asking? Can we see a recent rent roll and the last 12 months of T-12 income?
- It's been on market 72 days. Have you received any prior offers? Is the seller open to a 19% concession, seller financing, or rate buy-down credit?
- Why hasn't it sold? Are there any deal-killer items the seller is aware of (foundation, flood, title, zoning, code violations)?
- Is there a deadline driving the sale (1031 exchange, divorce, estate, relocation)? That informs how much negotiation room exists.
- Schools are F-rated, which usually means shorter tenancies and higher turnover. Who's the typical renter profile here, and what's been the actual vacancy rate?
- Crime grade is F in this area — have there been break-ins, vandalism, or insurance claims at this property in the last 3 years? What carrier currently insures it and at what premium?
- The area grade is low — what's the realistic commute time and amenity access for the typical tenant pool here? Any planned neighborhood developments (good or bad) we should know about?
- What's the average days-on-market for RENTAL listings here right now (not sales)? A rising rental-DOM trend means longer vacancies and softer asking-rent achievability than the comps imply.
- What's the recent tenant-quality profile in this submarket — average credit score on applications, eviction rate, late-payment / NSF rate, and stable-employment percentage? A property-management company in the area should have these aggregated.
- How much new for-sale + rental construction is in the pipeline within 1–3 miles? Heavy new supply typically softens prices + rents 12–24 months out; constrained supply supports both.
Investment metrics
- 1% rule
- 0.82% ✗
- Cap rate
- 5.04%
- Cash-on-cash
- -4.49%
- DSCR
- 0.80
- GRM
- 10.2
CMA / ARV
- ARV (median comp)
- $205,622
- List price
- $169,500
- Delta
- -17.57%
- Verdict
- UNDERPRICED
- Comps
- 20 within 1.0 mi
Show comp detail 12 sales within ~0.75 mi
| Address | Dist | Beds/Ba | Sqft | Sold | Price | $/sf | Match |
|---|---|---|---|---|---|---|---|
| 3104 El Camino St | 0.06mi | 3/2.0 | 1,321 (+3%) | 7mo | $224,900 | $170 | 86 |
| 2809 El Camino St | 0.19mi | 3/2.0 | 1,461 (+14%) | 4mo | $210,000 | $144 | 64 |
| 2617 Patriot Run | 0.50mi | 3/2.0 | 1,409 (+10%) | 1mo | $227,990 | $162 | 59 |
| 5048 Freedom Ln | 0.48mi | 3/2.0 | 1,409 (+10%) | 3mo | $220,990 | $157 | 58 |
| 2608 Patriot Run | 0.54mi | 3/2.0 | 1,411 (+10%) | 1mo | $230,990 | $164 | 57 |
| 1121 Live Oak Ave | 0.58mi | 3/2.0 | 1,409 (+10%) | 1mo | $222,990 | $158 | 56 |
| 810 Live Oak Ave | 0.45mi | 3/2.0 | 1,442 (+13%) | 3mo | $269,000 | $187 | 56 |
| 1105 Live Oak Ave | 0.57mi | 3/2.0 | 1,418 (+11%) | 1mo | $227,990 | $161 | 55 |
| 5016 Freedom Ln | 0.55mi | 3/2.0 | 1,418 (+11%) | 3mo | $229,990 | $162 | 54 |
| 5033 Gallant St | 0.51mi | 3/2.0 | 1,411 (+10%) | 8mo | $231,990 | $164 | 53 |
| 2621 Patriot Run | 0.63mi | 3/2.0 | 1,418 (+11%) | 1mo | $235,990 | $166 | 52 |
| 5009 Freedom Ln | 0.59mi | 3/2.0 | 1,418 (+11%) | 4mo | $227,990 | $161 | 51 |
Match score weights: distance 35% · size 25% · config 20% · recency 20%. Top-matched comps best support the ARV.
Projected returns pro-forma
-3.0% appreciation · 3.28% rent growth · sell at horizon
- IRR
- -23.5%
- Equity multiple
- 0.19×
- Total profit
- $-38,304
- Equity at exit
- $25,273
- IRR
- -17.3%
- Equity multiple
- 0.03×
- Total profit
- $-45,956
- Equity at exit
- $14,655
Cash invested: $47,460 (down + closing). Projections, not guarantees.
Landlord ↔ Tenant lean methodology
- Overall (STATE)
- 87 Strongly Landlord-Friendly
- State Texas
- 87 Strongly Landlord-Friendly · R+5
- County
- — inherits STATE
- City
- — inherits STATE
ZIP-level market 77414
- Home prices YoY
- -17.7%
- Rents YoY
- 3.3%
- Active inventory
- 620
- Price-to-rent
- 10.2×
Monthly cashflow live
- Estimated rent
- $1,391 medium interval (Pro) →
- Mortgage (P&I)
- −$889
- Tax from tax record
- −$317 /mo · $3,801/yr
- Insurance
- −$71
- HOA
- −$0
- Vacancy / Maint / Mgmt
- −$292
- Net cashflow
- $-178
Break-even live
UW: 25.0% down · 7.5% · 30yr · 1.5% tax · 5.0% vac · 8.0% maint · 8.0% mgmt
Financing live
Cash to close
- Down payment
- $42,375
- Closing costs
- $5,085
- Reserves months
- —
- Total cash needed
- —
Loan-product check · same deal, 3 products live
Conventional
25% down · 7.5% · 30yr
- Down + closing
- —
- Monthly P&I
- —
- Monthly cashflow
- —
- DSCR
- —
- Eligible?
- —
Personal DTI + credit; lowest rate.
DSCR
20% down · 8.5% · 30yr
- Down + closing
- —
- Monthly P&I
- —
- Monthly cashflow
- —
- DSCR
- —
- Eligible?
- —
No personal income docs; deal must DSCR.
Hard money
10% down · 12.0% · 12mo
- Down + closing
- —
- Monthly P&I
- —
- Monthly cashflow
- —
- DSCR
- —
- Eligible?
- —
Short-term bridge; refi at stabilization.
Rent comps 2 comps
| Address | Beds | Baths | Sqft | Rent | $/sqft | DOM | Units | Dist |
|---|---|---|---|---|---|---|---|---|
| 1417 Highland Dr Bay City, TX | 3.0 | 2.0 | 1662 | $1,600 | $0.96 | 43d | 1 | 0.78mi |
| 2824 4th St Bay City, TX | 4.0 | 2.0 | 1524 | $1,800 | $1.18 | 43d | 1 | 1.45mi |
Listing history 20 events
-
2026-06-19days on market $169,500 Active 72 DOM
-
2026-06-18days on market $169,500 Active 71 DOM
-
2026-06-17days on market $169,500 Active 70 DOM
-
2026-06-16days on market $169,500 Active 69 DOM
-
2026-06-16price $169,500 Active 68 DOM
-
2026-06-15days on market $176,900 Active 68 DOM
-
2026-06-14days on market $176,900 Active 66 DOM
-
2026-06-12days on market $176,900 Active 65 DOM
-
2026-06-09days on market $176,900 Active 62 DOM
-
2026-06-08days on market $176,900 Active 61 DOM
-
2026-06-07days on market $176,900 Active 60 DOM
-
2026-06-07days on market $176,900 Active 59 DOM
-
2026-06-02days on market $176,900 Active 55 DOM
-
2026-06-01days on market $176,900 Active 54 DOM
-
2026-05-31days on market $176,900 Active 53 DOM
-
2026-05-30days on market $176,900 Active 52 DOM
-
2026-05-05price $176,900 734-char remark
Show marketing remark (734 chars)
Charming Bay City home tucked within a quiet cul-de-sac setting, offering both privacy and a welcoming neighborhood feel. The interior features vaulted ceilings and abundant natural light, creating an open and airy living space with a functional layout. The kitchen is well-positioned for everyday use, while the overall flow of the home supports comfortable living. Step outside to a spacious backyard with mature trees and a unique treehouse, adding character and flexibility for outdoor enjoyment. All-brick construction and a well-maintained condition further enhance the home’s appeal. Located in Flood Zone X, generally considered an area of minimal flood risk, with convenient access to local schools and amenities.
-
2026-04-08$184,500 Active 734-char remark
Show marketing remark (734 chars)
Charming Bay City home tucked within a quiet cul-de-sac setting, offering both privacy and a welcoming neighborhood feel. The interior features vaulted ceilings and abundant natural light, creating an open and airy living space with a functional layout. The kitchen is well-positioned for everyday use, while the overall flow of the home supports comfortable living. Step outside to a spacious backyard with mature trees and a unique treehouse, adding character and flexibility for outdoor enjoyment. All-brick construction and a well-maintained condition further enhance the home’s appeal. Located in Flood Zone X, generally considered an area of minimal flood risk, with convenient access to local schools and amenities.
-
2022-12-07soldstatus
-
2010-11-24soldstatus
ⓘ Source: listings_history table (triggers on properties + properties_extension) + one-shot
backfill from property_details.listing_events for pre-trigger history.
Tax reassessment forecast TX · Resets to sale price
- Current annual tax
- $3,801 · $317/mo
- Projected year-2 tax
- $3,801 · $317/mo
- Expected delta
- $0/yr ($0/mo · 0.0%)
ⓘ Screening estimate from a state-policy table — verify with the county assessor before closing.
Climate risk First Street
- Flood 1/10 Low FEMA zone X (unshaded) · 0% chance over 30 yrs
- Wildfire 3/10 Moderate
- Heat 9/10 Extreme 7 d/yr ≥109°F today · 22 d/yr by 30 yrs out
- Wind 9/10 Extreme 99% chance of damaging wind over 30 yrs
- Air quality 2/10 Low 0 unhealthy d/yr today · 1 by 30 yrs out
Nearby sold comps map
Loading sold comps map…
Walkable amenities ~0.75 mi
Loading nearby amenities…
Taxation est. · year 1
- Rental income
- $16,687
- − Mortgage interest
- −$9,495
- − Property taxes
- −$3,801
- − Insurance
- −$848
- − Repairs & maintenance
- −$1,335
- − Management
- −$1,335
- − Depreciation
- −$4,931
- Taxable loss
- −$5,057
- Est. tax savings @ 24.0%
- +$1,214
- After-tax cash flow
- $-918/yr
For passive investors: Depreciation is non-cash, so a rental often shows a tax loss while cash-flowing — sheltering income. Rental losses are passive: they offset passive income freely, and up to $25,000/yr can offset ordinary (W-2) income if you actively participate and your MAGI is under $100k (phasing out to $0 by $150k); unused losses carry forward. On sale, claimed depreciation is recaptured at up to 25%, and gains may owe capital-gains tax (a 1031 exchange can defer both). Figures are a year-1 estimate at your 24.0% rate — not tax advice; consult a CPA.
Schools (NCES district)
- District
- Bay City ISD
- NCES district ID
- 4809630
- Math proficiency
- 31% ▼ -8.00%
- Reading proficiency
- 31% ▼ -3.00%
- Median HH income
- $43,285
- Composite
- 26.4/100
- National rank
- #7229
- State rank
- #604 of 826 in TX
Livability — Bay City
- Score
- 71/100
- State rank
- #311
- US rank
- #7004
Category grades
Schools grade is shown separately in the Schools card above.
Census & demographics
- Census place
- Bay City, TX
- County
- Matagorda County · 24,334 people
- City population
- 24,334
- Metro
- Bay City, TX
- Population (ZIP)
- 24,334
- Household income
- $59,128
- Rent vs Own
- Severe rent burden
- 1228.0
Population outlook (Matagorda County) Hauer SSP2
- Today (2025)
- 37,148 people
- By 2030
- 37,082 · -0.2%
- By 2040
- 36,987 · -0.4%
- By 2050
- 36,934 · -0.6%
- By 2075
- 37,178 · +0.1%
- By 2100
- 35,184 · -5.3%
Race, ethnicity, and origin ACS 2023
- Neighborhood character
- Diverse neighborhood (Simpson 0.65)
- Race & ethnicity
- Hispanic / Latino 43% White 39% Black 13% Two or more races 13% Asian 2%
- Hispanic origin (detail)
- Mexican 37% Puerto Rican 1%
- Common ancestry
- Lithuanian 1% Slovak 1% Serbian 1%
- Foreign-born
- 12% · Canada
- Languages at home
- 71% English-only · Spanish 26% Other Indo-European 2% German/W. Germanic 1%
Political lean MEDSL · Matagorda
- 2024 margin
- Solid R (+50.5) · D 24.3% · R 74.8%
- 2008→2024 swing
- -23.1pp toward R · 2008: -27.4pp · 2024: -50.5pp
- All cycles
- 2024: R+50.5 2020: R+44.5 2016: R+40.7 2012: R+33.5 2008: R+27.4
Not yet ingested
- Civics
- —
Market trends
- HPI YoY
- ▼ -36.31%
- Current HPI
- 168.9985
- Rent YoY
- ▲ 3.28%
- Metro
- Bay City, TX
- State GDP YoY
- ▲ 3.95%
- F500 in state
- 110
Industry mix (Fortune 500 HQ in TX)
| Industry | F500 HQs | Revenue |
|---|---|---|
| Energy | 16 | $1,198B |
|
||
| Technology | 5 | $198B |
|
||
| Engineering / Construction | 4 | $72B |
|
||
| Energy Services | 3 | $60B |
|
||
| Utilities | 3 | $41B |
|
||
| Healthcare | 2 | $330B |
|
||
Price history
-4.1% since first listed4 events — show timeline
- 2026-05-05 Price Changed $176,900 HARMLS
- 2026-04-08 Listed $184,500 HARMLS
- 2022-12-07 Sold (Public Records) — Public Records
- 2010-11-24 Sold (Public Records) — Public Records
Property tax history
+3.4%/yrLatest (2025): $3,801 · -1.0% YoY. Source: county tax records.
Cash-flow waterfall
monthlySold comps — $/sqft
last 12 mo · ≤1 miLoading sold comps…