 Fourplex
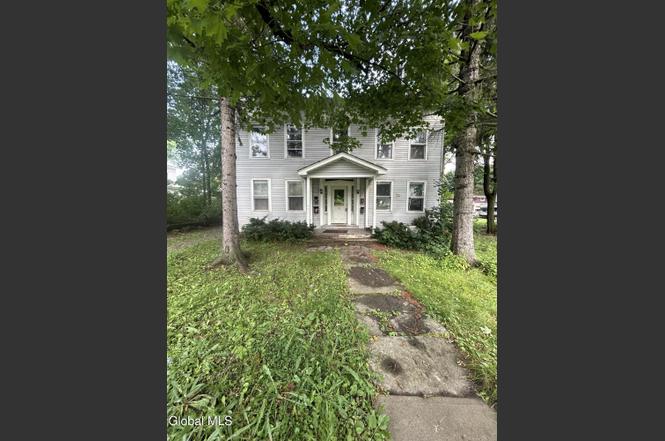
44 Otsego St · Canajoharie, NY
Flood risk 1/10 · Minimal
- FEMA flood zone
- X (unshaded)
- Chance of flooding over 30 yrs
- 0.0%
- Est. flood insurance / yr
- $473 – $860
Fire risk 1/10 · Minimal
- Est. fire insurance / yr
- $691 – $1,283
Heat risk 3/10 · Minor
- Hot days now (above 96°F)
- 7 days/yr
- Hot days in 30 yrs
- 17 days/yr
Wind risk 2/10 · Minimal
- Chance of severe wind over 30 yrs
- 2.0%
Air-quality risk 1/10 · Minimal
- Unhealthy air days now
- 0 days/yr
- Unhealthy air days in 30 yrs
- 0 days/yr
Risk factors via First Street. Map © Google.
Why this score? — see what drove the B+ grade
The composite is a weighted blend of 9 inputs, each scored 0–100. Each bar is that input's sub-score; the figure is the points it added to the 100-point composite (weight × sub-score).
- Cash flow +30.0/30.0
- 1% rule +10.0/10.0
- DSCR +10.0/10.0
- Appreciation +9.7/10.0
- ARV discount +7.5/15.0
- Schools +4.1/10.0
- Livability +3.5/5.0
- Rent growth +2.5/5.0
- Condition / age +2.5/5.0
$120,000
🖨 Deal sheet 📄 Offer letter ✓ Due diligence
Multi-family units
County records classify this as Multi-Family (5+ Unit). Listing-text estimate: 4 units. estimate disagrees with records
5+ unit building — per-unit beds/baths from public records are typically unavailable; the breakdown below (if shown) is an estimate from the listing text.
Listing remarks MLS
Cash Flowing 4 Unit close to I-90. All separate utilities, metal roof, and rear parking area for all tenants. Great for the first time investor or adding to an existing portfolio.
Key facts
- Currently vacant
- Close to i-90
- 4 unit property
Tags
Neighborhood map
What this means for you Summary
Snapshot
- This is a 4 × 6-bed/4.0-bath units multifamily listed at $120k.
Deal economics
- At list price, monthly cash flow is $3k ($36k/yr) — positive. Per door: $746/mo.
- The deal already cash-flows at list — no discount required.
- Meets the 1% rule at list price ($5k rent vs $120k).
- Recommended offer: $109k (9.0% below list) — sets the bar for market timing.
Location & tenants
- Location reads 69/100 on livability (#510 in NY) — a middle-class / working-renter tenant base. Strengths: cost of living A+, health & safety A+, crime A-; Watch: amenities F, commute F, employment F.
- Canajoharie Central School District (town): math 38% / reading 59% proficiency, ranked #414 of 590 in NY (top 70%) — families likely to look elsewhere, expect single-tenant / working-renter base with shorter leases.
- Market conditions: 30 active listings in the ZIP; 210 units permitted in Montgomery County in 2024 (168 in 5+ unit buildings).
Forward outlook
- In year one you build about $12k of equity ($830 loan paydown + $11k appreciation (9.5% local appreciation)).
- Montgomery County population projected at -11% by 2050 — secular population decline; favor cash flow + early exit over multi-decade hold.
- At projected returns (9.5% appreciation + 3.0% rent growth), your $34k cash investment doubles in ~1 year — after that, you're playing with house money.
- By year 3, paydown + projected appreciation supports a ~$31k cash-out refi (75% LTV) — recoverable capital for the next deal without selling this one.
Negotiation context
- It's been on market 95 days — a 9% lower offer ($109k) is reasonable based on typical stale-listing flexibility.
- 5 sale attempts since 2y ago with the ask held roughly flat each time — persistent listings suggest the price (not the market) is what's stuck; bring a comps-based counter.
Questions for the listing agent
- It's been on market 95 days. Have you received any prior offers? Is the seller open to a 9% concession, seller financing, or rate buy-down credit?
- Can we see the unit-by-unit rent roll, current vacancy, and any below-market leases? What's the average tenancy length?
- What capital expenditures (roof, boiler, parking lot, exteriors) have been made in the last 5 years, and what's planned in the next 2?
- Built in 1960 — when were the roof, HVAC, electrical panel, plumbing, and water heater last replaced?
- Why hasn't it sold? Are there any deal-killer items the seller is aware of (foundation, flood, title, zoning, code violations)?
- Is there a deadline driving the sale (1031 exchange, divorce, estate, relocation)? That informs how much negotiation room exists.
- What's the average days-on-market for RENTAL listings here right now (not sales)? A rising rental-DOM trend means longer vacancies and softer asking-rent achievability than the comps imply.
- What's the recent tenant-quality profile in this submarket — average credit score on applications, eviction rate, late-payment / NSF rate, and stable-employment percentage? A property-management company in the area should have these aggregated.
- How much new apartment / multifamily construction is in the pipeline within 1–3 miles? Heavy new supply (>2% of stock underway) typically softens rents 12–24 months out; light construction supports rent growth.
Investment metrics
- 1% rule
- 4.02% ✓
- Cap rate
- 36.15%
- Cash-on-cash
- 106.63%
- DSCR
- 5.74
- GRM
- 2.1
CMA / ARV
No comps found within radius.
Projected returns pro-forma
9.48% appreciation · 3.0% rent growth · sell at horizon
- IRR
- —
- Equity multiple
- 8.48×
- Total profit
- $251,371
- Equity at exit
- $103,624
- IRR
- —
- Equity multiple
- 18.55×
- Total profit
- $589,847
- Equity at exit
- $218,865
Cash invested: $33,600 (down + closing). Projections, not guarantees.
Landlord ↔ Tenant lean methodology
- Overall (STATE)
- 15 Strongly Tenant-Friendly
- State New York
- 15 Strongly Tenant-Friendly · D+10
- County
- — inherits STATE
- City
- — inherits STATE
ZIP-level market 13317
- Home prices YoY
- 3.2%
- Active inventory
- 30
- Price-to-rent
- 8.3×
Monthly cashflow live
- Estimated rent
- $4,829 medium interval (Pro) →
- Mortgage (P&I)
- −$629
- Tax est. 1.5%
- −$150 /mo · $1,800/yr
- Insurance
- −$50
- HOA
- −$0
- Vacancy / Maint / Mgmt
- −$1,014
- Net cashflow
- $2,986
Break-even live
4-unit breakdown (identical units grouped — click to expand)
| Units | Beds | Baths | Est. rent |
|---|---|---|---|
| 4× units | 6 | 4 | $4,828 |
| #1 | 6 | 4 | $1,207 |
| #2 | 6 | 4 | $1,207 |
| #3 | 6 | 4 | $1,207 |
| #4 | 6 | 4 | $1,207 |
| Total (4 units) | $4,829 | ||
UW: 25.0% down · 7.5% · 30yr · 1.5% tax · 5.0% vac · 8.0% maint · 8.0% mgmt
Financing live
Cash to close
- Down payment
- $30,000
- Closing costs
- $3,600
- Reserves months
- —
- Total cash needed
- —
Loan-product check · same deal, 3 products live
Conventional
25% down · 7.5% · 30yr
- Down + closing
- —
- Monthly P&I
- —
- Monthly cashflow
- —
- DSCR
- —
- Eligible?
- —
Personal DTI + credit; lowest rate.
DSCR
20% down · 8.5% · 30yr
- Down + closing
- —
- Monthly P&I
- —
- Monthly cashflow
- —
- DSCR
- —
- Eligible?
- —
No personal income docs; deal must DSCR.
Hard money
10% down · 12.0% · 12mo
- Down + closing
- —
- Monthly P&I
- —
- Monthly cashflow
- —
- DSCR
- —
- Eligible?
- —
Short-term bridge; refi at stabilization.
Listing history 18 events
-
2026-04-23status Pending
-
2026-02-13price $120,000
-
2026-01-16$125,000 Active
-
2025-11-04price $125,000
-
2025-10-27status Active
-
2025-08-14status Pending
-
2025-08-14historical
-
2025-07-16$132,000 Active
-
2024-08-08soldstatus $127,000 Closed 179-char remark
Show marketing remark (179 chars)
Cash Flowing 4 Unit close to I-90. All separate utilities, metal roof, and rear parking area for all tenants. Great for the first time investor or adding to an existing portfolio.
-
2024-07-22soldstatus $127,000
-
2024-07-18soldstatus $127,000 Closed
-
2024-04-02historical Contingent
-
2024-04-01status Pending 179-char remark
Show marketing remark (179 chars)
Cash Flowing 4 Unit close to I-90. All separate utilities, metal roof, and rear parking area for all tenants. Great for the first time investor or adding to an existing portfolio.
-
2024-04-01status Pending
Show marketing remark (179 chars)
Cash Flowing 4 Unit close to I-90. All separate utilities, metal roof, and rear parking area for all tenants. Great for the first time investor or adding to an existing portfolio.
-
2024-03-20$144,900 Active 179-char remark
Show marketing remark (179 chars)
Cash Flowing 4 Unit close to I-90. All separate utilities, metal roof, and rear parking area for all tenants. Great for the first time investor or adding to an existing portfolio.
-
2024-03-20$144,900 Active
Show marketing remark (179 chars)
Cash Flowing 4 Unit close to I-90. All separate utilities, metal roof, and rear parking area for all tenants. Great for the first time investor or adding to an existing portfolio.
-
2020-08-04soldstatus $102,500
-
1994-08-02soldstatus $35,000
ⓘ Source: listings_history table (triggers on properties + properties_extension) + one-shot
backfill from property_details.listing_events for pre-trigger history.
Climate risk First Street
- Flood 1/10 Low FEMA zone X (unshaded) · 0% chance over 30 yrs
- Wildfire 1/10 Low
- Heat 3/10 Moderate 7 d/yr ≥96°F today · 17 d/yr by 30 yrs out
- Wind 2/10 Low 2% chance of damaging wind over 30 yrs
- Air quality 1/10 Low 0 unhealthy d/yr today · 0 by 30 yrs out
Nearby sold comps map
Loading sold comps map…
Walkable amenities ~0.75 mi
Loading nearby amenities…
Taxation est. · year 1
- Rental income
- $57,948
- − Mortgage interest
- −$6,722
- − Property taxes
- −$1,800
- − Insurance
- −$600
- − Repairs & maintenance
- −$4,636
- − Management
- −$4,636
- − Depreciation
- −$3,491
- Taxable income
- $36,064
- Est. tax owed @ 24.0%
- −$8,655
- After-tax cash flow
- $27,172/yr
For passive investors: Depreciation is non-cash, so a rental often shows a tax loss while cash-flowing — sheltering income. Rental losses are passive: they offset passive income freely, and up to $25,000/yr can offset ordinary (W-2) income if you actively participate and your MAGI is under $100k (phasing out to $0 by $150k); unused losses carry forward. On sale, claimed depreciation is recaptured at up to 25%, and gains may owe capital-gains tax (a 1031 exchange can defer both). Figures are a year-1 estimate at your 24.0% rate — not tax advice; consult a CPA.
Schools (NCES district)
- District
- Canajoharie Central School District
- NCES district ID
- 3606300
- Math proficiency
- 38% ▼ -12.00%
- Reading proficiency
- 59% ▲ 10.00%
- Median HH income
- $49,296
- Composite
- 41.39/100
- National rank
- #3482
- State rank
- #414 of 590 in NY
Livability — Canajoharie
- Score
- 69/100
- State rank
- #510
- US rank
- #9061
Category grades
Schools grade is shown separately in the Schools card above.
Census & demographics
- Census place
- Canajoharie, NY
- Population (ZIP)
- 3,970
Population outlook (Montgomery County) Hauer SSP2
- Today (2025)
- 48,683 people
- By 2030
- 47,785 · -1.8%
- By 2040
- 45,492 · -6.6%
- By 2050
- 43,161 · -11.3%
- By 2075
- 38,134 · -21.7%
- By 2100
- 32,337 · -33.6%
Race, ethnicity, and origin ACS 2023
- Neighborhood character
- Predominantly White (95%)
- Race & ethnicity
- White 95% Two or more races 3% Hispanic / Latino 2%
- Common ancestry
- Iranian 5% Romanian 3% Lithuanian 3%
- Foreign-born
- 1% · Canada
- Languages at home
- 79% English-only · German/W. Germanic 19% Spanish 1% French/Haitian/Cajun 1%
Political lean MEDSL · Montgomery
- 2024 margin
- Strong R (+28.7) · D 35.6% · R 64.4%
- 2008→2024 swing
- -20.6pp toward R · 2008: -8.1pp · 2024: -28.7pp
- All cycles
- 2024: R+28.7 2020: R+22.6 2016: R+26.5 2012: R+4.4 2008: R+8.1
Not yet ingested
- Civics
- —
Market trends
- HPI YoY
- ▲ 9.48%
- Current HPI
- 303.1499
- Rent YoY
- —
- Metro
- —
- State GDP YoY
- ▲ 2.60%
- F500 in state
- 92
Industry mix (Fortune 500 HQ in NY)
| Industry | F500 HQs | Revenue |
|---|---|---|
| Financial Services | 10 | $950B |
|
||
| Consumer Goods | 9 | $162B |
|
||
| Insurance | 4 | $225B |
|
||
| Telecommunications | 2 | $144B |
|
||
| Pharmaceuticals | 2 | $112B |
|
||
| Media / Entertainment | 2 | $69B |
|
||
Price history
+242.9% since first listed18 events — show timeline
- 2026-04-23 Pending — Global MLS
- 2026-02-13 Price Changed $120,000 Global MLS
- 2026-01-16 Listed $125,000 Global MLS
- 2025-11-04 Price Changed $125,000 Global MLS
- 2025-10-27 Relisted — Global MLS
- 2025-08-14 Pending — Global MLS
- 2025-08-14 Listing Removed — Global MLS
- 2025-07-16 Listed $132,000 Global MLS
- 2024-08-08 Sold (MLS) $127,000 CNYIS
- 2024-07-22 Sold (Public Records) $127,000 Public Records
- 2024-07-18 Sold (MLS) $127,000 Global MLS
- 2024-04-02 Contingent — Global MLS
- 2024-04-01 Pending — CNYIS
- 2024-04-01 Pending — Global MLS
- 2024-03-20 Listed $144,900 Global MLS
- 2024-03-20 Listed $144,900 CNYIS
- 2020-08-04 Sold (Public Records) $102,500 Public Records
- 1994-08-02 Sold (Public Records) $35,000 Public Records
Property tax history
+3.8%/yrLatest (2025): $7,521 · +11.9% YoY. Source: county tax records.
Cash-flow waterfall
monthlySold comps — $/sqft
last 12 mo · ≤1 miLoading sold comps…