13058 Aspen Way Ct · Willis, TX
Flood risk 1/10 · Minimal
- FEMA flood zone
- X (unshaded)
- Chance of flooding over 30 yrs
- 0.0%
- Est. flood insurance / yr
- $507 – $1,088
Fire risk 5/10 · Moderate
- Est. fire insurance / yr
- $1,222 – $2,270
Heat risk 8/10 · Major
- Hot days now (above 111°F)
- 7 days/yr
- Hot days in 30 yrs
- 24 days/yr
Wind risk 8/10 · Major
- Chance of severe wind over 30 yrs
- 99.0%
Air-quality risk 2/10 · Minimal
- Unhealthy air days now
- 1 days/yr
- Unhealthy air days in 30 yrs
- 1 days/yr
Risk factors via First Street. Map © Google.
Why this score? — see what drove the B- grade
The composite is a weighted blend of 9 inputs, each scored 0–100. Each bar is that input's sub-score; the figure is the points it added to the 100-point composite (weight × sub-score).
- Cash flow +29.5/30.0
- DSCR +10.0/10.0
- 1% rule +8.1/10.0
- ARV discount +7.5/15.0
- Schools +3.2/10.0
- Livability +3.1/5.0
- Condition / age +2.5/5.0
- Rent growth +2.0/5.0
- Appreciation +0.0/10.0
$99,950
🖨 Deal sheet 📄 Offer letter ✓ Due diligence
Listing remarks MLS
Excellent cozy home tucked into a quiet cul de sac. 2 Bedroom, 2 Bath with a large garden tub & shower in the primary bathroom. Large lot in established subdivision, close to I45 and 1097 shopping and dining.
Key facts
- Peaceful cul-de-sac
- Quiet neighborhood
- 6,499 sq ft lot
Tags
Property features AI
Finance
- Financial info: Lease considered
- HOA & community: Pin Oak POA with an annual fee of $225
Exterior
- Parking: No parking
- Utilities: Public water; Public sewer
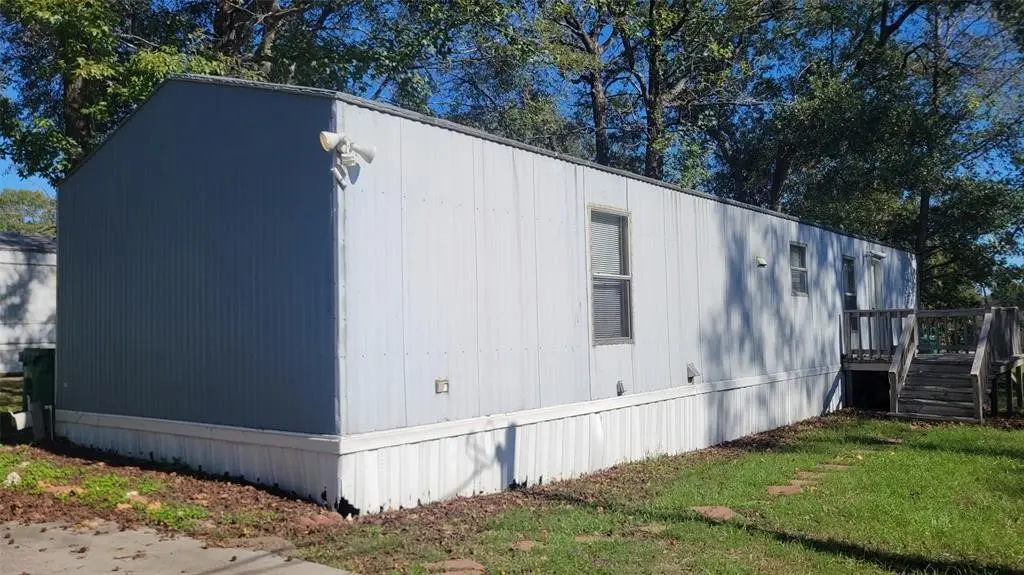
- Home design: Residential property; Built in 1999
- Construction: Aluminum siding; Metal roof; Built in 1999
- Exterior features: Subdivision lot
Interior
- Kitchen: Dishwasher; Electric oven; Electric range; Microwave
- Bedrooms: Primary bedroom on the first floor (15 x 12)
- Bathrooms: 2 full bathrooms
- Heating & cooling: Central heating (electric); Central air conditioning (electric)
- Interior features: Electric dryer hookup; Dishwasher; Electric oven; Electric range; Microwave
- Laundry & utility: Electric dryer hookup
Neighborhood map
What this means for you Summary
Snapshot
- This is a 2-bed/2.0-bath manufactured listed at $100k.
Deal economics
- At list price, monthly cash flow is $358 ($4k/yr) — positive.
- The deal already cash-flows at list — no discount required.
- Meets the 1% rule at list price ($1k rent vs $100k).
- Recommended offer: $98k (1.5% below list) — sets the bar for market timing.
- Cap rate 10.6% vs local median 4.7% in Willis — top-decile yield for the area; either an underpriced asset or a hidden risk that comps aren't pricing in. Stress-test before assuming the spread holds.
Location & tenants
- Location reads 62/100 on livability (#933 in TX) — a middle-class / working-renter tenant base. Strengths: cost of living A+, housing A+; Watch: crime C-, employment D+, amenities F.
- Willis ISD (rural): math 33% / reading 40% proficiency, ranked #458 of 826 in TX (top 55%) — families likely to look elsewhere, expect single-tenant / working-renter base with shorter leases.
- Zoned schools: Lynn Lucas Middle (math 23% / reading 32%, grade F, #1,156 of 1,662 statewide, top 71%, 971 students, 74% FRL); Willis H S (math 19% / reading 46%, grade F, #1,029 of 1,632 statewide, top 64%, 2,521 students, 57% FRL).
- Market conditions: Rents soft (-2.1%/yr); 1189 active listings in the ZIP; 5 comparable units currently listed for rent nearby; rentals lingering (median 44d on market — plan ~5-8 weeks vacancy on turnover, expect pricing pressure); 60% of comp listings sitting > 30 days — soft ceiling on asking rent; solid renter incomes; 13,259 units permitted in Montgomery County in 2024 (1,402 in 5+ unit buildings).
- This rent is only 17% of the median local income ($92k/yr) — well below the 30% rent-burden line; pricing power to push rent on renewal without tenant pushback.
Forward outlook
- Local home prices are declining (-3.0%/yr); year-one equity from $692 of loan paydown is wiped out by about $3k of value loss. Plan a longer hold.
- Montgomery County population projected at +65% by 2050 — long-run rental-demand tailwind backs the buy-and-hold thesis.
Negotiation context
- It's been on market 20 days — a 2% lower offer ($98k) is reasonable based on typical stale-listing flexibility.
- 6 sale attempts since 23y ago; this cycle's ask is 10421% above the opening price — seller raised mid-cycle; expect resistance to lowballs.
Risks & watch-outs
- Climate carrying-cost: severe wind risk, 99% chance of damaging wind over 30y; moderate wildfire risk; extreme-heat days projected 7→24/yr by 2055 (HVAC capex compounding) — expect insurance premiums to compound above CPI over the hold.
Questions for the listing agent
- What does the HOA fee cover, when was the last increase, and are there any pending special assessments or reserve-fund shortfalls?
- Is there a deadline driving the sale (1031 exchange, divorce, estate, relocation)? That informs how much negotiation room exists.
- Schools are D-rated, which usually means shorter tenancies and higher turnover. Who's the typical renter profile here, and what's been the actual vacancy rate?
- What's the average days-on-market for RENTAL listings here right now (not sales)? A rising rental-DOM trend means longer vacancies and softer asking-rent achievability than the comps imply.
- What's the recent tenant-quality profile in this submarket — average credit score on applications, eviction rate, late-payment / NSF rate, and stable-employment percentage? A property-management company in the area should have these aggregated.
- How much new for-sale + rental construction is in the pipeline within 1–3 miles? Heavy new supply typically softens prices + rents 12–24 months out; constrained supply supports both.
Investment metrics
- 1% rule
- 1.31% ✓
- Cap rate
- 10.60%
- Cash-on-cash
- 15.37%
- DSCR
- 1.68
- GRM
- 6.3
CMA / ARV
No comps found within radius.
Projected returns pro-forma
-3.0% appreciation · 0.0% rent growth · sell at horizon
- IRR
- 2.7%
- Equity multiple
- 1.10×
- Total profit
- $2,801
- Equity at exit
- $14,903
- IRR
- 9.2%
- Equity multiple
- 1.61×
- Total profit
- $17,027
- Equity at exit
- $8,642
Cash invested: $27,986 (down + closing). Projections, not guarantees.
Landlord ↔ Tenant lean methodology
- Overall (STATE)
- 87 Strongly Landlord-Friendly
- State Texas
- 87 Strongly Landlord-Friendly · R+5
- County
- — inherits STATE
- City
- — inherits STATE
ZIP-level market 77318
- Home prices YoY
- -32.7%
- Rents YoY
- -2.1%
- Active inventory
- 1189
- Price-to-rent
- 6.3×
Monthly cashflow live
- Estimated rent
- $1,312 high interval (Pro) →
- Mortgage (P&I)
- −$524
- Tax from tax record
- −$93 /mo · $1,116/yr
- Insurance
- −$42
- HOA
- −$19
- Vacancy / Maint / Mgmt
- −$275
- Net cashflow
- $358
Break-even live
UW: 25.0% down · 7.5% · 30yr · 1.5% tax · 5.0% vac · 8.0% maint · 8.0% mgmt
Financing live
Cash to close
- Down payment
- $24,988
- Closing costs
- $2,998
- Reserves months
- —
- Total cash needed
- —
Loan-product check · same deal, 3 products live
Conventional
25% down · 7.5% · 30yr
- Down + closing
- —
- Monthly P&I
- —
- Monthly cashflow
- —
- DSCR
- —
- Eligible?
- —
Personal DTI + credit; lowest rate.
DSCR
20% down · 8.5% · 30yr
- Down + closing
- —
- Monthly P&I
- —
- Monthly cashflow
- —
- DSCR
- —
- Eligible?
- —
No personal income docs; deal must DSCR.
Hard money
10% down · 12.0% · 12mo
- Down + closing
- —
- Monthly P&I
- —
- Monthly cashflow
- —
- DSCR
- —
- Eligible?
- —
Short-term bridge; refi at stabilization.
Rent comps 5 comps
| Address | Beds | Baths | Sqft | Rent | $/sqft | DOM | Units | Dist |
|---|---|---|---|---|---|---|---|---|
| 214 Longstreet Rd Unit 4 Willis, TX | 1.0 | 1.0 | 561 | $750 | $1.34 | 43d | 1 | 0.60mi |
| 100 Lamar St Willis, TX | 2.0 | 1.0 | 900 | $1,200 | $1.33 | 24d | 1 | 0.70mi |
| 9700 FM 1097 Rd W Willis, TX | 2.0–3.0 | 2.0 | 1115 | $1,268 | $1.14 | 1d | 6 | 0.72mi |
| 9706 Farm to Market 1097 Willis, TX | 2.0 | 2.0 | 1068 | $1,030 | $0.96 | 43d | 1 | 0.78mi |
| 203 E Watson St Willis, TX | 1.0 | 1.0 | 700 | $1,063 | $1.52 | 43d | 1 | 1.31mi |
HOA detail
- Monthly dues
- $19 · $228/yr
Listing history 13 events
-
2026-06-18days on market $99,950 Active 20 DOM
-
2026-06-17days on market $99,950 Active 19 DOM
-
2026-06-16days on market $99,950 Active 18 DOM
-
2026-06-15days on market $99,950 Active 17 DOM
-
2026-06-13days on market $99,950 Active 15 DOM
-
2026-06-09days on market $99,950 Active 11 DOM
-
2026-06-08days on market $99,950 Active 10 DOM
-
2026-06-07days on market $99,950 Active 9 DOM
-
2026-06-04days on market $99,950 Active 6 DOM
-
2026-06-03days on market $99,950 Active 5 DOM
-
2026-06-02days on market $99,950 Active 4 DOM
-
2026-06-01days on market $99,950 Active 3 DOM
-
2026-05-31days on market $99,950 Active 2 DOM
ⓘ Source: listings_history table (triggers on properties + properties_extension) + one-shot
backfill from property_details.listing_events for pre-trigger history.
Tax reassessment forecast TX · Resets to sale price
- Current annual tax
- $1,116 · $93/mo
- Projected year-2 tax
- $1,829 · $152/mo
- Expected delta
- +$713/yr (+$59/mo · 63.9%)
ⓘ Screening estimate from a state-policy table — verify with the county assessor before closing.
Climate risk First Street
- Flood 1/10 Low FEMA zone X (unshaded) · 0% chance over 30 yrs
- Wildfire 5/10 Major
- Heat 8/10 Severe 7 d/yr ≥111°F today · 24 d/yr by 30 yrs out
- Wind 8/10 Severe 99% chance of damaging wind over 30 yrs
- Air quality 2/10 Low 1 unhealthy d/yr today · 1 by 30 yrs out
Nearby sold comps map
Loading sold comps map…
Walkable amenities ~0.75 mi
Loading nearby amenities…
Taxation est. · year 1
- Rental income
- $15,741
- − Mortgage interest
- −$5,599
- − Property taxes
- −$1,116
- − Insurance
- −$500
- − Repairs & maintenance
- −$1,259
- − Management
- −$1,259
- − HOA
- −$228
- − Depreciation
- −$2,908
- Taxable income
- $2,872
- Est. tax owed @ 24.0%
- −$689
- After-tax cash flow
- $3,612/yr
For passive investors: Depreciation is non-cash, so a rental often shows a tax loss while cash-flowing — sheltering income. Rental losses are passive: they offset passive income freely, and up to $25,000/yr can offset ordinary (W-2) income if you actively participate and your MAGI is under $100k (phasing out to $0 by $150k); unused losses carry forward. On sale, claimed depreciation is recaptured at up to 25%, and gains may owe capital-gains tax (a 1031 exchange can defer both). Figures are a year-1 estimate at your 24.0% rate — not tax advice; consult a CPA.
Schools (NCES district)
- District
- Willis ISD
- NCES district ID
- 4845900
- Math proficiency
- 33% ▼ -15.00%
- Reading proficiency
- 40% ▼ -2.00%
- Median HH income
- $57,828
- Composite
- 32.32/100
- National rank
- #5746
- State rank
- #458 of 826 in TX
Livability — Willis
- Score
- 62/100
- State rank
- #933
- US rank
- #16579
Category grades
Schools grade is shown separately in the Schools card above.
Census & demographics
- Census place
- Willis, TX
- County
- Montgomery County · 663,713 people
- City population
- 38,421
- Metro
- Houston-The Woodlands-Sugar Land, TX
- Population (ZIP)
- 20,792
- Household income
- $92,415
- Rent vs Own
- Severe rent burden
- 279.0
Population outlook (Montgomery County) Hauer SSP2
- Today (2025)
- 713,896 people
- By 2030
- 805,263 · +12.8%
- By 2040
- 992,708 · +39.1%
- By 2050
- 1,179,590 · +65.2%
- By 2075
- 1,628,084 · +128.1%
- By 2100
- 1,937,880 · +171.5%
Race, ethnicity, and origin ACS 2023
- Neighborhood character
- Predominantly White (72%)
- Race & ethnicity
- White 72% Hispanic / Latino 17% Two or more races 14% Black 3%
- Hispanic origin (detail)
- Mexican 12%
- Common ancestry
- Lithuanian 4% Slovak 2% Serbian 2%
- Foreign-born
- 6% · Canada, Jamaica
- Languages at home
- 88% English-only · Spanish 10%
Political lean MEDSL · Montgomery
- 2024 margin
- Solid R (+45.5) · D 26.8% · R 72.3%
- 2008→2024 swing
- +7.2pp toward D · 2008: -52.7pp · 2024: -45.5pp
- All cycles
- 2024: R+45.5 2020: R+43.8 2016: R+51.4 2012: R+60.7 2008: R+52.7
Not yet ingested
- Civics
- —
Market trends
- HPI YoY
- ▼ -114.58%
- Current HPI
- 236.256
- Rent YoY
- ▼ -2.09%
- Metro
- Houston-The Woodlands-Sugar Land, TX
- State GDP YoY
- ▲ 3.95%
- F500 in state
- 110
Industry mix (Fortune 500 HQ in TX)
| Industry | F500 HQs | Revenue |
|---|---|---|
| Energy | 16 | $1,198B |
|
||
| Technology | 5 | $198B |
|
||
| Engineering / Construction | 4 | $72B |
|
||
| Energy Services | 3 | $60B |
|
||
| Utilities | 3 | $41B |
|
||
| Healthcare | 2 | $330B |
|
||
Price history
+234.3% since first listed14 events — show timeline
- 2026-05-30 Listed for Rent $950 HARMLS
- 2026-05-29 Listed $99,950 HARMLS
- 2024-12-10 Listing Removed — HARMLS
- 2024-11-15 Listed $89,950 HARMLS
- 2021-03-23 Sold (Public Records) — Public Records
- 2021-03-23 Sold (MLS) — HARMLS
- 2021-03-08 Pending — HARMLS
- 2021-03-03 Listed $60,000 HARMLS
- 2021-03-03 Listing Removed — HARMLS
- 2021-03-02 Price Changed $60,000 HARMLS
- 2021-02-10 Price Changed $65,000 HARMLS
- 2021-01-22 Listed $70,000 HARMLS
- 2003-05-15 Listing Removed — HARMLS
- 2003-02-11 Listed $29,900 HARMLS
Property tax history
+5.2%/yrLatest (2025): $1,116 · -14.2% YoY. Source: county tax records.
Cash-flow waterfall
monthlySold comps — $/sqft
last 12 mo · ≤1 miLoading sold comps…