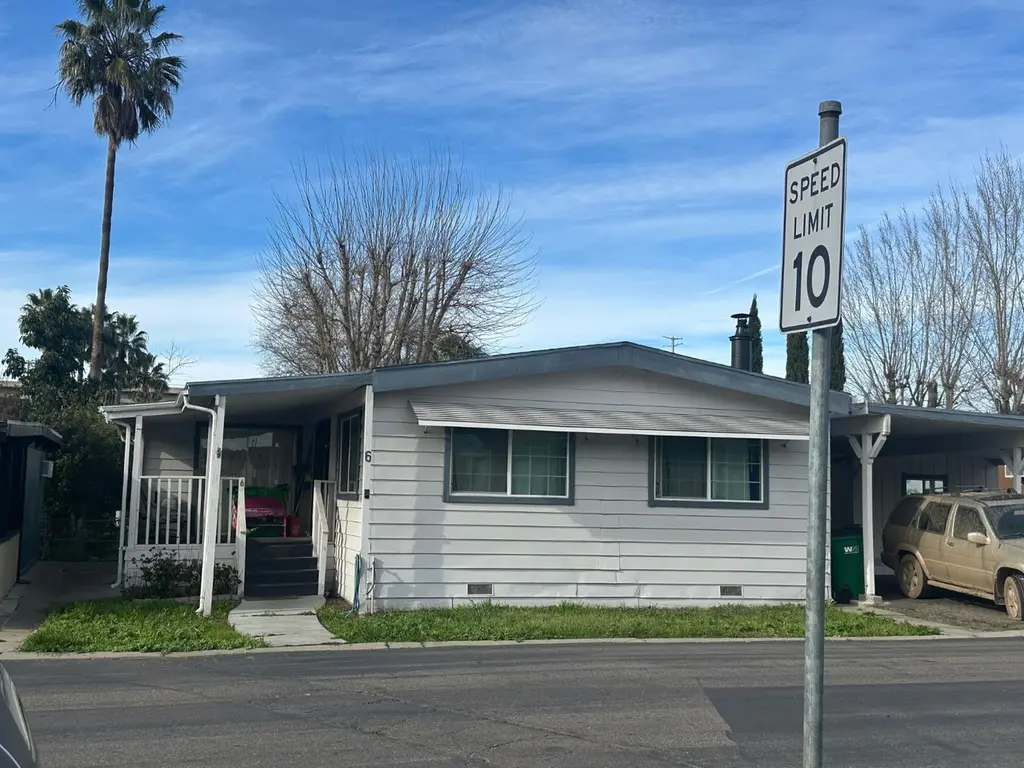
6 Softwind · Terminous, CA
Flood risk 4/10 · Minor
- FEMA flood zone
- AE
- Chance of flooding over 30 yrs
- 0.13%
- Est. flood insurance / yr
- $1,737 – $8,500
Fire risk 3/10 · Minor
- Est. fire insurance / yr
- $659 – $1,223
Heat risk 7/10 · Major
- Hot days now (above 101°F)
- 7 days/yr
- Hot days in 30 yrs
- 16 days/yr
Wind risk 1/10 · Minimal
- Chance of severe wind over 30 yrs
- —
Air-quality risk 10/10 · Severe
- Unhealthy air days now
- 25 days/yr
- Unhealthy air days in 30 yrs
- 26 days/yr
Risk factors via First Street. Map © Google.
Why this score? — see what drove the C- grade
The composite is a weighted blend of 9 inputs, each scored 0–100. Each bar is that input's sub-score; the figure is the points it added to the 100-point composite (weight × sub-score).
- Cash flow +16.0/30.0
- ARV discount +15.0/15.0
- 1% rule +5.4/10.0
- DSCR +4.9/10.0
- Rent growth +3.6/5.0
- Schools +2.7/10.0
- Livability +2.5/5.0
- Condition / age +2.5/5.0
- Appreciation +0.0/10.0
$250,000
🖨 Deal sheet (PDF) 📄 Offer letter ✓ Due diligence
Listing remarks
Close to Tower Park! Manufactured home on owned land (no space rent) priced to sell and needs a little TLC. Great upside in Lodi 95242. Opportunity in Lodi! * * 6 Softwood Drive features a manufactured home on owned land (no space rent) * * and is * * close to Tower Park * * , with easy access to shopping, dining, and commuter routes. The home offers a functional layout and a yard with room to personalize and make it your own. * * Priced to sell and needing a little TLC * * , this is a great chance for a buyer looking to add value through updates. Come see the potential and envision the possibilities! This is a contingent sale of the owner finding a replacement property!
Key facts
- Close to tower park
- 5,214 sq ft lot
- 4 parking spots
Tags
Neighborhood map
What this means for you Summary
Snapshot
- This is a 3-bed/2.0-bath land listed at $250k.
Deal economics
- At list price, monthly cash flow is $-305 ($-4k/yr) — negative.
- To cash-flow at today's rent, offer at most $196k (21.5% below list).
- Meets the 1% rule at list price ($3k rent vs $250k).
- Recommended offer: $196k (21.5% below list) — sets the bar for cash-flow.
Location & tenants
- Location reads 50/100 on livability (#1,100 in CA) — a working-class tenant base; expect higher turnover. Strengths: housing A+; Watch: crime D, employment D, amenities F.
- Lodi Unified (urban): math 24% / reading 36% proficiency, ranked #325 of 517 in CA (top 63%) — families likely to look elsewhere, expect single-tenant / working-renter base with shorter leases.
- Zoned schools: Ellerth E. Larson Elementary (math 42% / reading 48%, grade D-, #490 of 1,571 statewide, top 31%, 858 students, 59% FRL); Lodi Middle (math 19% / reading 33%, grade F, #256 of 498 statewide, top 52%, 898 students, 80% FRL); Tokay High (math 31% / reading 49%, grade F, #514 of 1,170 statewide, top 44%, 2,059 students, 68% FRL).
- Market conditions: Rents rising fast (+4.2%/yr); 201 active listings in the ZIP; 1 comparable units currently listed for rent nearby; solid renter incomes; 3,779 units permitted in San Joaquin County in 2024 (0 in 5+ unit buildings).
Forward outlook
- Local home prices are declining (-3.0%/yr); year-one equity from $2k of loan paydown is wiped out by about $8k of value loss. Plan a longer hold.
- San Joaquin County population projected at +17% by 2050 — long-run rental-demand tailwind backs the buy-and-hold thesis.
Negotiation context
- It's been on market 110 days — a 9% lower offer ($228k) is reasonable based on typical stale-listing flexibility.
Risks & watch-outs
- Watch-outs: flood insurance adds $427/mo.
- Climate carrying-cost: in FEMA flood zone AE (mandatory federal flood insurance); extreme-heat days projected 7→16/yr by 2055 (HVAC capex compounding) — expect insurance premiums to compound above CPI over the hold.
Questions for the listing agent
- What do current leases actually rent for vs. the listed asking? Can we see a recent rent roll and the last 12 months of T-12 income?
- It's been on market 110 days. Have you received any prior offers? Is the seller open to a 22% concession, seller financing, or rate buy-down credit?
- Built in 1975 — when were the roof, HVAC, electrical panel, plumbing, and water heater last replaced?
- What's the actual annual flood-insurance premium (NFIP or private), and is the property in a SFHA with mandatory coverage?
- What does the HOA fee cover, when was the last increase, and are there any pending special assessments or reserve-fund shortfalls?
- Why hasn't it sold? Are there any deal-killer items the seller is aware of (foundation, flood, title, zoning, code violations)?
- Is there a deadline driving the sale (1031 exchange, divorce, estate, relocation)? That informs how much negotiation room exists.
- Schools are F-rated, which usually means shorter tenancies and higher turnover. Who's the typical renter profile here, and what's been the actual vacancy rate?
- Crime grade is D in this area — have there been break-ins, vandalism, or insurance claims at this property in the last 3 years? What carrier currently insures it and at what premium?
- What's the average days-on-market for RENTAL listings here right now (not sales)? A rising rental-DOM trend means longer vacancies and softer asking-rent achievability than the comps imply.
- What's the recent tenant-quality profile in this submarket — average credit score on applications, eviction rate, late-payment / NSF rate, and stable-employment percentage? A property-management company in the area should have these aggregated.
- How much new for-sale + rental construction is in the pipeline within 1–3 miles? Heavy new supply typically softens prices + rents 12–24 months out; constrained supply supports both.
Investment metrics
- 1% rule
- 1.04% ✓
- Cap rate
- 6.88%
- Cash-on-cash
- 2.09%
- DSCR
- 1.09
- GRM
- 8.0
CMA / ARV
- ARV (median comp)
- $325,573
- List price
- $250,000
- Delta
- -23.21%
- Verdict
- UNDERPRICED
- Comps
- 3 within 1.0 mi
Projected returns pro-forma
-3.0% appreciation · 4.24% rent growth · sell at horizon
- IRR
- -23.0%
- Equity multiple
- 0.20×
- Total profit
- $-56,182
- Equity at exit
- $37,276
- IRR
- -13.2%
- Equity multiple
- 0.17×
- Total profit
- $-58,276
- Equity at exit
- $21,615
Cash invested: $70,000 (down + closing). Projections, not guarantees.
Landlord ↔ Tenant lean methodology
- Overall (STATE)
- 18 Strongly Tenant-Friendly
- State California
- 18 Strongly Tenant-Friendly · D+13
- County
- — inherits STATE
- City
- — inherits STATE
ZIP-level market 95242
- Rents YoY
- 4.2%
- Active inventory
- 201
- Price-to-rent
- 8.0×
Monthly cashflow live
- Estimated rent
- $2,610 medium interval (Pro) →
- Mortgage (P&I)
- −$1,311
- Tax from tax record
- −$270 /mo · $3,235/yr
- Insurance
- −$104
- Flood insurance flood zone
- −$427 /mo · $5,118/yr
- HOA
- −$255
- Vacancy / Maint / Mgmt
- −$548
- Net cashflow
- $-305
Break-even live
Sensitivity live
| Price | -10% $-163 | -5% $-234 | +0% $-305 | +5% $-375 | +10% $-446 |
|---|---|---|---|---|---|
| Rent | -10% $-511 | -5% $-408 | +0% $-305 | +5% $-202 | +10% $-98 |
| Rate | -1.0pp $-179 | -0.5pp $-241 | base $-305 | +0.5pp $-369 | +1.0pp $-435 |
UW: 25.0% down · 7.5% · 30yr · 1.5% tax · 5.0% vac · 8.0% maint · 8.0% mgmt
Financing live
Cash to close
- Down payment
- $62,500
- Closing costs
- $7,500
- Reserves months
- —
- Total cash needed
- —
Loan-product check · same deal, 3 products live
Conventional
25% down · 7.5% · 30yr
- Down + closing
- —
- Monthly P&I
- —
- Monthly cashflow
- —
- DSCR
- —
- Eligible?
- —
Personal DTI + credit; lowest rate.
DSCR
20% down · 8.5% · 30yr
- Down + closing
- —
- Monthly P&I
- —
- Monthly cashflow
- —
- DSCR
- —
- Eligible?
- —
No personal income docs; deal must DSCR.
Hard money
10% down · 12.0% · 12mo
- Down + closing
- —
- Monthly P&I
- —
- Monthly cashflow
- —
- DSCR
- —
- Eligible?
- —
Short-term bridge; refi at stabilization.
Rent comps 1 comps
| Address | Beds | Baths | Sqft | Rent | $/sqft | DOM | Units | Dist |
|---|---|---|---|---|---|---|---|---|
| 1 Robin Ct Lodi, CA | 2.0 | 2.0 | 1368 | $1,800 | $1.32 | 0d | 1 | 0.30mi |
HOA detail
- Monthly dues
- $255 · $3,060/yr
Listing history 22 events
-
2026-06-21days on market $250,000 Active 110 DOM
-
2026-06-18days on market $250,000 Active 107 DOM
-
2026-06-17days on market $250,000 Active 106 DOM
-
2026-06-16days on market $250,000 Active 105 DOM
-
2026-06-15days on market $250,000 Active 104 DOM
-
2026-06-14days on market $250,000 Active 102 DOM
-
2026-06-10days on market $250,000 Active 99 DOM
-
2026-06-09days on market $250,000 Active 98 DOM
-
2026-06-08days on market $250,000 Active 97 DOM
-
2026-06-07days on market $250,000 Active 96 DOM
-
2026-06-05days on market $250,000 Active 93 DOM
-
2026-06-03days on market $250,000 Active 92 DOM
-
2026-06-03days on market $250,000 Active 91 DOM
-
2026-06-01days on market $250,000 Active 90 DOM
-
2026-05-31days on market $250,000 Active 89 DOM
-
2025-07-08soldstatus $280,000
-
2021-02-18soldstatus $242,500
-
2020-12-01soldstatus $158,000
-
2004-09-29soldstatus $175,000
-
2001-08-06soldstatus $92,000
-
1996-06-06soldstatus $83,500
-
1989-11-03soldstatus $90,000
ⓘ Source: listings_history table (triggers on properties + properties_extension) + one-shot
backfill from property_details.listing_events for pre-trigger history.
Tax reassessment forecast CA · Resets to sale price
- Current annual tax
- $3,235 · $270/mo
- Projected year-2 tax
- $3,235 · $270/mo
- Expected delta
- $0/yr ($0/mo · 0.0%)
ⓘ Screening estimate from a state-policy table — verify with the county assessor before closing.
Climate risk First Street
- Flood 4/10 Moderate FEMA zone AE · 13% chance over 30 yrs
- Wildfire 3/10 Moderate
- Heat 7/10 Severe 7 d/yr ≥101°F today · 16 d/yr by 30 yrs out
- Wind 1/10 Low
- Air quality 10/10 Extreme 25 unhealthy d/yr today · 26 by 30 yrs out
Nearby sold comps map
Loading sold comps map…
Walkable amenities ~0.75 mi
Loading nearby amenities…
Taxation est. · year 1
- Rental income
- $31,317
- − Mortgage interest
- −$14,004
- − Property taxes
- −$3,235
- − Insurance
- −$6,368
- − Repairs & maintenance
- −$2,505
- − Management
- −$2,505
- − HOA
- −$3,060
- − Depreciation
- −$7,273
- Taxable loss
- −$7,633
- Est. tax savings @ 24.0%
- +$1,832
- After-tax cash flow
- $-1,823/yr
For passive investors: Depreciation is non-cash, so a rental often shows a tax loss while cash-flowing — sheltering income. Rental losses are passive: they offset passive income freely, and up to $25,000/yr can offset ordinary (W-2) income if you actively participate and your MAGI is under $100k (phasing out to $0 by $150k); unused losses carry forward. On sale, claimed depreciation is recaptured at up to 25%, and gains may owe capital-gains tax (a 1031 exchange can defer both). Figures are a year-1 estimate at your 24.0% rate — not tax advice; consult a CPA.
Schools (NCES district)
- District
- Lodi Unified
- NCES district ID
- 0622230
- Math proficiency
- 24% ▼ -8.00%
- Reading proficiency
- 36% ▼ -8.00%
- Median HH income
- $57,165
- Composite
- 26.84/100
- National rank
- #7108
- State rank
- #325 of 517 in CA
Livability — Terminous
- Score
- 50/100
- State rank
- #1100
- US rank
- #25404
Category grades
Schools grade is shown separately in the Schools card above.
Census & demographics
- Census place
- Terminous, CA
- County
- San Joaquin County · 729,570 people
- Metro
- Stockton, CA
- Population (ZIP)
- 28,427
- Household income
- $104,721
- Rent vs Own
- Severe rent burden
- 778.0
Population outlook (San Joaquin County) Hauer SSP2
- Today (2025)
- 796,965 people
- By 2030
- 828,849 · +4.0%
- By 2040
- 885,611 · +11.1%
- By 2050
- 929,798 · +16.7%
- By 2075
- 994,578 · +24.8%
- By 2100
- 971,291 · +21.9%
Race, ethnicity, and origin ACS 2023
- Neighborhood character
- Majority White (62%)
- Race & ethnicity
- White 62% Hispanic / Latino 26% Two or more races 17% Asian 7% Black 1%
- Hispanic origin (detail)
- Mexican 22%
- Common ancestry
- Italian 3% Lithuanian 2% Romanian 2%
- Foreign-born
- 11% · Canada, China, Dominican Republic
- Languages at home
- 79% English-only · Spanish 13% Other Indo-European 3% Arabic 1%
Political lean MEDSL · San Joaquin
- 2024 margin
- Toss-up / Even · D 48.0% · R 48.9% · Other 3.0%
- 2008→2024 swing
- -11.6pp toward R · 2008: 10.7pp · 2024: -0.9pp
- All cycles
- 2024: R+0.9 2020: D+13.9 2016: D+12.9 2012: D+8.9 2008: D+10.7
Not yet ingested
- Civics
- —
Market trends
- HPI YoY
- ▼ -488.67%
- Current HPI
- 265.9974
- Rent YoY
- ▲ 4.24%
- Metro
- Stockton, CA
- State GDP YoY
- ▲ 3.21%
- F500 in state
- 116
Industry mix (Fortune 500 HQ in CA)
| Industry | F500 HQs | Revenue |
|---|---|---|
| Technology | 27 | $1,492B |
|
||
| Financial Services | 3 | $174B |
|
||
| Retail | 3 | $44B |
|
||
| Insurance | 3 | $26B |
|
||
| Media / Entertainment | 2 | $115B |
|
||
| Pharmaceuticals / Biotech | 2 | $62B |
|
||
Price history
+211.1% since first listed7 events — show timeline
- 2025-07-08 Sold (Public Records) $280,000 Public Records
- 2021-02-18 Sold (Public Records) $242,500 Public Records
- 2020-12-01 Sold (Public Records) $158,000 Public Records
- 2004-09-29 Sold (Public Records) $175,000 Public Records
- 2001-08-06 Sold (Public Records) $92,000 Public Records
- 1996-06-06 Sold (Public Records) $83,500 Public Records
- 1989-11-03 Sold (Public Records) $90,000 Public Records
Property tax history
+7.8%/yrLatest (2025): $3,235 · +2.5% YoY. Source: county tax records.
Cash-flow waterfall
monthlySold comps — $/sqft
last 12 mo · ≤1 miLoading sold comps…