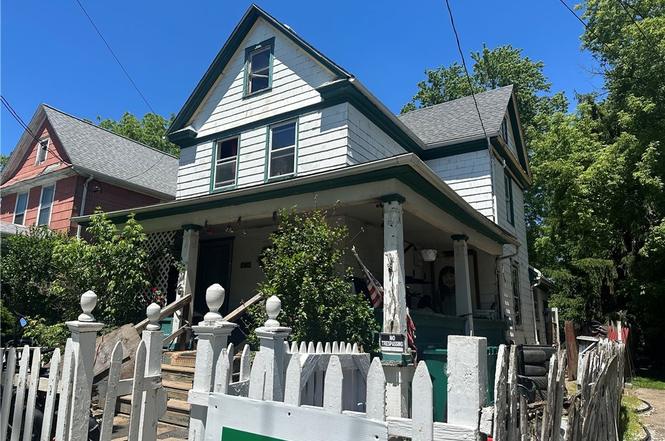
1634 Linwood Ave · Niagara Falls, NY
Flood risk 1/10 · Minimal
- FEMA flood zone
- X (unshaded)
- Chance of flooding over 30 yrs
- 0.0%
- Est. flood insurance / yr
- $473 – $860
Fire risk 1/10 · Minimal
- Est. fire insurance / yr
- $691 – $1,283
Heat risk 2/10 · Minimal
- Hot days now (above 94°F)
- 7 days/yr
- Hot days in 30 yrs
- 15 days/yr
Wind risk 1/10 · Minimal
- Chance of severe wind over 30 yrs
- —
Air-quality risk 3/10 · Minor
- Unhealthy air days now
- 2 days/yr
- Unhealthy air days in 30 yrs
- 3 days/yr
Risk factors via First Street. Map © Google.
Why this score? — see what drove the B grade
The composite is a weighted blend of 9 inputs, each scored 0–100. Each bar is that input's sub-score; the figure is the points it added to the 100-point composite (weight × sub-score).
- Cash flow +30.0/30.0
- ARV discount +12.7/15.0
- DSCR +10.0/10.0
- 1% rule +9.9/10.0
- Livability +3.0/5.0
- Rent growth +2.5/5.0
- Schools +2.5/10.0
- Condition / age +2.5/5.0
- Appreciation +0.0/10.0
$95,000
🖨 Deal sheet (PDF) 📄 Offer letter ✓ Due diligence
Listing remarks
Investor Opportunity: 1634 Linwood Ave, Niagara Falls, NY 14305Turnkey cash-flowing 3-bedroom, 1-bath single-family home in the Little Italy neighborhood, just minutes from Niagara Falls attractions, State Park, and major corridors. 1,431 sq ft on a 3,960 sq ft lot (built 1900) New windows, big rooms and a nice kitchen area — ready for immediate rental or light cosmetic updates Currently rented at $1100/month (strong upside potential to market rents) Low entry price point - Beats 1% rule. This property offers classic "buy rehabbed, rent stabilized" investor appeal in an affordable Buffalo-Niagara market. Niagara Falls continues to see revitalization efforts, tourism
Key facts
- Recent improvements
- Nice kitchen area
- New windows
Tags
Property features AI
Exterior
- Parking: No garage; No driveway
- Utilities: Public water connected; Sewer connected
- Home design: Two-story house; Existing/resale property
- Construction: Vinyl siding exterior; Block foundation
- Exterior features: Rectangular residential lot; City street frontage; Lot dimensions approximately 33 x 120
Interior
- Kitchen: No appliances listed for kitchen
- Bedrooms: One bedroom on the main level
- Flooring: Hardwood; Vinyl; Varies
- Bathrooms: One full bathroom
- Heating & cooling: Gas forced-air heating
- Interior features: Pantry; Bedroom on main level; Full basement
- Laundry & utility: Gas water heater
Neighborhood map
What this means for you Summary
Snapshot
- This is a 3-bed/1.0-bath single-family listed at $95k.
Deal economics
- At list price, monthly cash flow is $451 ($5k/yr) — positive.
- The deal already cash-flows at list — no discount required.
- Meets the 1% rule at list price ($1k rent vs $95k).
- Cap rate 12.0% vs local median 7.5% in Niagara Falls — top-decile yield for the area; either an underpriced asset or a hidden risk that comps aren't pricing in. Stress-test before assuming the spread holds.
Location & tenants
- Location reads 60/100 on livability (#956 in NY) — a middle-class / working-renter tenant base. Strengths: cost of living A+, housing A+; Watch: crime F, amenities F, commute F.
- Niagara Falls City School District (urban): math 26% / reading 34% proficiency, ranked #578 of 590 in NY (top 98%) — families likely to look elsewhere, expect single-tenant / working-renter base with shorter leases; 66% free/reduced lunch — lower-income household profile, screen leases tightly.
- Zoned schools: Harry F Abate Elementary School (math 16% / reading 32%, grade F, #1,909 of 2,108 statewide, top 91%, 695 students, 82% FRL); Gaskill Preparatory School (math 10% / reading 22%, grade F, #702 of 729 statewide, top 96%, 500 students, 78% FRL); Niagara Falls High School (math 75% / reading 92%, grade A, #409 of 1,100 statewide, top 39%, 2,139 students, 71% FRL).
- Market conditions: 142 active listings in the ZIP; 20 comparable units currently listed for rent nearby; rentals at typical pace (median 19d on market — plan ~3-4 weeks tenant-placement turnaround); 167 units permitted in Niagara County in 2024 (0 in 5+ unit buildings).
- This rent runs 33% of the median local income ($51k/yr) — at the standard rent-burdened threshold; future hikes will face affordability resistance.
Forward outlook
- Local home prices are declining (-3.0%/yr); year-one equity from $657 of loan paydown is wiped out by about $3k of value loss. Plan a longer hold.
- Niagara County population projected at -19% by 2050 — secular population decline; favor cash flow + early exit over multi-decade hold.
- At projected returns (-3.0% appreciation + 3.0% rent growth), your $27k cash investment doubles in ~6 years — after that, you're playing with house money.
Negotiation context
- Only 8 days on market — expect competitive offers; lowballing is unlikely to land.
- Current owner paid $35k; list at $95k implies a 174% gain — meaningful room to come down on a strong offer.
Risks & watch-outs
- Watch-outs: built in 1900 — expect roof / HVAC / electrical / plumbing capex.
Questions for the listing agent
- Built in 1900 — when were the roof, HVAC, electrical panel, plumbing, and water heater last replaced?
- Is there a deadline driving the sale (1031 exchange, divorce, estate, relocation)? That informs how much negotiation room exists.
- Schools are F-rated, which usually means shorter tenancies and higher turnover. Who's the typical renter profile here, and what's been the actual vacancy rate?
- Crime grade is F in this area — have there been break-ins, vandalism, or insurance claims at this property in the last 3 years? What carrier currently insures it and at what premium?
- What's the average days-on-market for RENTAL listings here right now (not sales)? A rising rental-DOM trend means longer vacancies and softer asking-rent achievability than the comps imply.
- What's the recent tenant-quality profile in this submarket — average credit score on applications, eviction rate, late-payment / NSF rate, and stable-employment percentage? A property-management company in the area should have these aggregated.
- How much new for-sale + rental construction is in the pipeline within 1–3 miles? Heavy new supply typically softens prices + rents 12–24 months out; constrained supply supports both.
Investment metrics
- 1% rule
- 1.49% ✓
- Cap rate
- 11.99%
- Cash-on-cash
- 20.34%
- DSCR
- 1.90
- GRM
- 5.6
CMA / ARV
- ARV (on-the-fly)
- $107,325
- Comps found
- 12
Show comp detail 12 sales within ~0.75 mi
| Address | Dist | Beds/Ba | Sqft | Sold | Price | $/sf | Match |
|---|---|---|---|---|---|---|---|
| 1327 Willow Ave | 0.25mi | 3/1.0 | 1,444 (+1%) | 1mo | $40,000 | $28 | 86 |
| 1870 South Ave | 0.26mi | 3/1.0 | 1,320 (-8%) | 0mo | $116,000 | $88 | 75 |
| 2434 Weston Ave | 0.48mi | 3/1.0 | 1,400 (-2%) | 4mo | $170,000 | $121 | 71 |
| 1329 Niagara Ave | 0.33mi | 3/1.0 | 1,540 (+8%) | 2mo | $85,000 | $55 | 70 |
| 1013 13th St | 0.44mi | 3/1.0 | 1,352 (-6%) | 3mo | $97,000 | $72 | 68 |
| 2456 South Ave | 0.53mi | 3/1.0 | 1,380 (-4%) | 2mo | $120,000 | $87 | 68 |
| 1307 Niagara Ave | 0.35mi | 4/1.5 (+1) | 1,536 (+7%) | 3mo | $95,000 | $62 | 62 |
| 1852 Ontario Ave | 0.39mi | 3/1.0 | 1,273 (-11%) | 3mo | $85,000 | $67 | 61 |
| 2233 South Ave | 0.37mi | 3/2.5 | 1,553 (+8%) | 3mo | $155,000 | $100 | 60 |
| 1317 Niagara Ave | 0.35mi | 2/2.0 (-1) | 1,310 (-8%) | 1mo | $28,000 | $21 | 60 |
| 1739 Lockport St | 0.35mi | 4/2.0 (+1) | 1,598 (+12%) | 4mo | $120,000 | $75 | 52 |
| 628 20th St | 0.67mi | 3/2.0 | 1,328 (-7%) | 2mo | $115,000 | $87 | 52 |
Match score weights: distance 35% · size 25% · config 20% · recency 20%. Top-matched comps best support the ARV.
Projected returns pro-forma
-3.0% appreciation · 3.0% rent growth · sell at horizon
- IRR
- 12.6%
- Equity multiple
- 1.50×
- Total profit
- $13,350
- Equity at exit
- $14,165
- IRR
- 21.5%
- Equity multiple
- 2.83×
- Total profit
- $48,719
- Equity at exit
- $8,214
Cash invested: $26,600 (down + closing). Projections, not guarantees.
Landlord ↔ Tenant lean methodology
- Overall (STATE)
- 15 Strongly Tenant-Friendly
- State New York
- 15 Strongly Tenant-Friendly · D+10
- County
- — inherits STATE
- City
- — inherits STATE
ZIP-level market 14305
- Home prices YoY
- -10.9%
- Active inventory
- 142
- Price-to-rent
- 5.6×
Monthly cashflow live
- Estimated rent
- $1,418 high interval (Pro) →
- Mortgage (P&I)
- −$498
- Tax from tax record
- −$132 /mo · $1,583/yr
- Insurance
- −$40
- HOA
- −$0
- Vacancy / Maint / Mgmt
- −$298
- Net cashflow
- $451
Break-even live
Sensitivity live
| Price | -10% $505 | -5% $478 | +0% $451 | +5% $424 | +10% $397 |
|---|---|---|---|---|---|
| Rent | -10% $339 | -5% $395 | +0% $451 | +5% $507 | +10% $563 |
| Rate | -1.0pp $499 | -0.5pp $475 | base $451 | +0.5pp $426 | +1.0pp $401 |
UW: 25.0% down · 7.5% · 30yr · 1.5% tax · 5.0% vac · 8.0% maint · 8.0% mgmt
Financing live
Cash to close
- Down payment
- $23,750
- Closing costs
- $2,850
- Reserves months
- —
- Total cash needed
- —
Loan-product check · same deal, 3 products live
Conventional
25% down · 7.5% · 30yr
- Down + closing
- —
- Monthly P&I
- —
- Monthly cashflow
- —
- DSCR
- —
- Eligible?
- —
Personal DTI + credit; lowest rate.
DSCR
20% down · 8.5% · 30yr
- Down + closing
- —
- Monthly P&I
- —
- Monthly cashflow
- —
- DSCR
- —
- Eligible?
- —
No personal income docs; deal must DSCR.
Hard money
10% down · 12.0% · 12mo
- Down + closing
- —
- Monthly P&I
- —
- Monthly cashflow
- —
- DSCR
- —
- Eligible?
- —
Short-term bridge; refi at stabilization.
Rent comps 20 comps
| Address | Beds | Baths | Sqft | Rent | $/sqft | DOM | Units | Dist |
|---|---|---|---|---|---|---|---|---|
| 1808 Whitney Ave Unit 3 Niagara Falls, NY | 2.0 | 1.0 | 1200 | $900 | $0.75 | 45d | 1 | 0.23mi |
| 1817 Ontario Ave Unit 1 Niagara Falls, NY | 2.0 | 1.0 | 999 | $1,899 | $1.90 | 3d | 1 | 0.32mi |
| 1817 Ontario Ave Unit 2 Niagara Falls, NY | 2.0 | 1.0 | 985 | $1,899 | $1.93 | 3d | 1 | 0.32mi |
| 1001 17th St Niagara Falls, NY | 3.0 | 1.0 | 1152 | $1,800 | $1.56 | 25d | 1 | 0.38mi |
| 2020 Forest Ave Niagara Falls, NY | 4.0 | 2.0 | 1600 | $1,500 | $0.94 | 18d | 1 | 0.45mi |
| 784 15th St Niagara Falls, NY | 3.0 | 1.5 | 1380 | $1,350 | $0.98 | 5d | 1 | 0.46mi |
| 769 19th St Niagara Falls, NY | 2.0 | 1.5 | 960 | $1,400 | $1.46 | 23d | 1 | 0.49mi |
| 2463 South Ave Niagara Falls, NY | 2.0 | 1.0 | 1008 | $1,100 | $1.09 | 18d | 1 | 0.52mi |
| 754 15th St Niagara Falls, NY | 3.0 | 1.0 | 990 | $1,100 | $1.11 | 25d | 1 | 0.53mi |
| 2473 Pierce Ave Unit 2 Niagara Falls, NY | 2.0 | 1.0 | 1000 | $1,200 | $1.20 | 5d | 1 | 0.55mi |
| 642 Ashland Ave Niagara Falls, NY | 3.0 | 1.0 | 1238 | $1,100 | $0.89 | 5d | 1 | 0.87mi |
| 2814 10th St Niagara Falls, NY | 2.0 | 1.0 | 900 | $900 | $1.00 | 3d | 1 | 0.87mi |
| 724 Augustus Pl Niagara Falls, NY | 4.0 | 1.0 | 1200 | $1,500 | $1.25 | 45d | 1 | 0.93mi |
| 1427 Fort Ave Unit 2 Niagara Falls, NY | 3.0 | 1.0 | 1058 | $950 | $0.90 | 45d | 1 | 0.99mi |
| 420 25th St Niagara Falls, NY | 3.0 | 1.0 | 1101 | $1,500 | $1.36 | 45d | 1 | 1.13mi |
| 1780 Falls St Niagara Falls, NY | 2.0 | 1.0 | 1100 | $1,200 | $1.09 | 45d | 1 | 1.16mi |
| 3025 Macklem Ave Niagara Falls, NY | 4.0 | 1.5 | 1750 | $2,200 | $1.26 | 45d | 1 | 1.18mi |
| 2727 Monroe Ave Niagara Falls, NY | 3.0 | 1.0 | 960 | $1,500 | $1.56 | 12d | 1 | 1.22mi |
| 2420 Mackenna Ave Unit 1 Niagara Falls, NY | 4.0 | 1.0 | 1300 | $1,390 | $1.07 | 3d | 1 | 1.37mi |
| 3036 Welch Ave Niagara Falls, NY | 3.0 | 1.0 | 1000 | $1,500 | $1.50 | 3d | 1 | 1.42mi |
Listing history 9 events
-
2026-06-21days on market $95,000 Active 8 DOM
-
2026-06-18days on market $95,000 Active 5 DOM
-
2026-06-17days on market $95,000 Active 4 DOM
-
2026-06-16days on market $95,000 Active 3 DOM
-
2026-06-15remarks 683-char remark
-
2026-06-15$95,000 Active 2 DOM
-
2026-06-13days on market $95,000 Active 2 DOM
-
2026-06-13remarks 675-char remark
-
2026-06-13$95,000 Active 1 DOM
ⓘ Source: listings_history table (triggers on properties + properties_extension) + one-shot
backfill from property_details.listing_events for pre-trigger history.
Tax reassessment forecast NY · Partial reset (capped growth)
- Current annual tax
- $1,583 · $132/mo
- Projected year-2 tax
- $1,594 · $133/mo
- Expected delta
- +$11/yr (+$1/mo · 0.7%)
ⓘ Screening estimate from a state-policy table — verify with the county assessor before closing.
Climate risk First Street
- Flood 1/10 Low FEMA zone X (unshaded) · 0% chance over 30 yrs
- Wildfire 1/10 Low
- Heat 2/10 Low 7 d/yr ≥94°F today · 15 d/yr by 30 yrs out
- Wind 1/10 Low
- Air quality 3/10 Moderate 2 unhealthy d/yr today · 3 by 30 yrs out
Nearby sold comps map
Loading sold comps map…
Walkable amenities ~0.75 mi
Loading nearby amenities…
Taxation est. · year 1
- Rental income
- $17,021
- − Mortgage interest
- −$5,321
- − Property taxes
- −$1,583
- − Insurance
- −$475
- − Repairs & maintenance
- −$1,362
- − Management
- −$1,362
- − Depreciation
- −$2,764
- Taxable income
- $4,154
- Est. tax owed @ 24.0%
- −$997
- After-tax cash flow
- $4,413/yr
For passive investors: Depreciation is non-cash, so a rental often shows a tax loss while cash-flowing — sheltering income. Rental losses are passive: they offset passive income freely, and up to $25,000/yr can offset ordinary (W-2) income if you actively participate and your MAGI is under $100k (phasing out to $0 by $150k); unused losses carry forward. On sale, claimed depreciation is recaptured at up to 25%, and gains may owe capital-gains tax (a 1031 exchange can defer both). Figures are a year-1 estimate at your 24.0% rate — not tax advice; consult a CPA.
Schools (NCES district)
- District
- Niagara Falls City School District
- NCES district ID
- 3620820
- Math proficiency
- 26% ▼ -10.00%
- Reading proficiency
- 34% ▲ 3.00%
- Median HH income
- $32,488
- Composite
- 24.5/100
- National rank
- #7655
- State rank
- #578 of 590 in NY
Livability — Niagara Falls
- Score
- 60/100
- State rank
- #956
- US rank
- #18749
Category grades
Schools grade is shown separately in the Schools card above.
Census & demographics
- Census place
- Niagara Falls, NY
- County
- Niagara County · 157,377 people
- City population
- 62,983
- Metro
- Buffalo-Cheektowaga, NY
- Population (ZIP)
- 16,696
- Household income
- $51,004
- Rent vs Own
- Severe rent burden
- 1095.0
Population outlook (Niagara County) Hauer SSP2
- Today (2025)
- 204,149 people
- By 2030
- 197,900 · -3.1%
- By 2040
- 182,239 · -10.7%
- By 2050
- 165,198 · -19.1%
- By 2075
- 129,416 · -36.6%
- By 2100
- 96,222 · -52.9%
Race, ethnicity, and origin ACS 2023
- Neighborhood character
- Diverse neighborhood (Simpson 0.63)
- Race & ethnicity
- White 55% Black 24% Two or more races 13% Hispanic / Latino 8% Asian 1% Native American 1%
- Hispanic origin (detail)
- Puerto Rican 4%
- Common ancestry
- Romanian 6% Slovak 2% Lithuanian 2%
- Foreign-born
- 6% · Canada, Jamaica
- Languages at home
- 93% English-only · Spanish 4% Other Indo-European 1%
Political lean MEDSL · Niagara
- 2024 margin
- R (+14.9) · D 42.5% · R 57.5%
- 2008→2024 swing
- -15.9pp toward R · 2008: 1.0pp · 2024: -14.9pp
- All cycles
- 2024: R+14.9 2020: R+9.7 2016: R+19.0 2012: D+0.6 2008: D+1.0
Not yet ingested
- Civics
- —
Market trends
- HPI YoY
- ▼ -43.08%
- Current HPI
- 350.8741
- Rent YoY
- —
- Metro
- Buffalo-Cheektowaga, NY
- State GDP YoY
- ▲ 2.60%
- F500 in state
- 92
Industry mix (Fortune 500 HQ in NY)
| Industry | F500 HQs | Revenue |
|---|---|---|
| Financial Services | 10 | $950B |
|
||
| Consumer Goods | 9 | $162B |
|
||
| Insurance | 4 | $225B |
|
||
| Telecommunications | 2 | $144B |
|
||
| Pharmaceuticals | 2 | $112B |
|
||
| Media / Entertainment | 2 | $69B |
|
||
Price history
+578.6% since first listed6 events — show timeline
- 2026-06-11 Listed $95,000 WNYREIS
- 2014-11-13 Sold (Public Records) $34,700 Public Records
- 2010-11-24 Sold (Public Records) $15,000 Public Records
- 2007-08-31 Sold (Public Records) $45,000 Public Records
- 1997-11-21 Sold (Public Records) $20,000 Public Records
- 1993-07-15 Sold (Public Records) $14,000 Public Records
Property tax history
+6.5%/yrLatest (2025): $1,583 · +26.2% YoY. Source: county tax records.
Cash-flow waterfall
monthlySold comps — $/sqft
last 12 mo · ≤1 miLoading sold comps…