 Triplex
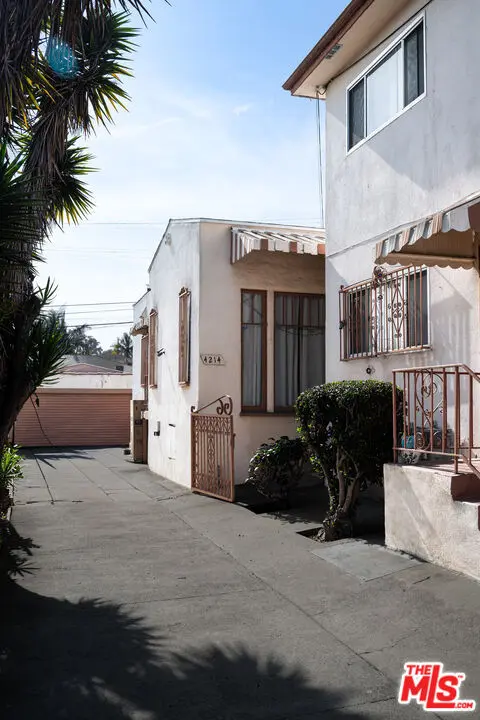
4214 W Slauson Ave · Los Angeles, CA
Flood risk 1/10 · Minimal
- FEMA flood zone
- X (unshaded)
- Chance of flooding over 30 yrs
- 0.0%
- Est. flood insurance / yr
- $507 – $1,088
Fire risk 1/10 · Minimal
- Est. fire insurance / yr
- $659 – $1,223
Heat risk 5/10 · Moderate
- Hot days now (above 87°F)
- 7 days/yr
- Hot days in 30 yrs
- 19 days/yr
Wind risk 1/10 · Minimal
- Chance of severe wind over 30 yrs
- —
Air-quality risk 5/10 · Moderate
- Unhealthy air days now
- 7 days/yr
- Unhealthy air days in 30 yrs
- 7 days/yr
Risk factors via First Street. Map © Google.
Why this score? — see what drove the C+ grade
The composite is a weighted blend of 9 inputs, each scored 0–100. Each bar is that input's sub-score; the figure is the points it added to the 100-point composite (weight × sub-score).
- Cash flow +20.9/30.0
- ARV discount +15.0/15.0
- DSCR +6.7/10.0
- 1% rule +4.4/10.0
- Rent growth +3.8/5.0
- Schools +3.6/10.0
- Livability +3.4/5.0
- Condition / age +2.5/5.0
- Appreciation +0.0/10.0
$865,000
🖨 Deal sheet 📄 Offer letter ✓ Due diligence
Multi-family units
County records classify this as Multi-Family (2-4 Unit). Listing-text estimate: 3 units. confirmed
Listing remarks MLS
4214 W. Slauson is a rare opportunity to purchase a multi-family property in the highly desired 90043 zip code. This 3-Unit Investment Opportunity offers one spacious 2bed/1bath and two comfortable 1 bed/1 bath apartments on a 6,255 square foot lot. The LAR3 zoned property adds the possibility to strengthen the buyer(s) investment by converting the 3-car carport and/or adding an ADU (buyer to verify). The building comes with existing tenants in each unit. Some upgrades have been made in units. This is a solid investment opportunity for both seasoned and new operators alike. It offers strong upside, long term growth and favorable tax strategies (consult with a financial professional). The property is sold AS-IS. Please - DO NOT WALK ON PROPERTY. DO NOT DISTURB OCCUPANTS.
Key facts
- Adu potential
- 3 car carport
- Upgrades in units
Tags
Neighborhood map
What this means for you Summary
Snapshot
- This is a 3 × 4-bed/4.0-bath units multifamily listed at $865k.
Deal economics
- At list price, monthly cash flow is $1k ($14k/yr) — positive. Per door: $401/mo.
- The deal already cash-flows at list — no discount required.
- To meet the 1% rule (rent ≥ 1% of price), the offer needs to be $814k (5.9% below list).
- Recommended offer: $761k (12.0% below list) — sets the bar for market timing.
- Cap rate 8.0% vs local median 2.1% in Los Angeles — top-decile yield for the area; either an underpriced asset or a hidden risk that comps aren't pricing in. Stress-test before assuming the spread holds.
Location & tenants
- Location reads 68/100 on livability (#273 in CA) — a middle-class / working-renter tenant base. Strengths: amenities A+, commute A+, employment B; Watch: health & safety C-, schools D+, crime F.
- Los Angeles Unified (urban): math 29% / reading 54% proficiency, ranked #223 of 517 in CA (top 43%) — families likely to look elsewhere, expect single-tenant / working-renter base with shorter leases; 67% free/reduced lunch — lower-income household profile, screen leases tightly.
- Market conditions: Rents rising fast (+5.0%/yr); 142 active listings in the ZIP; 40 comparable units currently listed for rent nearby; rentals lingering (median 44d on market — plan ~5-8 weeks vacancy on turnover, expect pricing pressure); 50% of comp listings sitting > 30 days — soft ceiling on asking rent; 19,697 units permitted in Los Angeles County in 2024 (9,426 in 5+ unit buildings).
- At $8,142/mo this rent would consume 151% of the median local household income ($65k/yr) (locally 3295% of renters already pay >50% of income on rent) — very limited rent-growth headroom before tenants either downsize or default.
Forward outlook
- Local home prices are declining (-3.0%/yr); year-one equity from $6k of loan paydown is wiped out by about $26k of value loss. Plan a longer hold.
- Los Angeles County population projected at +9% by 2050 — modest demand growth; plan on rents tracking national, not racing it.
Negotiation context
- It's been on market 215 days — a 12% lower offer ($761k) is reasonable based on typical stale-listing flexibility.
- Current owner paid $135k; list at $865k implies a 541% gain — meaningful room to come down on a strong offer.
Risks & watch-outs
- Watch-outs: built in 1955 — expect roof / HVAC / electrical / plumbing capex.
- Climate carrying-cost: extreme-heat days projected 7→19/yr by 2055 (HVAC capex compounding) — expect insurance premiums to compound above CPI over the hold.
Questions for the listing agent
- It's been on market 215 days. Have you received any prior offers? Is the seller open to a 12% concession, seller financing, or rate buy-down credit?
- Can we see the unit-by-unit rent roll, current vacancy, and any below-market leases? What's the average tenancy length?
- What capital expenditures (roof, boiler, parking lot, exteriors) have been made in the last 5 years, and what's planned in the next 2?
- Built in 1955 — when were the roof, HVAC, electrical panel, plumbing, and water heater last replaced?
- Why hasn't it sold? Are there any deal-killer items the seller is aware of (foundation, flood, title, zoning, code violations)?
- Is there a deadline driving the sale (1031 exchange, divorce, estate, relocation)? That informs how much negotiation room exists.
- Schools are D-rated, which usually means shorter tenancies and higher turnover. Who's the typical renter profile here, and what's been the actual vacancy rate?
- Crime grade is F in this area — have there been break-ins, vandalism, or insurance claims at this property in the last 3 years? What carrier currently insures it and at what premium?
- What's the average days-on-market for RENTAL listings here right now (not sales)? A rising rental-DOM trend means longer vacancies and softer asking-rent achievability than the comps imply.
- What's the recent tenant-quality profile in this submarket — average credit score on applications, eviction rate, late-payment / NSF rate, and stable-employment percentage? A property-management company in the area should have these aggregated.
- How much new apartment / multifamily construction is in the pipeline within 1–3 miles? Heavy new supply (>2% of stock underway) typically softens rents 12–24 months out; light construction supports rent growth.
Investment metrics
- 1% rule
- 0.94% ✗
- Cap rate
- 7.96%
- Cash-on-cash
- 5.96%
- DSCR
- 1.27
- GRM
- 8.9
CMA / ARV
- ARV (median comp)
- $1,113,005
- List price
- $865,000
- Delta
- -22.28%
- Verdict
- UNDERPRICED
- Comps
- 20 within 1.0 mi
Projected returns pro-forma
-3.0% appreciation · 5.01% rent growth · sell at horizon
- IRR
- -5.1%
- Equity multiple
- 0.81×
- Total profit
- $-47,094
- Equity at exit
- $128,974
- IRR
- 6.5%
- Equity multiple
- 1.53×
- Total profit
- $128,089
- Equity at exit
- $74,789
Cash invested: $242,200 (down + closing). Projections, not guarantees.
Landlord ↔ Tenant lean methodology
- Overall (CITY)
- 0 Strongly Tenant-Friendly
- State California
- 18 Strongly Tenant-Friendly · D+13
- County
- — inherits STATE
- City Los Angeles
- 0 Strongly Tenant-Friendly · D+22
ZIP-level market 90043
- Rents YoY
- 5.0%
- Active inventory
- 142
- Price-to-rent
- 26.6×
Monthly cashflow live
- Estimated rent
- $8,142 medium interval (Pro) →
- Mortgage (P&I)
- −$4,536
- Tax from tax record
- −$333 /mo · $3,992/yr
- Insurance
- −$360
- HOA
- −$0
- Vacancy / Maint / Mgmt
- −$1,710
- Net cashflow
- $1,203
Break-even live
3-unit breakdown (identical units grouped — click to expand)
| Units | Beds | Baths | Est. rent |
|---|---|---|---|
| 3× units | 4 | 4 | $8,142 |
| #1 | 4 | 4 | $2,714 |
| #2 | 4 | 4 | $2,714 |
| #3 | 4 | 4 | $2,714 |
| Total (3 units) | $8,142 | ||
UW: 25.0% down · 7.5% · 30yr · 1.5% tax · 5.0% vac · 8.0% maint · 8.0% mgmt
Financing live
Cash to close
- Down payment
- $216,250
- Closing costs
- $25,950
- Reserves months
- —
- Total cash needed
- —
Loan-product check · same deal, 3 products live
Conventional
25% down · 7.5% · 30yr
- Down + closing
- —
- Monthly P&I
- —
- Monthly cashflow
- —
- DSCR
- —
- Eligible?
- —
Personal DTI + credit; lowest rate.
DSCR
20% down · 8.5% · 30yr
- Down + closing
- —
- Monthly P&I
- —
- Monthly cashflow
- —
- DSCR
- —
- Eligible?
- —
No personal income docs; deal must DSCR.
Hard money
10% down · 12.0% · 12mo
- Down + closing
- —
- Monthly P&I
- —
- Monthly cashflow
- —
- DSCR
- —
- Eligible?
- —
Short-term bridge; refi at stabilization.
Rent comps 40 comps
| Address | Beds | Baths | Sqft | Rent | $/sqft | DOM | Units | Dist |
|---|---|---|---|---|---|---|---|---|
| 5621 Edgemar Ave Los Angeles, CA | 1.0 | 1.0 | 1000 | $2,050 | $2.05 | 24d | 1 | 0.11mi |
| 5541 Harcross Dr Los Angeles, CA | 3.0 | 2.0 | 1422 | $4,950 | $3.48 | 24d | 1 | 0.22mi |
| 5446 Angeles Vista Blvd Los Angeles, CA | 3.0 | 2.0 | 1325 | $4,800 | $3.62 | 44d | 1 | 0.27mi |
| 5245 Maymont Dr Los Angeles, CA | 3.0 | 2.0 | 1327 | $4,900 | $3.69 | 44d | 1 | 0.34mi |
| 634 E Fairview Blvd Inglewood, CA | 3.0 | 3.0 | 1184 | $4,000 | $3.38 | 17d | 1 | 0.58mi |
| 610 E Fairview Blvd Inglewood, CA | 2.0 | 1.0 | 1057 | $2,975 | $2.81 | 24d | 1 | 0.58mi |
| 5008 Valley Ridge Ave View Park, CA | 3.0 | 2.0 | 1833 | $6,200 | $3.38 | 24d | 1 | 0.63mi |
| 5337 Deane Ave Los Angeles, CA | 3.0 | 2.5 | 1540 | $4,999 | $3.25 | 8d | 1 | 0.71mi |
| 316 E Ellis Ave Inglewood, CA | 2.0 | 2.0 | 992 | $3,999 | $4.03 | 7d | 1 | 0.75mi |
| 6243 S Fairfax Ave Los Angeles, CA | 2.0 | 1.0 | 1070 | $2,600 | $2.43 | 44d | 1 | 0.83mi |
| 559 E Hyde Park Pl Unit 3 Inglewood, CA | 3.0 | 2.0 | 1000 | $2,800 | $2.80 | 44d | 1 | 0.88mi |
| 1011 E 65th St Inglewood, CA | 2.0 | 1.0 | 1100 | $2,850 | $2.59 | 44d | 1 | 0.89mi |
| 715 Marlborough Ave Inglewood, CA | 3.0 | 1.0 | 1048 | $2,800 | $2.67 | 44d | 1 | 0.89mi |
| 6119 Brynhurst Ave Los Angeles, CA | 2.0 | 1.5 | 900 | $1,920 | $2.13 | 3d | 2 | 0.93mi |
| 4947 Angeles Vista Blvd View Park, CA | 2.0 | 2.0 | 1200 | $3,699 | $3.08 | 44d | 1 | 0.94mi |
| 537 E Hyde Park Blvd Inglewood, CA | 2.0 | 2.0 | 887 | $2,450 | $2.76 | 24d | 1 | 0.94mi |
| 5008 W 58th Pl Los Angeles, CA | 3.0 | 2.0 | 1200 | $3,498 | $2.91 | 44d | 2 | 0.95mi |
| 525 E Hyde Park Blvd Apt E Inglewood, CA | 1.0 | 1.0 | 1190 | $2,200 | $1.85 | 19d | 1 | 0.95mi |
| 6210 Brynhurst Ave Los Angeles, CA | 3.0 | 2.0 | 1186 | $3,575 | $3.01 | 44d | 1 | 0.96mi |
| 918 Centinela Ave Inglewood, CA | 3.0 | 2.0 | 1003 | $3,600 | $3.59 | 44d | 1 | 0.96mi |
| 6208 Brynhurst Ave Los Angeles, CA | 3.0 | 2.0 | 1186 | $3,575 | $3.01 | 44d | 1 | 0.97mi |
| 5308 S Victoria Ave Los Angeles, CA | 3.0 | 3.0 | 1396 | $4,000 | $2.87 | 44d | 1 | 1.05mi |
| 810 Edgewood St #105 Inglewood, CA | 2.0 | 2.0 | 1195 | $2,995 | $2.51 | 17d | 1 | 1.08mi |
| 300 W Hillsdale St Unit 2 Inglewood, CA | 2.0 | 1.0 | 1005 | $3,000 | $2.99 | 7d | 1 | 1.09mi |
| 555 E Hazel St Inglewood, CA | 2.0 | 2.0 | 975 | $2,275 | $2.33 | 24d | 1 | 1.10mi |
| 345 Stepney St Apt 4 Inglewood, CA | 2.0 | 2.0 | 1083 | $2,350 | $2.17 | 3d | 1 | 1.11mi |
| 6263 La Tijera Blvd Los Angeles, CA | 2.0 | 1.0 | 1200 | $3,000 | $2.50 | 44d | 1 | 1.12mi |
| 5117 Crenshaw Blvd Unit 7 Los Angeles, CA | 2.0 | 1.0 | 900 | $2,700 | $3.00 | 44d | 1 | 1.13mi |
| 4315 Don Tomaso Dr Los Angeles, CA | 2.0 | 2.0 | 1300 | $2,572 | $1.98 | 3d | 2 | 1.13mi |
| 5107 Crenshaw Blvd Unit 2 Los Angeles, CA | 3.0 | 2.0 | 930 | $3,395 | $3.65 | 44d | 1 | 1.13mi |
| 5107 Crenshaw Blvd Unit 5109 Los Angeles, CA | 3.0 | 3.0 | 1165 | $3,495 | $3.00 | 18d | 1 | 1.13mi |
| 534 E Hazel St Inglewood, CA | 2.0 | 2.5 | 1250 | $3,550 | $2.84 | 19d | 1 | 1.15mi |
| 5017 Crenshaw Blvd Unit 1/2 Los Angeles, CA | 2.0 | 1.0 | 950 | $2,500 | $2.63 | 44d | 1 | 1.16mi |
| 417 Centinela Ave Inglewood, CA | 1.0–2.0 | 1.0–2.0 | 883 | $3,450 | $3.90 | 7d | 9 | 1.18mi |
| 215 E Hyde Park Blvd Unit 10 Inglewood, CA | 2.0 | 1.0 | 900 | $2,095 | $2.33 | 3d | 1 | 1.19mi |
| 6515 S Crenshaw Blvd Unit 204 Los Angeles, CA | 2.0 | 2.0 | 880 | $2,550 | $2.90 | 44d | 1 | 1.19mi |
| 6515 Crenshaw Blvd Los Angeles, CA | 2.0 | 1.0 | 935 | $2,550 | $2.73 | 44d | 1 | 1.19mi |
| 317 E Hazel St Unit H Inglewood, CA | 2.0 | 2.0 | 1160 | $2,550 | $2.20 | 24d | 1 | 1.23mi |
| 317 E Hazel St Unit C Inglewood, CA | 2.0 | 1.5 | 900 | $2,350 | $2.61 | 44d | 1 | 1.23mi |
| 5604 S Chariton Ave Los Angeles, CA | 3.0 | 2.0 | 1684 | $5,000 | $2.97 | 44d | 1 | 1.24mi |
Listing history 16 events
-
2026-06-18days on market $865,000 Active 215 DOM
-
2026-06-17days on market $865,000 Active 214 DOM
-
2026-06-16days on market $865,000 Active 213 DOM
-
2026-06-15days on market $865,000 Active 212 DOM
-
2026-06-13days on market $865,000 Active 210 DOM
-
2026-06-09days on market $865,000 Active 206 DOM
-
2026-06-08days on market $865,000 Active 205 DOM
-
2026-06-07days on market $865,000 Active 204 DOM
-
2026-06-04days on market $865,000 Active 201 DOM
-
2026-06-03days on market $865,000 Active 200 DOM
-
2026-06-02days on market $865,000 Active 199 DOM
-
2026-06-01days on market $865,000 Active 198 DOM
-
2026-05-31days on market $865,000 Active 197 DOM
-
2026-03-23price $865,000 780-char remark
Show marketing remark (780 chars)
4214 W. Slauson is a rare opportunity to purchase a multi-family property in the highly desired 90043 zip code. This 3-Unit Investment Opportunity offers one spacious 2bed/1bath and two comfortable 1 bed/1 bath apartments on a 6,255 square foot lot. The LAR3 zoned property adds the possibility to strengthen the buyer(s) investment by converting the 3-car carport and/or adding an ADU (buyer to verify). The building comes with existing tenants in each unit. Some upgrades have been made in units. This is a solid investment opportunity for both seasoned and new operators alike. It offers strong upside, long term growth and favorable tax strategies (consult with a financial professional). The property is sold AS-IS. Please - DO NOT WALK ON PROPERTY. DO NOT DISTURB OCCUPANTS.
-
2025-11-12$965,000 Active 780-char remark
Show marketing remark (780 chars)
4214 W. Slauson is a rare opportunity to purchase a multi-family property in the highly desired 90043 zip code. This 3-Unit Investment Opportunity offers one spacious 2bed/1bath and two comfortable 1 bed/1 bath apartments on a 6,255 square foot lot. The LAR3 zoned property adds the possibility to strengthen the buyer(s) investment by converting the 3-car carport and/or adding an ADU (buyer to verify). The building comes with existing tenants in each unit. Some upgrades have been made in units. This is a solid investment opportunity for both seasoned and new operators alike. It offers strong upside, long term growth and favorable tax strategies (consult with a financial professional). The property is sold AS-IS. Please - DO NOT WALK ON PROPERTY. DO NOT DISTURB OCCUPANTS.
-
1987-03-02soldstatus $135,000
ⓘ Source: listings_history table (triggers on properties + properties_extension) + one-shot
backfill from property_details.listing_events for pre-trigger history.
Tax reassessment forecast CA · Resets to sale price
- Current annual tax
- $3,992 · $333/mo
- Projected year-2 tax
- $6,574 · $548/mo
- Expected delta
- +$2,582/yr (+$215/mo · 64.7%)
ⓘ Screening estimate from a state-policy table — verify with the county assessor before closing.
Climate risk First Street
- Flood 1/10 Low FEMA zone X (unshaded) · 0% chance over 30 yrs
- Wildfire 1/10 Low
- Heat 5/10 Major 7 d/yr ≥87°F today · 19 d/yr by 30 yrs out
- Wind 1/10 Low
- Air quality 5/10 Major 7 unhealthy d/yr today · 7 by 30 yrs out
Nearby sold comps map
Loading sold comps map…
Walkable amenities ~0.75 mi
Loading nearby amenities…
Taxation est. · year 1
- Rental income
- $97,704
- − Mortgage interest
- −$48,453
- − Property taxes
- −$3,992
- − Insurance
- −$4,325
- − Repairs & maintenance
- −$7,816
- − Management
- −$7,816
- − Depreciation
- −$25,164
- Taxable income
- $137
- Est. tax owed @ 24.0%
- −$33
- After-tax cash flow
- $14,402/yr
For passive investors: Depreciation is non-cash, so a rental often shows a tax loss while cash-flowing — sheltering income. Rental losses are passive: they offset passive income freely, and up to $25,000/yr can offset ordinary (W-2) income if you actively participate and your MAGI is under $100k (phasing out to $0 by $150k); unused losses carry forward. On sale, claimed depreciation is recaptured at up to 25%, and gains may owe capital-gains tax (a 1031 exchange can defer both). Figures are a year-1 estimate at your 24.0% rate — not tax advice; consult a CPA.
Schools (NCES district)
- District
- Los Angeles Unified
- NCES district ID
- 0622710
- Math proficiency
- 29% ▼ -4.00%
- Reading proficiency
- 54% ▲ 10.00%
- Median HH income
- $50,403
- Composite
- 35.67/100
- National rank
- #4875
- State rank
- #223 of 517 in CA
Livability — Los Angeles
- Score
- 68/100
- State rank
- #273
- US rank
- #9237
Category grades
Schools grade is shown separately in the Schools card above.
Census & demographics
- Census place
- Los Angeles, CA
- County
- Los Angeles County · 9,444,647 people
- City population
- 3,838,149
- Metro
- Los Angeles-Long Beach-Anaheim, CA
- Population (ZIP)
- 42,377
- Household income
- $64,792
- Rent vs Own
- Severe rent burden
- 3295.0
Population outlook (Los Angeles County) Hauer SSP2
- Today (2025)
- 10,940,515 people
- By 2030
- 11,256,481 · +2.9%
- By 2040
- 11,729,929 · +7.2%
- By 2050
- 11,948,407 · +9.2%
- By 2075
- 11,818,114 · +8.0%
- By 2100
- 10,842,928 · -0.9%
Race, ethnicity, and origin ACS 2023
- Neighborhood character
- Diverse neighborhood (Simpson 0.58)
- Race & ethnicity
- Black 58% Hispanic / Latino 26% Two or more races 16% White 6% Asian 2%
- Hispanic origin (detail)
- Mexican 14%
- Common ancestry
- British 2% Lithuanian 1% Italian 1%
- Foreign-born
- 18% · Canada, South Korea, Jamaica
- Languages at home
- 70% English-only · Spanish 25% French/Haitian/Cajun 1%
Political lean MEDSL · Los Angeles
- 2024 margin
- Solid D (+32.9) · D 64.8% · R 31.9% · Other 3.3%
- 2008→2024 swing
- -7.4pp toward R · 2008: 40.4pp · 2024: 32.9pp
- All cycles
- 2024: D+32.9 2020: D+44.2 2016: D+48.0 2012: D+40.0 2008: D+40.4
Not yet ingested
- Civics
- —
Market trends
- HPI YoY
- ▼ -1382.39%
- Current HPI
- 434.3031
- Rent YoY
- ▲ 5.01%
- Metro
- Los Angeles-Long Beach-Anaheim, CA
- State GDP YoY
- ▲ 3.21%
- F500 in state
- 116
Industry mix (Fortune 500 HQ in CA)
| Industry | F500 HQs | Revenue |
|---|---|---|
| Technology | 27 | $1,492B |
|
||
| Financial Services | 3 | $174B |
|
||
| Retail | 3 | $44B |
|
||
| Insurance | 3 | $26B |
|
||
| Media / Entertainment | 2 | $115B |
|
||
| Pharmaceuticals / Biotech | 2 | $62B |
|
||
Price history
+540.7% since first listed3 events — show timeline
- 2026-03-23 Price Changed $865,000 TheMLS
- 2025-11-12 Listed $965,000 TheMLS
- 1987-03-02 Sold (Public Records) $135,000 Public Records
Property tax history
+1.9%/yrLatest (2025): $3,992 · +2.2% YoY. Source: county tax records.
Cash-flow waterfall
monthlySold comps — $/sqft
last 12 mo · ≤1 miLoading sold comps…