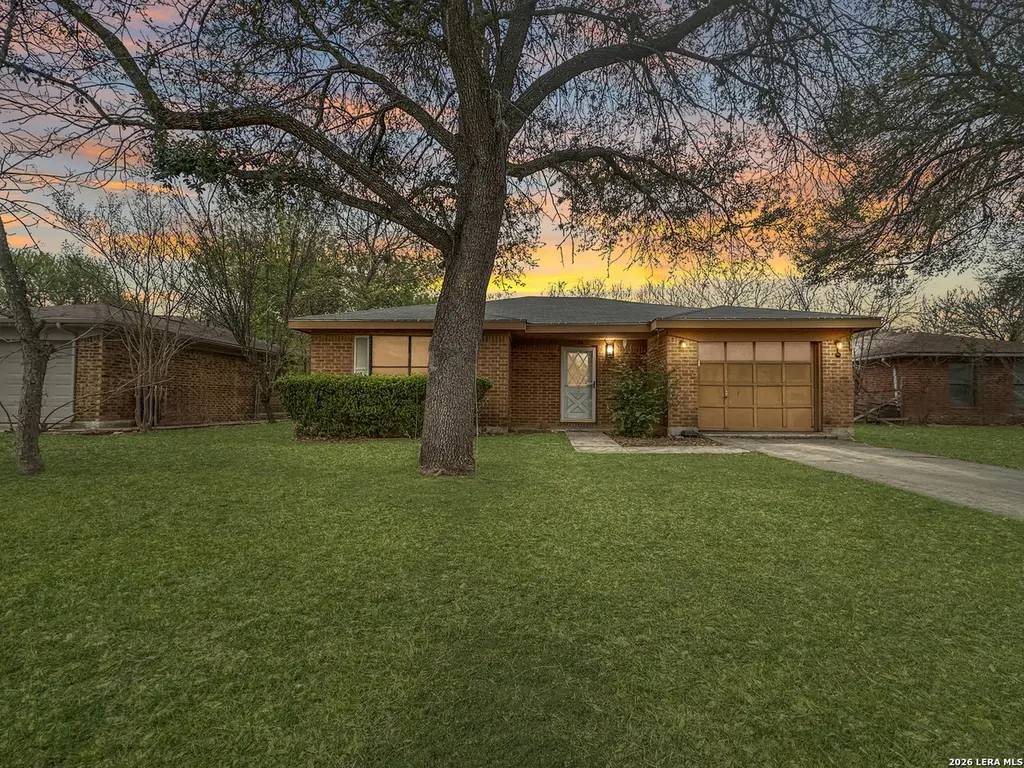
116 Apache Cir · Cibolo, TX
Flood risk 1/10 · Minimal
- FEMA flood zone
- X (unshaded)
- Chance of flooding over 30 yrs
- 0.0%
- Est. flood insurance / yr
- $507 – $1,088
Fire risk 5/10 · Moderate
- Est. fire insurance / yr
- $1,222 – $2,270
Heat risk 8/10 · Major
- Hot days now (above 108°F)
- 7 days/yr
- Hot days in 30 yrs
- 21 days/yr
Wind risk 8/10 · Major
- Chance of severe wind over 30 yrs
- 80.0%
Air-quality risk 1/10 · Minimal
- Unhealthy air days now
- 0 days/yr
- Unhealthy air days in 30 yrs
- 0 days/yr
Risk factors via First Street. Map © Google.
Why this score? — see what drove the B grade
The composite is a weighted blend of 9 inputs, each scored 0–100. Each bar is that input's sub-score; the figure is the points it added to the 100-point composite (weight × sub-score).
- Cash flow +24.3/30.0
- ARV discount +14.2/15.0
- DSCR +7.9/10.0
- 1% rule +6.7/10.0
- Appreciation +5.2/10.0
- Schools +4.4/10.0
- Livability +3.6/5.0
- Rent growth +3.1/5.0
- Condition / age +2.5/5.0
$149,900
🖨 Deal sheet (PDF) 📄 Offer letter ✓ Due diligence
Listing remarks MLS
100% MANSONRY / 2 BEDROOM / ONE BATH / ONE CAR GARAGE / SINGLE LIVING AREA / FRESHLY PAINTED / TILE FLOORS / ALL APPLIANCES REMAINN TO INCLUDE WASHER & DRYER / NEW WINDOW TREATMENTS / PLUS THE OWNER WILL CONTRIBUTE $2400.00 TO CLOSING COST-DOWN PAYMENT / LOCATED ON CUL-DE-SAC STREET /
Key facts
- Few blocks from heb
- Cul de sac
- Nice lot
Tags
Property features AI
Finance
- Other: Possession at closing/funding; For sale
- Financial info: Down payment resources available
- HOA & community: Subdivision legal name: CIBOLO NORTH
Exterior
- Parking: 1-car garage
- Utilities: Public water system
- Home design: Pre-owned home; Located in the Cibolo North subdivision
- Construction: Approximately 42 years old; Slab foundation; Composition roof
- Exterior features: 4-sided masonry exterior
Interior
- Kitchen: Kitchen approximately 13 x 6
- Bedrooms: Master bedroom approximately 14 x 11; Second bedroom approximately 14 x 10
- Flooring: Ceramic tile floors
- Bathrooms: One full bathroom
- Heating & cooling: Central heating (electric); Central air conditioning
- Interior features: Washer and dryer connections; One living area
- Laundry & utility: Washer and dryer connections
Neighborhood map
What this means for you Summary
Snapshot
- This is a 2-bed/1.0-bath single-family listed at $150k.
Deal economics
- At list price, monthly cash flow is $303 ($4k/yr) — positive.
- The deal already cash-flows at list — no discount required.
- Meets the 1% rule at list price ($2k rent vs $150k).
- Recommended offer: $136k (9.0% below list) — sets the bar for market timing.
- Cap rate 8.7% vs local median 3.3% in Cibolo — top-decile yield for the area; either an underpriced asset or a hidden risk that comps aren't pricing in. Stress-test before assuming the spread holds.
Location & tenants
- Location reads 72/100 on livability (#261 in TX) — a middle-class / working-renter tenant base. Strengths: employment A+, housing A+, crime A; Watch: amenities F, commute F, health & safety F.
- Schertz-Cibolo-U City ISD (suburban): math 49% / reading 48% proficiency, ranked #152 of 826 in TX (top 18%) — families likely to look elsewhere, expect single-tenant / working-renter base with shorter leases.
- Zoned schools: Wiederstein El (math 40% / reading 50%, grade D-, #1,133 of 4,322 statewide, top 27%, 551 students, 38% FRL); Dobie J H (math 51% / reading 53%, grade C+, #301 of 1,662 statewide, top 19%, 1,347 students, 31% FRL); Byron P Steele Ii H S (math 68% / reading 66%, grade B, #163 of 1,632 statewide, top 11%, 2,716 students, 25% FRL) — zoned schools at 32% FRL track the district average.
- Market conditions: Rents rising (+2.4%/yr); 761 active listings in the ZIP; 9 comparable units currently listed for rent nearby; rentals leasing fast (median 1d on market — plan ~1-2 weeks tenant-placement turnaround); high-income renter base; 2,064 units permitted in Guadalupe County in 2024 (133 in 5+ unit buildings).
Forward outlook
- In year one you build about $2k of equity ($1k loan paydown + $705 appreciation (0.5% local appreciation)).
- Guadalupe County population projected at +61% by 2050 — long-run rental-demand tailwind backs the buy-and-hold thesis.
- At projected returns (0.5% appreciation + 2.4% rent growth), your $42k cash investment doubles in ~7 years — after that, you're playing with house money.
Negotiation context
- It's been on market 92 days — a 9% lower offer ($136k) is reasonable based on typical stale-listing flexibility.
- 4 sale attempts since 16y ago; this cycle's ask has dropped $9k (6%) from the opening price — seller is motivated, your offer sets the floor, not the list.
Risks & watch-outs
- Climate carrying-cost: severe wind risk, 80% chance of damaging wind over 30y; moderate wildfire risk; extreme-heat days projected 7→21/yr by 2055 (HVAC capex compounding) — expect insurance premiums to compound above CPI over the hold.
Questions for the listing agent
- It's been on market 92 days. Have you received any prior offers? Is the seller open to a 9% concession, seller financing, or rate buy-down credit?
- Why hasn't it sold? Are there any deal-killer items the seller is aware of (foundation, flood, title, zoning, code violations)?
- Is there a deadline driving the sale (1031 exchange, divorce, estate, relocation)? That informs how much negotiation room exists.
- Schools are B-rated — typically a magnet for longer-tenancy family renters. What's the average tenant stay here, and is there a school-zone premium baked into asking?
- What's the average days-on-market for RENTAL listings here right now (not sales)? A rising rental-DOM trend means longer vacancies and softer asking-rent achievability than the comps imply.
- What's the recent tenant-quality profile in this submarket — average credit score on applications, eviction rate, late-payment / NSF rate, and stable-employment percentage? A property-management company in the area should have these aggregated.
- How much new for-sale + rental construction is in the pipeline within 1–3 miles? Heavy new supply typically softens prices + rents 12–24 months out; constrained supply supports both.
Investment metrics
- 1% rule
- 1.17% ✓
- Cap rate
- 8.72%
- Cash-on-cash
- 8.67%
- DSCR
- 1.39
- GRM
- 7.1
CMA / ARV
- ARV (on-the-fly)
- $176,262
- Comps found
- 12
Show comp detail 12 sales within ~0.75 mi
| Address | Dist | Beds/Ba | Sqft | Sold | Price | $/sf | Match |
|---|---|---|---|---|---|---|---|
| 112 Bramblewood Cir | 0.20mi | 2/1.0 | 1,019 (+1%) | 4mo | $165,000 | $162 | 86 |
| 105 Apache | 0.07mi | 2/1.0 | 1,004 (-1%) | 11mo | $175,000 | $174 | 86 |
| 127 Sioux | 0.15mi | 2/1.0 | 962 (-5%) | 2mo | $205,000 | $213 | 83 |
| 122 Sioux | 0.16mi | 2/1.0 | 1,023 (+1%) | 11mo | $160,000 | $156 | 82 |
| 105 Short St St | 0.39mi | 2/1.5 | 1,000 (-1%) | 6mo | $187,000 | $187 | 72 |
| 520 Schlather | 0.23mi | 3/1.5 (+1) | 1,082 (+7%) | 2mo | $165,000 | $152 | 69 |
| 110 Buffalo | 0.10mi | 3/1.0 (+1) | 1,090 (+8%) | 11mo | $214,220 | $197 | 68 |
| 117 Bramblewood Cir | 0.17mi | 3/1.0 (+1) | 1,078 (+6%) | 15mo | $195,000 | $181 | 64 |
| 122 Dobie | 0.67mi | 3/1.0 (+1) | 1,008 (-0%) | 2mo | $170,000 | $169 | 61 |
| 104 Elm | 0.49mi | 3/2.0 (+1) | 1,088 (+7%) | 8mo | $239,000 | $220 | 49 |
| 116 Bramblewood Cir | 0.19mi | 3/1.0 (+1) | 1,156 (+14%) | 18mo | $164,900 | $143 | 47 |
| 205 Wiederstein St | 0.59mi | 2/1.0 | 1,092 (+8%) | 18mo | $125,000 | $114 | 45 |
Match score weights: distance 35% · size 25% · config 20% · recency 20%. Top-matched comps best support the ARV.
Projected returns pro-forma
0.47% appreciation · 2.42% rent growth · sell at horizon
- IRR
- 8.4%
- Equity multiple
- 1.41×
- Total profit
- $17,305
- Equity at exit
- $47,085
- IRR
- 12.5%
- Equity multiple
- 2.42×
- Total profit
- $59,550
- Equity at exit
- $59,523
Cash invested: $41,972 (down + closing). Projections, not guarantees.
Landlord ↔ Tenant lean methodology
- Overall (STATE)
- 87 Strongly Landlord-Friendly
- State Texas
- 87 Strongly Landlord-Friendly · R+5
- County
- — inherits STATE
- City
- — inherits STATE
ZIP-level market 78108
- Home prices YoY
- 0.3%
- Rents YoY
- 2.4%
- Active inventory
- 761
- Price-to-rent
- 7.1×
Monthly cashflow live
- Estimated rent
- $1,748 high interval (Pro) →
- Mortgage (P&I)
- −$786
- Tax from tax record
- −$229 /mo · $2,748/yr
- Insurance
- −$62
- HOA
- −$0
- Vacancy / Maint / Mgmt
- −$367
- Net cashflow
- $303
Break-even live
Sensitivity live
| Price | -10% $388 | -5% $346 | +0% $303 | +5% $261 | +10% $218 |
|---|---|---|---|---|---|
| Rent | -10% $165 | -5% $234 | +0% $303 | +5% $372 | +10% $441 |
| Rate | -1.0pp $379 | -0.5pp $341 | base $303 | +0.5pp $264 | +1.0pp $225 |
UW: 25.0% down · 7.5% · 30yr · 1.5% tax · 5.0% vac · 8.0% maint · 8.0% mgmt
Financing live
Cash to close
- Down payment
- $37,475
- Closing costs
- $4,497
- Reserves months
- —
- Total cash needed
- —
Loan-product check · same deal, 3 products live
Conventional
25% down · 7.5% · 30yr
- Down + closing
- —
- Monthly P&I
- —
- Monthly cashflow
- —
- DSCR
- —
- Eligible?
- —
Personal DTI + credit; lowest rate.
DSCR
20% down · 8.5% · 30yr
- Down + closing
- —
- Monthly P&I
- —
- Monthly cashflow
- —
- DSCR
- —
- Eligible?
- —
No personal income docs; deal must DSCR.
Hard money
10% down · 12.0% · 12mo
- Down + closing
- —
- Monthly P&I
- —
- Monthly cashflow
- —
- DSCR
- —
- Eligible?
- —
Short-term bridge; refi at stabilization.
Rent comps 9 comps
| Address | Beds | Baths | Sqft | Rent | $/sqft | DOM | Units | Dist |
|---|---|---|---|---|---|---|---|---|
| 211 Grand Ave Cibolo, TX | 3.0 | 1.0–2.0 | 948 | $1,593 | $1.68 | 0d | 36 | 0.79mi |
| 325 Colbert Fry Cibolo, TX | 3.0 | 2.0 | 1442 | $2,050 | $1.42 | 26d | 1 | 0.86mi |
| 224 Broad Oak Dr Cibolo, TX | 3.0 | 1.0–2.0 | 966 | $1,598 | $1.65 | 0d | 33 | 0.94mi |
| 315 Cibolo Cmns Cibolo, TX | 1.0–3.0 | 1.0–2.0 | 1052 | $1,599 | $1.52 | 0d | 22 | 1.02mi |
| 124 Anvil Pl Cibolo, TX | 3.0 | 2.0 | 1398 | $1,700 | $1.22 | 26d | 1 | 1.17mi |
| 116 Lone Star Way Cibolo, TX | 3.0 | 2.0 | 1350 | $1,700 | $1.26 | 0d | 1 | 1.19mi |
| 528 Whispering Wl Cibolo, TX | 3.0–5.0 | 2.0–3.5 | 2059 | $2,581 | $1.25 | 0d | 2 | 1.22mi |
| 229 Hereford St Cibolo, TX | 3.0 | 2.0 | 1398 | $1,750 | $1.25 | 26d | 1 | 1.44mi |
| 501 FM 3009 Schertz, TX | 1.0–3.0 | 1.0–2.0 | 873 | $1,554 | $1.78 | 21d | 18 | 1.49mi |
Listing history 28 events
-
2026-06-18days on market $149,900 Active 92 DOM
-
2026-06-17days on market $149,900 Active 91 DOM
-
2026-06-16days on market $149,900 Active 90 DOM
-
2026-06-13days on market $149,900 Active 87 DOM
-
2026-06-13days on market $149,900 Active 86 DOM
-
2026-06-09days on market $149,900 Active 83 DOM
-
2026-06-08days on market $149,900 Active 82 DOM
-
2026-06-07days on market $149,900 Active 81 DOM
-
2026-06-04days on market $149,900 Active 78 DOM
-
2026-06-03days on market $149,900 Active 77 DOM
-
2026-06-02days on market $149,900 Active 76 DOM
-
2026-06-01days on market $149,900 Active 75 DOM
-
2026-05-31days on market $149,900 Active 74 DOM
-
2026-05-12price $149,900
-
2026-03-18$159,000 New
-
2026-03-10historical
-
2026-01-31status Back on Market
-
2026-01-30historical
-
2025-12-18price $165,000
-
2025-11-16price $169,900
-
2025-10-11$174,500 New
-
2023-05-04soldstatus
-
2023-05-02soldstatus
-
2010-12-14soldstatus
-
2010-12-13soldstatus 289-char remark
Show marketing remark (289 chars)
100% MANSONRY / 2 BEDROOM / ONE BATH / ONE CAR GARAGE / SINGLE LIVING AREA / FRESHLY PAINTED / TILE FLOORS / ALL APPLIANCES REMAINN TO INCLUDE WASHER & DRYER / NEW WINDOW TREATMENTS / PLUS THE OWNER WILL CONTRIBUTE $2400.00 TO CLOSING COST-DOWN PAYMENT / LOCATED ON CUL-DE-SAC STREET /
-
2010-10-18historical 289-char remark
Show marketing remark (289 chars)
100% MANSONRY / 2 BEDROOM / ONE BATH / ONE CAR GARAGE / SINGLE LIVING AREA / FRESHLY PAINTED / TILE FLOORS / ALL APPLIANCES REMAINN TO INCLUDE WASHER & DRYER / NEW WINDOW TREATMENTS / PLUS THE OWNER WILL CONTRIBUTE $2400.00 TO CLOSING COST-DOWN PAYMENT / LOCATED ON CUL-DE-SAC STREET /
-
2010-09-13$79,500 289-char remark
Show marketing remark (289 chars)
100% MANSONRY / 2 BEDROOM / ONE BATH / ONE CAR GARAGE / SINGLE LIVING AREA / FRESHLY PAINTED / TILE FLOORS / ALL APPLIANCES REMAINN TO INCLUDE WASHER & DRYER / NEW WINDOW TREATMENTS / PLUS THE OWNER WILL CONTRIBUTE $2400.00 TO CLOSING COST-DOWN PAYMENT / LOCATED ON CUL-DE-SAC STREET /
-
1999-12-29soldstatus
ⓘ Source: listings_history table (triggers on properties + properties_extension) + one-shot
backfill from property_details.listing_events for pre-trigger history.
Tax reassessment forecast TX · Resets to sale price
- Current annual tax
- $2,748 · $229/mo
- Projected year-2 tax
- $2,748 · $229/mo
- Expected delta
- $0/yr ($0/mo · 0.0%)
ⓘ Screening estimate from a state-policy table — verify with the county assessor before closing.
Climate risk First Street
- Flood 1/10 Low FEMA zone X (unshaded) · 0% chance over 30 yrs
- Wildfire 5/10 Major
- Heat 8/10 Severe 7 d/yr ≥108°F today · 21 d/yr by 30 yrs out
- Wind 8/10 Severe 80% chance of damaging wind over 30 yrs
- Air quality 1/10 Low 0 unhealthy d/yr today · 0 by 30 yrs out
Nearby sold comps map
Loading sold comps map…
Walkable amenities ~0.75 mi
Loading nearby amenities…
Taxation est. · year 1
- Rental income
- $20,973
- − Mortgage interest
- −$8,397
- − Property taxes
- −$2,748
- − Insurance
- −$750
- − Repairs & maintenance
- −$1,678
- − Management
- −$1,678
- − Depreciation
- −$4,361
- Taxable income
- $1,362
- Est. tax owed @ 24.0%
- −$327
- After-tax cash flow
- $3,311/yr
For passive investors: Depreciation is non-cash, so a rental often shows a tax loss while cash-flowing — sheltering income. Rental losses are passive: they offset passive income freely, and up to $25,000/yr can offset ordinary (W-2) income if you actively participate and your MAGI is under $100k (phasing out to $0 by $150k); unused losses carry forward. On sale, claimed depreciation is recaptured at up to 25%, and gains may owe capital-gains tax (a 1031 exchange can defer both). Figures are a year-1 estimate at your 24.0% rate — not tax advice; consult a CPA.
Schools (NCES district)
- District
- Schertz-Cibolo-U City ISD
- NCES district ID
- 4839480
- Math proficiency
- 49% ▼ -12.00%
- Reading proficiency
- 48% ▼ -4.00%
- Median HH income
- $75,790
- Composite
- 44.02/100
- National rank
- #2886
- State rank
- #152 of 826 in TX
Livability — Cibolo
- Score
- 72/100
- State rank
- #261
- US rank
- #6177
Category grades
Schools grade is shown separately in the Schools card above.
Census & demographics
- Census place
- Cibolo, TX
- County
- Guadalupe County · 147,291 people
- City population
- 49,784
- Metro
- San Antonio-New Braunfels, TX
- Population (ZIP)
- 49,784
- Household income
- $113,004
- Rent vs Own
- Severe rent burden
- 521.0
Population outlook (Guadalupe County) Hauer SSP2
- Today (2025)
- 196,854 people
- By 2030
- 220,210 · +11.9%
- By 2040
- 268,004 · +36.1%
- By 2050
- 316,333 · +60.7%
- By 2075
- 434,747 · +120.8%
- By 2100
- 520,447 · +164.4%
Race, ethnicity, and origin ACS 2023
- Neighborhood character
- Diverse neighborhood (Simpson 0.68)
- Race & ethnicity
- White 46% Hispanic / Latino 30% Two or more races 22% Black 13% Asian 3%
- Hispanic origin (detail)
- Mexican 22% Puerto Rican 4%
- Common ancestry
- Italian 2% Lithuanian 2% Slovak 2%
- Foreign-born
- 7% · Canada, Vietnam, China
- Languages at home
- 83% English-only · Spanish 13% Vietnamese 1% German/W. Germanic 1%
Political lean MEDSL · Guadalupe
- 2024 margin
- Strong R (+29.5) · D 34.8% · R 64.3%
- 2008→2024 swing
- +1.5pp toward D · 2008: -31.0pp · 2024: -29.5pp
- All cycles
- 2024: R+29.5 2020: R+24.2 2016: R+31.8 2012: R+35.1 2008: R+31.0
Not yet ingested
- Civics
- —
Market trends
- HPI YoY
- ▲ 0.47%
- Current HPI
- 182.7296
- Rent YoY
- ▲ 2.42%
- Metro
- San Antonio-New Braunfels, TX
- State GDP YoY
- ▲ 3.95%
- F500 in state
- 110
Industry mix (Fortune 500 HQ in TX)
| Industry | F500 HQs | Revenue |
|---|---|---|
| Energy | 16 | $1,198B |
|
||
| Technology | 5 | $198B |
|
||
| Engineering / Construction | 4 | $72B |
|
||
| Energy Services | 3 | $60B |
|
||
| Utilities | 3 | $41B |
|
||
| Healthcare | 2 | $330B |
|
||
Price history
+88.6% since first listed15 events — show timeline
- 2026-05-12 Price Changed $149,900 LERA
- 2026-03-18 Listed $159,000 LERA
- 2026-03-10 Listing Removed — LERA
- 2026-01-31 Relisted — LERA
- 2026-01-30 Listing Removed — LERA
- 2025-12-18 Price Changed $165,000 LERA
- 2025-11-16 Price Changed $169,900 LERA
- 2025-10-11 Listed $174,500 LERA
- 2023-05-04 Sold (Public Records) — Public Records
- 2023-05-02 Sold (Public Records) — Public Records
- 2010-12-14 Sold (Public Records) — Public Records
- 2010-12-13 Sold (MLS) — LERA
- 2010-10-18 Listing Removed — LERA
- 2010-09-13 Listed $79,500 LERA
- 1999-12-29 Sold (Public Records) — Public Records
Property tax history
+0.6%/yrLatest (2026): $2,748 · -1.5% YoY. Source: county tax records.
Cash-flow waterfall
monthlySold comps — $/sqft
last 12 mo · ≤1 miLoading sold comps…