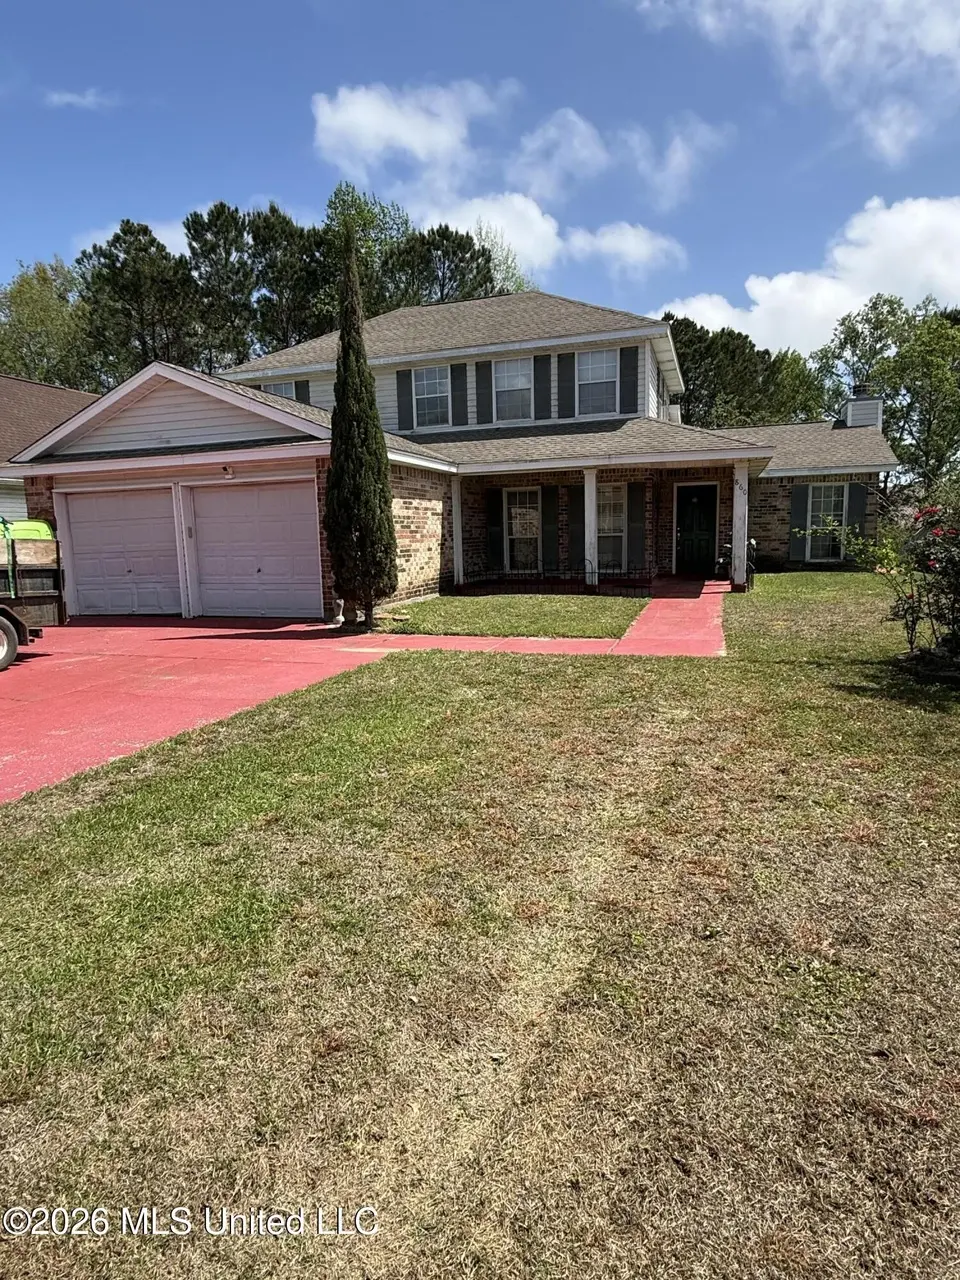
860 Ellington Dr · Biloxi, MS
Flood risk 1/10 · Minimal
- FEMA flood zone
- X (unshaded)
- Chance of flooding over 30 yrs
- 0.0%
- Est. flood insurance / yr
- $507 – $1,088
Fire risk 2/10 · Minimal
- Est. fire insurance / yr
- $1,241 – $2,305
Heat risk 10/10 · Severe
- Hot days now (above 106°F)
- 7 days/yr
- Hot days in 30 yrs
- 23 days/yr
Wind risk 9/10 · Severe
- Chance of severe wind over 30 yrs
- 99.0%
Air-quality risk 2/10 · Minimal
- Unhealthy air days now
- 1 days/yr
- Unhealthy air days in 30 yrs
- 2 days/yr
Risk factors via First Street. Map © Google.
Why this score? — see what drove the B- grade
The composite is a weighted blend of 9 inputs, each scored 0–100. Each bar is that input's sub-score; the figure is the points it added to the 100-point composite (weight × sub-score).
- Cash flow +23.9/30.0
- ARV discount +15.0/15.0
- DSCR +7.7/10.0
- 1% rule +5.2/10.0
- Schools +4.5/10.0
- Livability +4.0/5.0
- Rent growth +3.2/5.0
- Condition / age +2.5/5.0
- Appreciation +0.0/10.0
$225,000
🖨 Deal sheet 📄 Offer letter ✓ Due diligence
Listing remarks
Buyer to verify all information. Fixer upper in a great neighborhood. This spacious 3 bedroom home is ready for updates. Bonus office space downstairs and bonus living space upstairs
Key facts
- Bonus office space
- Bonus living space
- 0.27 acre lot
Tags
Property features AI
Finance
- HOA & community: Community features include proximity to entertainment and sidewalks
Exterior
- Parking: Attached garage with direct access; Garage faces front; Concrete driveway; 2-car garage
- Security: Owned security system; Deadbolt locks
- Utilities: Public water; Public sewer; Cable connected; Electricity connected; Water connected
- Home design: Single-family residence (house); Two levels
- Construction: Brick construction; Asphalt shingle roof; Slab foundation; Built according to public records
- Exterior features: Front porch; Interior lot; Near entertainment; Sidewalks; Lot dimensions approximately 74 x 168 x 72 x 162
Interior
- Kitchen: Dishwasher; Electric range; Free-standing refrigerator; Microwave; Granite counters; Eat-in kitchen layout
- Bedrooms: Primary bedroom on the downstairs level
- Flooring: Bamboo flooring; Tile flooring
- Bathrooms: Two full bathrooms and one half bathroom (2.5 total)
- Heating & cooling: Central heating (natural gas); Central air conditioning; Electric and gas utilities for cooling; Ceiling fans
- Interior features: Ceiling fans; Eat-in kitchen; Entrance foyer; Granite counters; His and hers closets; Pantry; Smart home features; Soaking tub; Walk-in closets; Living room fireplace; Blinds and drapes; Deadbolt locks
- Laundry & utility: Indoor laundry room; Water heater
Neighborhood map
What this means for you Summary
Snapshot
- This is a 3-bed/1.5-bath single-family listed at $225k.
Deal economics
- At list price, monthly cash flow is $435 ($5k/yr) — positive.
- The deal already cash-flows at list — no discount required.
- Meets the 1% rule at list price ($2k rent vs $225k).
- Recommended offer: $222k (1.5% below list) — sets the bar for market timing.
- Cap rate 8.6% vs local median 3.5% in Biloxi — top-decile yield for the area; either an underpriced asset or a hidden risk that comps aren't pricing in. Stress-test before assuming the spread holds.
Location & tenants
- Location reads 79/100 on livability (#6 in MS, #2,141 nationally) — a middle-class / working-renter tenant base. Strengths: crime A+, cost of living A+, housing A+; Watch: commute D+, amenities F, employment D-.
- Biloxi Public School District (urban): math 60% / reading 48% proficiency, ranked #7 of 130 in MS (top 5%) — acceptable for families but not a draw, mixed tenant base, ~2y average lease.
- Zoned schools: Biloxi High School (math 65% / reading 53%, grade C+, #7 of 197 statewide, top 3%, 1,728 students, 100% FRL) — zoned schools average 100% FRL vs 59% district-wide (40 pts higher); higher-poverty schools than district average — tighter screening recommended.
- Market conditions: Rents rising (+3.0%/yr); 392 active listings in the ZIP; 6 comparable units currently listed for rent nearby; rentals lingering (median 44d on market — plan ~5-8 weeks vacancy on turnover, expect pricing pressure); 50% of comp listings sitting > 30 days — soft ceiling on asking rent; 2,194 units permitted in Harrison County in 2024 (0 in 5+ unit buildings).
- This rent runs 40% of the median local income ($69k/yr) — at the standard rent-burdened threshold; future hikes will face affordability resistance.
Forward outlook
- Local home prices are declining (-3.0%/yr); year-one equity from $2k of loan paydown is wiped out by about $7k of value loss. Plan a longer hold.
- Harrison County population projected at +27% by 2050 — long-run rental-demand tailwind backs the buy-and-hold thesis.
Negotiation context
- It's been on market 15 days — a 2% lower offer ($222k) is reasonable based on typical stale-listing flexibility.
Risks & watch-outs
- Climate carrying-cost: severe wind risk, 99% chance of damaging wind over 30y; extreme-heat days projected 7→23/yr by 2055 (HVAC capex compounding) — expect insurance premiums to compound above CPI over the hold.
Questions for the listing agent
- Is there a deadline driving the sale (1031 exchange, divorce, estate, relocation)? That informs how much negotiation room exists.
- What's the average days-on-market for RENTAL listings here right now (not sales)? A rising rental-DOM trend means longer vacancies and softer asking-rent achievability than the comps imply.
- What's the recent tenant-quality profile in this submarket — average credit score on applications, eviction rate, late-payment / NSF rate, and stable-employment percentage? A property-management company in the area should have these aggregated.
- How much new for-sale + rental construction is in the pipeline within 1–3 miles? Heavy new supply typically softens prices + rents 12–24 months out; constrained supply supports both.
Investment metrics
- 1% rule
- 1.02% ✓
- Cap rate
- 8.61%
- Cash-on-cash
- 8.29%
- DSCR
- 1.37
- GRM
- 8.2
CMA / ARV
- ARV (on-the-fly)
- $316,536
- Comps found
- 12
Show comp detail 12 sales within ~0.75 mi
| Address | Dist | Beds/Ba | Sqft | Sold | Price | $/sf | Match |
|---|---|---|---|---|---|---|---|
| 860 Ellington Dr | 0.00mi | 3/2.5 | 2,398 (0%) | 0mo | $225,000 | $94 | 96 |
| 828 Ellington Dr | 0.19mi | 4/2.5 (+1) | 2,411 (+0%) | 0mo | $315,000 | $131 | 81 |
| 1585 Knoll Ct | 0.10mi | 4/2.5 (+1) | 2,316 (-3%) | 11mo | $298,000 | $129 | 72 |
| 872 Brentwood Dr | 0.13mi | 4/2.0 (+1) | 2,317 (-3%) | 15mo | $300,000 | $129 | 68 |
| 1570 Redwood Ct | 0.10mi | 4/2.0 (+1) | 2,331 (-3%) | 18mo | $295,000 | $127 | 68 |
| 860 Brentwood Dr | 0.07mi | 3/2.5 | 2,085 (-13%) | 6mo | $277,900 | $133 | 66 |
| 874 Brentwood Dr | 0.13mi | 4/2.0 (+1) | 2,166 (-10%) | 6mo | $285,000 | $132 | 66 |
| 1589 Knoll Ct | 0.11mi | 4/2.5 (+1) | 2,309 (-4%) | 20mo | $299,000 | $129 | 63 |
| 833 Heron Cv | 0.28mi | 3/2.0 | 2,075 (-14%) | 10mo | $273,000 | $132 | 54 |
| 1580 Applewood Ct | 0.08mi | 4/2.0 (+1) | 2,073 (-14%) | 15mo | $291,000 | $140 | 54 |
| 769 Baybreeze Dr | 0.70mi | 4/3.5 (+1) | 2,072 (-14%) | 15mo | $330,900 | $160 | 19 |
| 765 Baybreeze Dr | 0.72mi | 4/3.5 (+1) | 2,072 (-14%) | 21mo | $334,900 | $162 | 13 |
Match score weights: distance 35% · size 25% · config 20% · recency 20%. Top-matched comps best support the ARV.
Projected returns pro-forma
-3.0% appreciation · 2.98% rent growth · sell at horizon
- IRR
- -3.8%
- Equity multiple
- 0.86×
- Total profit
- $-8,869
- Equity at exit
- $33,548
- IRR
- 5.9%
- Equity multiple
- 1.44×
- Total profit
- $27,466
- Equity at exit
- $19,454
Cash invested: $63,000 (down + closing). Projections, not guarantees.
Landlord ↔ Tenant lean methodology
- Overall (STATE)
- 90 Strongly Landlord-Friendly
- State Mississippi
- 90 Strongly Landlord-Friendly · R+11
- County
- — inherits STATE
- City
- — inherits STATE
ZIP-level market 39532
- Rents YoY
- 3.0%
- Active inventory
- 392
- Price-to-rent
- 8.2×
Monthly cashflow live
- Estimated rent
- $2,293 high interval (Pro) →
- Mortgage (P&I)
- −$1,180
- Tax from tax record
- −$102 /mo · $1,229/yr
- Insurance
- −$94
- HOA
- −$0
- Vacancy / Maint / Mgmt
- −$481
- Net cashflow
- $435
Break-even live
UW: 25.0% down · 7.5% · 30yr · 1.5% tax · 5.0% vac · 8.0% maint · 8.0% mgmt
Financing live
Cash to close
- Down payment
- $56,250
- Closing costs
- $6,750
- Reserves months
- —
- Total cash needed
- —
Loan-product check · same deal, 3 products live
Conventional
25% down · 7.5% · 30yr
- Down + closing
- —
- Monthly P&I
- —
- Monthly cashflow
- —
- DSCR
- —
- Eligible?
- —
Personal DTI + credit; lowest rate.
DSCR
20% down · 8.5% · 30yr
- Down + closing
- —
- Monthly P&I
- —
- Monthly cashflow
- —
- DSCR
- —
- Eligible?
- —
No personal income docs; deal must DSCR.
Hard money
10% down · 12.0% · 12mo
- Down + closing
- —
- Monthly P&I
- —
- Monthly cashflow
- —
- DSCR
- —
- Eligible?
- —
Short-term bridge; refi at stabilization.
Rent comps 6 comps
| Address | Beds | Baths | Sqft | Rent | $/sqft | DOM | Units | Dist |
|---|---|---|---|---|---|---|---|---|
| 876 Kirkwood Dr Biloxi, MS | 4.0 | 3.0 | 2008 | $2,300 | $1.15 | 43d | 1 | 0.10mi |
| 630 Bay Cove Dr #313 Biloxi, MS | 3.0 | 2.0 | 2310 | $3,450 | $1.49 | 20d | 1 | 1.33mi |
| 630 Bay Cove Dr Biloxi, MS | 2.0–3.0 | 2.0 | 1780 | $3,450 | $1.94 | 43d | 2 | 1.33mi |
| 508 Tasha Dr Diberville, MS | 3.0 | 2.0 | 1890 | $3,200 | $1.69 | 43d | 1 | 1.33mi |
| 4441 Audubon Trl Biloxi, MS | 3.0 | 2.5 | 1704 | $3,800 | $2.23 | 20d | 1 | 1.36mi |
| 10480 Auto Mall Pkwy Diberville, MS | 1.0–3.0 | 1.0–2.0 | 1281 | $1,907 | $1.49 | 13d | 1 | 1.48mi |
Listing history 3 events
-
2026-04-15status Pending
-
2026-03-31$225,000 Active
-
2026-03-19soldstatus
ⓘ Source: listings_history table (triggers on properties + properties_extension) + one-shot
backfill from property_details.listing_events for pre-trigger history.
Tax reassessment forecast MS · Resets to sale price
- Current annual tax
- $1,229 · $102/mo
- Projected year-2 tax
- $1,778 · $148/mo
- Expected delta
- +$549/yr (+$46/mo · 44.7%)
ⓘ Screening estimate from a state-policy table — verify with the county assessor before closing.
Climate risk First Street
- Flood 1/10 Low FEMA zone X (unshaded) · 0% chance over 30 yrs
- Wildfire 2/10 Low
- Heat 10/10 Extreme 7 d/yr ≥106°F today · 23 d/yr by 30 yrs out
- Wind 9/10 Extreme 99% chance of damaging wind over 30 yrs
- Air quality 2/10 Low 1 unhealthy d/yr today · 2 by 30 yrs out
Nearby sold comps map
Loading sold comps map…
Walkable amenities ~0.75 mi
Loading nearby amenities…
Taxation est. · year 1
- Rental income
- $27,511
- − Mortgage interest
- −$12,603
- − Property taxes
- −$1,229
- − Insurance
- −$1,125
- − Repairs & maintenance
- −$2,201
- − Management
- −$2,201
- − Depreciation
- −$6,545
- Taxable income
- $1,607
- Est. tax owed @ 24.0%
- −$386
- After-tax cash flow
- $4,836/yr
For passive investors: Depreciation is non-cash, so a rental often shows a tax loss while cash-flowing — sheltering income. Rental losses are passive: they offset passive income freely, and up to $25,000/yr can offset ordinary (W-2) income if you actively participate and your MAGI is under $100k (phasing out to $0 by $150k); unused losses carry forward. On sale, claimed depreciation is recaptured at up to 25%, and gains may owe capital-gains tax (a 1031 exchange can defer both). Figures are a year-1 estimate at your 24.0% rate — not tax advice; consult a CPA.
Schools (NCES district)
- District
- Biloxi Public School District
- NCES district ID
- 2800630
- Math proficiency
- 60% ▼ -7.00%
- Reading proficiency
- 48% ▼ -3.00%
- Median HH income
- $40,608
- Composite
- 45.26/100
- National rank
- #2657
- State rank
- #7 of 130 in MS
Livability — Biloxi
- Score
- 79/100
- State rank
- #6
- US rank
- #2141
Category grades
Schools grade is shown separately in the Schools card above.
Census & demographics
- Census place
- Biloxi, MS
- County
- Harrison County · 178,171 people
- City population
- 63,281
- Metro
- Gulfport-Biloxi, MS
- Population (ZIP)
- 36,662
- Household income
- $68,710
- Rent vs Own
- Severe rent burden
- 954.0
Population outlook (Harrison County) Hauer SSP2
- Today (2025)
- 228,444 people
- By 2030
- 241,942 · +5.9%
- By 2040
- 267,531 · +17.1%
- By 2050
- 291,062 · +27.4%
- By 2075
- 346,711 · +51.8%
- By 2100
- 378,165 · +65.5%
Race, ethnicity, and origin ACS 2023
- Neighborhood character
- Predominantly White (69%)
- Race & ethnicity
- White 69% Black 15% Two or more races 9% Hispanic / Latino 6% Asian 4%
- Hispanic origin (detail)
- Mexican 2%
- Common ancestry
- Lithuanian 5% Italian 2% Serbian 2%
- Foreign-born
- 4% · Vietnam, Canada
- Languages at home
- 94% English-only · Spanish 2% Vietnamese 1% Other Indo-European 1%
Political lean MEDSL · Harrison
- 2024 margin
- Strong R (+28.9) · D 35.0% · R 63.9% · Other 1.1%
- 2008→2024 swing
- -2.9pp toward R · 2008: -26.0pp · 2024: -28.9pp
- All cycles
- 2024: R+28.9 2020: R+25.2 2016: R+30.7 2012: R+26.6 2008: R+26.0
Not yet ingested
- Civics
- —
Market trends
- HPI YoY
- ▼ -90.04%
- Current HPI
- 154.9975
- Rent YoY
- ▲ 2.98%
- Metro
- Gulfport-Biloxi, MS
- State GDP YoY
- —
- F500 in state
- 0
Price history
3 events — show timeline
- 2026-04-15 Pending — MLSU
- 2026-03-31 Listed $225,000 MLSU
- 2026-03-19 Sold (Public Records) — Public Records
Property tax history
-2.9%/yrLatest (2025): $1,229 · +0.9% YoY. Source: county tax records.
Cash-flow waterfall
monthlySold comps — $/sqft
last 12 mo · ≤1 miLoading sold comps…