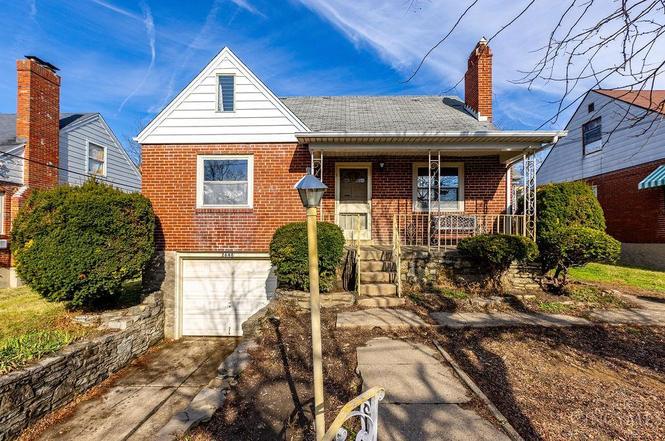
2640 Gehrum Ln · Cincinnati, OH
Flood risk 1/10 · Minimal
- FEMA flood zone
- X (unshaded)
- Chance of flooding over 30 yrs
- 0.0%
- Est. flood insurance / yr
- $473 – $860
Fire risk 1/10 · Minimal
- Est. fire insurance / yr
- $713 – $1,323
Heat risk 4/10 · Minor
- Hot days now (above 103°F)
- 7 days/yr
- Hot days in 30 yrs
- 19 days/yr
Wind risk 2/10 · Minimal
- Chance of severe wind over 30 yrs
- 1.0%
Air-quality risk 3/10 · Minor
- Unhealthy air days now
- 3 days/yr
- Unhealthy air days in 30 yrs
- 5 days/yr
Risk factors via First Street. Map © Google.
Why this score? — see what drove the B grade
The composite is a weighted blend of 9 inputs, each scored 0–100. Each bar is that input's sub-score; the figure is the points it added to the 100-point composite (weight × sub-score).
- Cash flow +27.0/30.0
- ARV discount +15.0/15.0
- DSCR +9.3/10.0
- 1% rule +7.3/10.0
- Livability +4.0/5.0
- Rent growth +3.7/5.0
- Schools +2.5/10.0
- Condition / age +2.5/5.0
- Appreciation +0.0/10.0
$130,000
🖨 Deal sheet (PDF) 📄 Offer letter ✓ Due diligence
Listing remarks MLS
Pride of ownership shows in this cozy cape on cul-de-sac. Loaded w/unique character. Xlarge eat-in kitchen w/walkout. Paneled dormer rooms, patio & rock garden. Meticulously cared for over the years and it shows-a must see!
Key facts
- 5,881 sq ft lot
- Garage
- Built 1941
Property features AI
Finance
- Other: Residential zoning; Lease not considered
- HOA & community: No homeowners association
Exterior
- Parking: Attached front garage (1-car); Driveway parking; On-street parking
- Utilities: Public water; Public sewer; Natural gas available
- Home design: A-Frame architectural style; Single family home; One and one half levels; Poured foundation
- Construction: Brick construction; Shingle roof
- Exterior features: Vinyl windows; Less than 0.5 acre lot; Lot dimensions approximately 50 x 120
Interior
- Kitchen: Kitchen (8 x 15); Breakfast room (7 x 11); Dining room (9 x 11)
- Bedrooms: Three bedrooms total; Primary bedroom on level 1 (12 x 11); Bedroom 2 on level 1 (10 x 11); Bedroom 3 on level 2 (15 x 12)
- Bathrooms: One full bathroom on level 1; Primary bathroom listed as other
- Heating & cooling: Gas heating; Central air; Gas water heating
- Interior features: Seven total rooms; Full basement
Neighborhood map
What this means for you Summary
Snapshot
- This is a 3-bed/1.0-bath single-family listed at $130k.
Deal economics
- At list price, monthly cash flow is $363 ($4k/yr) — positive.
- The deal already cash-flows at list — no discount required.
- Meets the 1% rule at list price ($2k rent vs $130k).
- Recommended offer: $114k (12.0% below list) — sets the bar for market timing.
- Cap rate 9.6% vs local median 3.9% in Cincinnati — top-decile yield for the area; either an underpriced asset or a hidden risk that comps aren't pricing in. Stress-test before assuming the spread holds.
Location & tenants
- Location reads 80/100 on livability (#130 in OH, #1,856 nationally) — a professional / high-income tenant draw. Strengths: amenities A+, commute A+, cost of living A+; Watch: employment D, crime F.
- Cincinnati Public Schools (urban): math 25% / reading 36% proficiency, ranked #581 of 656 in OH (top 89%) — families likely to look elsewhere, expect single-tenant / working-renter base with shorter leases; 70% free/reduced lunch — lower-income household profile, screen leases tightly.
- Market conditions: Rents rising fast (+4.9%/yr); 78 active listings in the ZIP; 26 comparable units currently listed for rent nearby; rentals at typical pace (median 22d on market — plan ~3-4 weeks tenant-placement turnaround); 801 units permitted in Hamilton County in 2024 (190 in 5+ unit buildings).
Forward outlook
- Local home prices are declining (-3.0%/yr); year-one equity from $899 of loan paydown is wiped out by about $4k of value loss. Plan a longer hold.
- At projected returns (-3.0% appreciation + 4.9% rent growth), your $36k cash investment doubles in ~8 years — after that, you're playing with house money.
Negotiation context
- It's been on market 163 days — a 12% lower offer ($114k) is reasonable based on typical stale-listing flexibility.
- 2 sale attempts since 21y ago; this cycle's ask has dropped $10k (7%) from the opening price — seller is motivated, your offer sets the floor, not the list.
- Current owner paid $88k; 48% above their basis — modest negotiation headroom, anchor on the comps not their cost.
Risks & watch-outs
- Watch-outs: built in 1941 — expect roof / HVAC / electrical / plumbing capex.
Questions for the listing agent
- It's been on market 163 days. Have you received any prior offers? Is the seller open to a 12% concession, seller financing, or rate buy-down credit?
- Built in 1941 — when were the roof, HVAC, electrical panel, plumbing, and water heater last replaced?
- Why hasn't it sold? Are there any deal-killer items the seller is aware of (foundation, flood, title, zoning, code violations)?
- Is there a deadline driving the sale (1031 exchange, divorce, estate, relocation)? That informs how much negotiation room exists.
- Schools are B-rated — typically a magnet for longer-tenancy family renters. What's the average tenant stay here, and is there a school-zone premium baked into asking?
- Crime grade is F in this area — have there been break-ins, vandalism, or insurance claims at this property in the last 3 years? What carrier currently insures it and at what premium?
- What's the average days-on-market for RENTAL listings here right now (not sales)? A rising rental-DOM trend means longer vacancies and softer asking-rent achievability than the comps imply.
- What's the recent tenant-quality profile in this submarket — average credit score on applications, eviction rate, late-payment / NSF rate, and stable-employment percentage? A property-management company in the area should have these aggregated.
- How much new for-sale + rental construction is in the pipeline within 1–3 miles? Heavy new supply typically softens prices + rents 12–24 months out; constrained supply supports both.
Investment metrics
- 1% rule
- 1.23% ✓
- Cap rate
- 9.65%
- Cash-on-cash
- 11.98%
- DSCR
- 1.53
- GRM
- 6.8
CMA / ARV
- ARV (on-the-fly)
- $247,902
- Comps found
- 12
Show comp detail 12 sales within ~0.75 mi
| Address | Dist | Beds/Ba | Sqft | Sold | Price | $/sf | Match |
|---|---|---|---|---|---|---|---|
| 2739 Queenswood Dr | 0.35mi | 3/3.0 | 1,600 (+2%) | 1mo | $327,500 | $205 | 72 |
| 2739 Westbrook Dr | 0.21mi | 3/1.5 | 1,467 (-6%) | 6mo | $115,000 | $78 | 72 |
| 2795 Westbrook Dr | 0.31mi | 3/2.0 | 1,475 (-6%) | 1mo | $285,500 | $194 | 71 |
| 2751 Westbrook Dr | 0.25mi | 3/3.0 | 1,769 (+13%) | 0mo | $355,000 | $201 | 59 |
| 2635 Ocosta Ave | 0.65mi | 3/1.5 | 1,654 (+5%) | 1mo | $240,000 | $145 | 58 |
| 1772 Tuxworth Ave | 0.67mi | 3/2.0 | 1,493 (-5%) | 0mo | $155,000 | $104 | 56 |
| 4925 Shirley Pl | 0.67mi | 3/2.0 | 1,456 (-7%) | 1mo | $230,000 | $158 | 52 |
| 3088 Queen City Ave | 0.73mi | 3/1.0 | 1,684 (+7%) | 7mo | $146,000 | $87 | 48 |
| 1702 Ashbrook Dr | 0.73mi | 3/1.0 | 1,369 (-13%) | 2mo | $139,900 | $102 | 43 |
| 2654 Ocosta Ave | 0.65mi | 3/2.5 | 1,769 (+13%) | 0mo | $305,000 | $172 | 42 |
| 3010 Ferguson Rd | 0.59mi | 4/1.5 (+1) | 1,345 (-14%) | 2mo | $134,000 | $100 | 40 |
| 2630 Cyclorama Dr | 0.67mi | 4/3.0 (+1) | 1,413 (-10%) | 0mo | $330,500 | $234 | 39 |
Match score weights: distance 35% · size 25% · config 20% · recency 20%. Top-matched comps best support the ARV.
Projected returns pro-forma
-3.0% appreciation · 4.87% rent growth · sell at horizon
- IRR
- 3.6%
- Equity multiple
- 1.14×
- Total profit
- $5,185
- Equity at exit
- $19,383
- IRR
- 14.9%
- Equity multiple
- 2.31×
- Total profit
- $47,533
- Equity at exit
- $11,240
Cash invested: $36,400 (down + closing). Projections, not guarantees.
Landlord ↔ Tenant lean methodology
- Overall (STATE)
- 73 Landlord-Friendly
- State Ohio
- 73 Landlord-Friendly · R+6
- County
- — inherits STATE
- City
- — inherits STATE
ZIP-level market 45238
- Rents YoY
- 4.9%
- Active inventory
- 78
- Price-to-rent
- 6.8×
Monthly cashflow live
- Estimated rent
- $1,603 high interval (Pro) →
- Mortgage (P&I)
- −$682
- Tax from tax record
- −$167 /mo · $2,003/yr
- Insurance
- −$54
- HOA
- −$0
- Vacancy / Maint / Mgmt
- −$337
- Net cashflow
- $363
Break-even live
Sensitivity live
| Price | -10% $437 | -5% $400 | +0% $363 | +5% $327 | +10% $290 |
|---|---|---|---|---|---|
| Rent | -10% $237 | -5% $300 | +0% $363 | +5% $427 | +10% $490 |
| Rate | -1.0pp $429 | -0.5pp $397 | base $363 | +0.5pp $330 | +1.0pp $296 |
UW: 25.0% down · 7.5% · 30yr · 1.5% tax · 5.0% vac · 8.0% maint · 8.0% mgmt
Financing live
Cash to close
- Down payment
- $32,500
- Closing costs
- $3,900
- Reserves months
- —
- Total cash needed
- —
Loan-product check · same deal, 3 products live
Conventional
25% down · 7.5% · 30yr
- Down + closing
- —
- Monthly P&I
- —
- Monthly cashflow
- —
- DSCR
- —
- Eligible?
- —
Personal DTI + credit; lowest rate.
DSCR
20% down · 8.5% · 30yr
- Down + closing
- —
- Monthly P&I
- —
- Monthly cashflow
- —
- DSCR
- —
- Eligible?
- —
No personal income docs; deal must DSCR.
Hard money
10% down · 12.0% · 12mo
- Down + closing
- —
- Monthly P&I
- —
- Monthly cashflow
- —
- DSCR
- —
- Eligible?
- —
Short-term bridge; refi at stabilization.
Rent comps 26 comps
| Address | Beds | Baths | Sqft | Rent | $/sqft | DOM | Units | Dist |
|---|---|---|---|---|---|---|---|---|
| 2621 Gehrum Ln Cincinnati, OH | 3.0 | 1.0 | 1373 | $1,850 | $1.35 | 25d | 1 | 0.08mi |
| 2682 Lafeuille Cir Cincinnati, OH | 2.0–3.0 | 1.0–2.0 | 950 | $1,574 | $1.66 | 4d | 16 | 0.14mi |
| 2706 E Tower Dr Cincinnati, OH | 1.0–3.0 | 1.0–2.0 | 951 | $1,520 | $1.60 | 3d | 61 | 0.18mi |
| 2511 Ferguson Rd Unit 2537 Cincinnati, OH | 3.0 | 1.5 | 1100 | $1,650 | $1.50 | 25d | 1 | 0.47mi |
| 1723 Tuxworth Ave Cincinnati, OH | 3.0 | 2.0 | 1587 | $1,800 | $1.13 | 25d | 1 | 0.71mi |
| 2854 Shaffer Ave Unit 1 Cincinnati, OH | 2.0 | 1.0 | 1100 | $1,125 | $1.02 | 15d | 1 | 0.92mi |
| 3052 Worthington Ave Cincinnati, OH | 3.0 | 1.0 | 1105 | $1,195 | $1.08 | 5d | 1 | 0.98mi |
| 3245 Koenig Ave Cincinnati, OH | 4.0 | 2.0 | 2045 | $2,475 | $1.21 | 3d | 1 | 1.00mi |
| 5256 Ponce Ln Cincinnati, OH | 3.0 | 2.0 | 1270 | $1,866 | $1.47 | 3d | 1 | 1.02mi |
| 3157 Sunshine Ave Cincinnati, OH | 3.0 | 2.0 | 1894 | $1,825 | $0.96 | 4d | 1 | 1.19mi |
| 1740 Minion Ave Cincinnati, OH | 2.0 | 1.0 | 1320 | $1,200 | $0.91 | 25d | 1 | 1.20mi |
| 3064 Aquadale Ln Cincinnati, OH | 3.0 | 3.0 | 1102 | $1,850 | $1.68 | 25d | 1 | 1.21mi |
| 1240 Rosemont Ave Cincinnati, OH | 2.0 | 1.0 | 1280 | $1,100 | $0.86 | 21d | 1 | 1.22mi |
| 1311 Manss Ave Cincinnati, OH | 4.0 | 1.0 | 1409 | $1,295 | $0.92 | 5d | 1 | 1.24mi |
| 1233 Dewey Ave Cincinnati, OH | 3.0 | 1.0 | 1411 | $1,375 | $0.97 | 5d | 1 | 1.25mi |
| 2117 Saint Leo Pl Cincinnati, OH | 2.0 | 1.0 | 1050 | $1,150 | $1.10 | 25d | 1 | 1.28mi |
| 3283 Pickbury Dr Cincinnati, OH | 4.0 | 2.0 | 2100 | $2,400 | $1.14 | 45d | 1 | 1.31mi |
| 1214 Gilsey Ave Cincinnati, OH | 3.0 | 1.0 | 1300 | $1,300 | $1.00 | 21d | 1 | 1.32mi |
| 1214 Gilsey Ave Cincinnati, OH | 3.0 | 1.0 | 1300 | $1,300 | $1.00 | 25d | 1 | 1.32mi |
| 1607 Minion Ave Cincinnati, OH | 3.0 | 1.5 | 1066 | $1,675 | $1.57 | 25d | 1 | 1.32mi |
| 1620 Minion Ave Cincinnati, OH | 4.0 | 2.0 | 1845 | $1,550 | $0.84 | 21d | 1 | 1.32mi |
| 3772 W Liberty St Cincinnati, OH | 3.0 | 1.0 | 1066 | $1,350 | $1.27 | 5d | 1 | 1.36mi |
| 1031 Schiff Ave Cincinnati, OH | 2.0 | 1.0 | 2142 | $1,300 | $0.61 | 22d | 1 | 1.39mi |
| 3414 Corrine Ave Cincinnati, OH | 3.0 | 2.0 | 1542 | $1,861 | $1.21 | 3d | 1 | 1.46mi |
| 3114 Roosevelt Ave Cincinnati, OH | 3.0 | 1.0 | 1450 | $1,400 | $0.97 | 25d | 1 | 1.48mi |
| 2678 Montana Ave Cincinnati, OH | 1.0–3.0 | 1.0–2.0 | 935 | $1,470 | $1.57 | 3d | 10 | 1.49mi |
Listing history 18 events
-
2026-06-21days on market $130,000 Active 163 DOM
-
2026-06-18days on market $130,000 Active 160 DOM
-
2026-06-17days on market $130,000 Active 159 DOM
-
2026-06-16days on market $130,000 Active 158 DOM
-
2026-06-15days on market $130,000 Active 157 DOM
-
2026-06-13days on market $130,000 Active 155 DOM
-
2026-06-13days on market $130,000 Active 154 DOM
-
2026-06-09days on market $130,000 Active 151 DOM
-
2026-06-08days on market $130,000 Active 150 DOM
-
2026-06-07days on market $130,000 Active 149 DOM
-
2026-06-03days on market $130,000 Active 145 DOM
-
2026-06-02days on market $130,000 Active 144 DOM
-
2026-06-01days on market $130,000 Active 143 DOM
-
2026-05-31days on market $130,000 Active 142 DOM
-
2026-03-30price $130,000
-
2026-01-09$140,000 Active
-
2005-08-02soldstatus $88,000 227-char remark
Show marketing remark (227 chars)
Pride of ownership shows in this cozy cape on cul-de-sac. Loaded w/unique character. Xlarge eat-in kitchen w/walkout. Paneled dormer rooms, patio & rock garden. Meticulously cared for over the years and it shows-a must see!
-
2005-04-30$94,900 227-char remark
Show marketing remark (227 chars)
Pride of ownership shows in this cozy cape on cul-de-sac. Loaded w/unique character. Xlarge eat-in kitchen w/walkout. Paneled dormer rooms, patio & rock garden. Meticulously cared for over the years and it shows-a must see!
ⓘ Source: listings_history table (triggers on properties + properties_extension) + one-shot
backfill from property_details.listing_events for pre-trigger history.
Tax reassessment forecast OH · Partial reset (capped growth)
- Current annual tax
- $2,003 · $167/mo
- Projected year-2 tax
- $2,016 · $168/mo
- Expected delta
- +$12/yr (+$1/mo · 0.6%)
ⓘ Screening estimate from a state-policy table — verify with the county assessor before closing.
Climate risk First Street
- Flood 1/10 Low FEMA zone X (unshaded) · 0% chance over 30 yrs
- Wildfire 1/10 Low
- Heat 4/10 Moderate 7 d/yr ≥103°F today · 19 d/yr by 30 yrs out
- Wind 2/10 Low 100% chance of damaging wind over 30 yrs
- Air quality 3/10 Moderate 3 unhealthy d/yr today · 5 by 30 yrs out
Nearby sold comps map
Loading sold comps map…
Walkable amenities ~0.75 mi
Loading nearby amenities…
Taxation est. · year 1
- Rental income
- $19,236
- − Mortgage interest
- −$7,282
- − Property taxes
- −$2,003
- − Insurance
- −$650
- − Repairs & maintenance
- −$1,539
- − Management
- −$1,539
- − Depreciation
- −$3,782
- Taxable income
- $2,441
- Est. tax owed @ 24.0%
- −$586
- After-tax cash flow
- $3,776/yr
For passive investors: Depreciation is non-cash, so a rental often shows a tax loss while cash-flowing — sheltering income. Rental losses are passive: they offset passive income freely, and up to $25,000/yr can offset ordinary (W-2) income if you actively participate and your MAGI is under $100k (phasing out to $0 by $150k); unused losses carry forward. On sale, claimed depreciation is recaptured at up to 25%, and gains may owe capital-gains tax (a 1031 exchange can defer both). Figures are a year-1 estimate at your 24.0% rate — not tax advice; consult a CPA.
Schools (NCES district)
- District
- Cincinnati Public Schools
- NCES district ID
- 3904375
- Math proficiency
- 25% ▼ -19.00%
- Reading proficiency
- 36% ▼ -14.00%
- Median HH income
- $35,743
- Composite
- 25.21/100
- National rank
- #7508
- State rank
- #581 of 656 in OH
Livability — Cincinnati
- Score
- 80/100
- State rank
- #130
- US rank
- #1856
Category grades
Schools grade is shown separately in the Schools card above.
Census & demographics
- Census place
- Cincinnati, OH
- County
- Hamilton County · 701,295 people
- City population
- 505,555
- Metro
- Cincinnati, OH-KY-IN
- Population (ZIP)
- 48,351
- Household income
- $66,277
- Rent vs Own
- Severe rent burden
- 2012.0
Population outlook (Hamilton County) Hauer SSP2
- Today (2025)
- 826,054 people
- By 2030
- 830,947 · +0.6%
- By 2040
- 832,319 · +0.8%
- By 2050
- 822,428 · -0.4%
- By 2075
- 788,688 · -4.5%
- By 2100
- 710,674 · -14.0%
Race, ethnicity, and origin ACS 2023
- Neighborhood character
- Majority White (64%)
- Race & ethnicity
- White 64% Black 28% Two or more races 6% Hispanic / Latino 3%
- Common ancestry
- Italian 2% Lithuanian 2% Slovak 1%
- Foreign-born
- 10% · Canada
- Languages at home
- 88% English-only · French/Haitian/Cajun 4% Spanish 2% German/W. Germanic 1%
Political lean MEDSL · Hamilton
- 2024 margin
- D (+14.9) · D 57.0% · R 42.1%
- 2008→2024 swing
- +7.9pp toward D · 2008: 7.0pp · 2024: 14.9pp
- All cycles
- 2024: D+14.9 2020: D+15.9 2016: D+9.5 2012: D+4.9 2008: D+7.0
Not yet ingested
- Civics
- —
Market trends
- HPI YoY
- ▼ -197.57%
- Current HPI
- 213.5097
- Rent YoY
- ▲ 4.87%
- Metro
- Cincinnati, OH-KY-IN
- State GDP YoY
- ▲ 1.98%
- F500 in state
- 48
Industry mix (Fortune 500 HQ in OH)
| Industry | F500 HQs | Revenue |
|---|---|---|
| Insurance | 3 | $145B |
|
||
| Industrial Machinery | 3 | $49B |
|
||
| Financial Services | 3 | $24B |
|
||
| Consumer Goods | 2 | $93B |
|
||
| Aerospace / Defense | 2 | $47B |
|
||
| Utilities | 2 | $33B |
|
||
Price history
+37.0% since first listed4 events — show timeline
- 2026-03-30 Price Changed $130,000 Cincy MLS
- 2026-01-09 Listed $140,000 Cincy MLS
- 2005-08-02 Sold (MLS) $88,000 Cincy MLS
- 2005-04-30 Listed $94,900 Cincy MLS
Property tax history
+2.5%/yrLatest (2025): $2,003 · +3.1% YoY. Source: county tax records.
Cash-flow waterfall
monthlySold comps — $/sqft
last 12 mo · ≤1 miLoading sold comps…