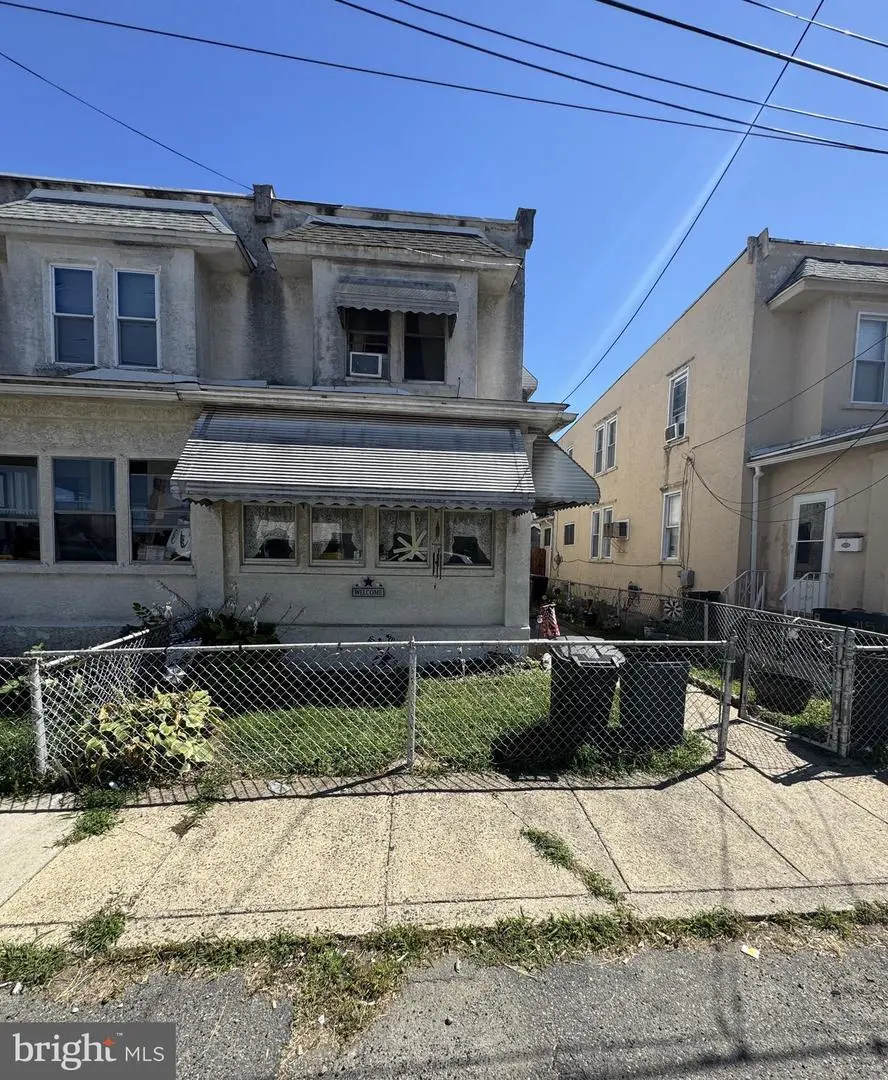
217 Harvey Ave · Linwood, PA
Flood risk 1/10 · Minimal
- FEMA flood zone
- X (unshaded)
- Chance of flooding over 30 yrs
- 0.0%
- Est. flood insurance / yr
- $473 – $860
Fire risk 1/10 · Minimal
- Est. fire insurance / yr
- $511 – $949
Heat risk 7/10 · Major
- Hot days now (above 104°F)
- 7 days/yr
- Hot days in 30 yrs
- 15 days/yr
Wind risk 6/10 · Moderate
- Chance of severe wind over 30 yrs
- 27.0%
Air-quality risk 4/10 · Minor
- Unhealthy air days now
- 4 days/yr
- Unhealthy air days in 30 yrs
- 7 days/yr
Risk factors via First Street. Map © Google.
Why this score? — see what drove the C+ grade
The composite is a weighted blend of 9 inputs, each scored 0–100. Each bar is that input's sub-score; the figure is the points it added to the 100-point composite (weight × sub-score).
- Cash flow +25.6/30.0
- ARV discount +10.7/15.0
- DSCR +8.5/10.0
- 1% rule +5.6/10.0
- Livability +4.0/5.0
- Rent growth +3.0/5.0
- Schools +2.7/10.0
- Condition / age +2.5/5.0
- Appreciation +0.0/10.0
$160,000
🖨 Deal sheet 📄 Offer letter ✓ Due diligence
Listing remarks MLS
NO INTERIOR ACCESS. Do not approach the occupants. DRIVE BY ONLY. Sold at Auction and with occupant in place now and at settlement. Fantastic opportunity to acquire this neat twin with an enclosed front porch. The property is close to 95 and offers excellent rental potential or a nice home for the owner occupant. Easy Access to Center City and major Routes. Quiet street. No direct knowledge of interior condition or floorplan. Perfect for the savvy investor or owner occupant. All offers from interested buyers must be entered online at the auction website. Please consult the auction website for bidding instructions and terms of sale. All information regarding room count, measurements, and property information has been obtained thru third party sources. All information is reliable but you are advised to perform your own due diligence for your buyer.
Key facts
- Quiet street
- Enclosed front porch
- Built 1910
Tags
Neighborhood map
What this means for you Summary
Snapshot
- This is a 3-bed/1.0-bath single-family listed at $160k.
Deal economics
- At list price, monthly cash flow is $377 ($5k/yr) — positive.
- The deal already cash-flows at list — no discount required.
- Meets the 1% rule at list price ($2k rent vs $160k).
- Recommended offer: $141k (12.0% below list) — sets the bar for market timing.
Location & tenants
- Location reads 79/100 on livability (#234 in PA, #2,020 nationally) — a middle-class / working-renter tenant base. Strengths: cost of living A+, housing A+, crime A; Watch: commute D+, amenities F.
- Chichester SD (suburban): math 19% / reading 41% proficiency, ranked #438 of 539 in PA (top 81%) — families likely to look elsewhere, expect single-tenant / working-renter base with shorter leases.
- Market conditions: Rents rising (+1.8%/yr); 68 active listings in the ZIP; 17 comparable units currently listed for rent nearby; rentals at typical pace (median 21d on market — plan ~3-4 weeks tenant-placement turnaround); solid renter incomes; 299 units permitted in Delaware County in 2024 (5 in 5+ unit buildings).
Forward outlook
- Local home prices are declining (-3.0%/yr); year-one equity from $1k of loan paydown is wiped out by about $5k of value loss. Plan a longer hold.
Negotiation context
- It's been on market 161 days — a 12% lower offer ($141k) is reasonable based on typical stale-listing flexibility.
- 2 sale attempts; this cycle's ask has dropped $15k (9%) from the opening price — seller is motivated, your offer sets the floor, not the list.
- Current owner paid $42k; list at $160k implies a 281% gain — meaningful room to come down on a strong offer.
Risks & watch-outs
- Watch-outs: built in 1910 — expect roof / HVAC / electrical / plumbing capex.
- Climate carrying-cost: major wind risk, 27% chance of damaging wind over 30y; extreme-heat days projected 7→15/yr by 2055 (HVAC capex compounding) — expect insurance premiums to compound above CPI over the hold.
Questions for the listing agent
- It's been on market 161 days. Have you received any prior offers? Is the seller open to a 12% concession, seller financing, or rate buy-down credit?
- Built in 1910 — when were the roof, HVAC, electrical panel, plumbing, and water heater last replaced?
- Why hasn't it sold? Are there any deal-killer items the seller is aware of (foundation, flood, title, zoning, code violations)?
- Is there a deadline driving the sale (1031 exchange, divorce, estate, relocation)? That informs how much negotiation room exists.
- What's the average days-on-market for RENTAL listings here right now (not sales)? A rising rental-DOM trend means longer vacancies and softer asking-rent achievability than the comps imply.
- What's the recent tenant-quality profile in this submarket — average credit score on applications, eviction rate, late-payment / NSF rate, and stable-employment percentage? A property-management company in the area should have these aggregated.
- How much new for-sale + rental construction is in the pipeline within 1–3 miles? Heavy new supply typically softens prices + rents 12–24 months out; constrained supply supports both.
Investment metrics
- 1% rule
- 1.06% ✓
- Cap rate
- 9.12%
- Cash-on-cash
- 10.09%
- DSCR
- 1.45
- GRM
- 7.8
CMA / ARV
- ARV (median comp)
- $172,189
- List price
- $160,000
- Delta
- -7.08%
- Verdict
- FAIR
- Comps
- 20 within 1.0 mi
Show comp detail 12 sales within ~0.75 mi
| Address | Dist | Beds/Ba | Sqft | Sold | Price | $/sf | Match |
|---|---|---|---|---|---|---|---|
| 9 Maise Ave | 0.46mi | 3/1.0 | 1,092 (-0%) | 2mo | $290,000 | $266 | 76 |
| 131 Harvey | 0.10mi | 3/2.0 | 1,147 (+5%) | 12mo | $257,400 | $224 | 73 |
| 4300 W 9th St #34 | 0.34mi | 3/1.0 | 1,125 (+3%) | 13mo | $54,400 | $48 | 69 |
| 2117 Locust St | 0.67mi | 3/2.0 | 1,050 (-4%) | 4mo | $305,000 | $290 | 54 |
| 1327 Chestnut St | 0.72mi | 3/1.0 | 1,092 (-0%) | 15mo | $219,900 | $201 | 53 |
| 914 Anderson Ave | 0.72mi | 3/2.0 | 1,042 (-5%) | 2mo | $289,900 | $278 | 52 |
| 1565 Beale St #101 | 0.44mi | 2/1.0 (-1) | 1,008 (-8%) | 11mo | $210,000 | $208 | 52 |
| 4210 W 7th St | 0.58mi | 3/1.5 | 1,200 (+10%) | 9mo | $186,500 | $155 | 48 |
| 2109 Ferncroft Ave | 0.62mi | 2/1.0 (-1) | 960 (-12%) | 4mo | $240,000 | $250 | 42 |
| 900 Market St Apt E | 0.62mi | 3/1.0 | 1,219 (+11%) | 13mo | $104,000 | $85 | 42 |
| 2210 Wharton Ave | 0.67mi | 3/1.0 | 1,000 (-9%) | 17mo | $292,000 | $292 | 40 |
| 4022 W 7th St | 0.67mi | 4/1.0 (+1) | 1,248 (+14%) | 3mo | $165,000 | $132 | 38 |
Match score weights: distance 35% · size 25% · config 20% · recency 20%. Top-matched comps best support the ARV.
Projected returns pro-forma
-3.0% appreciation · 1.83% rent growth · sell at horizon
- IRR
- -2.4%
- Equity multiple
- 0.91×
- Total profit
- $-3,971
- Equity at exit
- $23,857
- IRR
- 6.1%
- Equity multiple
- 1.43×
- Total profit
- $19,258
- Equity at exit
- $13,834
Cash invested: $44,800 (down + closing). Projections, not guarantees.
Landlord ↔ Tenant lean methodology
- Overall (STATE)
- 62 Landlord-Friendly
- State Pennsylvania
- 62 Landlord-Friendly · EVEN
- County
- — inherits STATE
- City
- — inherits STATE
ZIP-level market 19061
- Rents YoY
- 1.8%
- Active inventory
- 68
- Price-to-rent
- 7.8×
Monthly cashflow live
- Estimated rent
- $1,704 high interval (Pro) →
- Mortgage (P&I)
- −$839
- Tax from tax record
- −$63 /mo · $761/yr
- Insurance
- −$67
- HOA
- −$0
- Vacancy / Maint / Mgmt
- −$358
- Net cashflow
- $377
Break-even live
UW: 25.0% down · 7.5% · 30yr · 1.5% tax · 5.0% vac · 8.0% maint · 8.0% mgmt
Financing live
Cash to close
- Down payment
- $40,000
- Closing costs
- $4,800
- Reserves months
- —
- Total cash needed
- —
Loan-product check · same deal, 3 products live
Conventional
25% down · 7.5% · 30yr
- Down + closing
- —
- Monthly P&I
- —
- Monthly cashflow
- —
- DSCR
- —
- Eligible?
- —
Personal DTI + credit; lowest rate.
DSCR
20% down · 8.5% · 30yr
- Down + closing
- —
- Monthly P&I
- —
- Monthly cashflow
- —
- DSCR
- —
- Eligible?
- —
No personal income docs; deal must DSCR.
Hard money
10% down · 12.0% · 12mo
- Down + closing
- —
- Monthly P&I
- —
- Monthly cashflow
- —
- DSCR
- —
- Eligible?
- —
Short-term bridge; refi at stabilization.
Rent comps 17 comps
| Address | Beds | Baths | Sqft | Rent | $/sqft | DOM | Units | Dist |
|---|---|---|---|---|---|---|---|---|
| 151 Chadwick Ave Marcus Hook, PA | 3.0 | 1.5 | 1080 | $1,600 | $1.48 | 10d | 1 | 0.09mi |
| 130 Harvey Ave Unit 1 Linwood, PA | 3.0 | 1.0 | 1173 | $1,750 | $1.49 | 10d | 1 | 0.14mi |
| 117 Ervin Ave Marcus Hook, PA | 3.0 | 1.5 | 720 | $1,595 | $2.22 | 20d | 1 | 0.16mi |
| 119 E Laughead Ave Marcus Hook, PA | 3.0 | 1.5 | 1080 | $1,530 | $1.42 | 3d | 1 | 0.21mi |
| 1015 McClenahan Ter Marcus Hook, PA | 3.0 | 2.5 | 1456 | $2,400 | $1.65 | 10d | 1 | 0.47mi |
| 15 Marshall Ave Marcus Hook, PA | 3.0 | 1.0 | 1204 | $1,600 | $1.33 | 24d | 1 | 0.63mi |
| 8 W 8th St Marcus Hook, PA | 3.0 | 1.0 | 1120 | $1,600 | $1.43 | 18d | 1 | 0.71mi |
| 7 W 6th St Marcus Hook, PA | 3.0 | 1.0 | 1287 | $1,815 | $1.41 | 15d | 1 | 0.84mi |
| 1006 Keystone Rd Chester, PA | 2.0 | 1.0 | 750 | $1,200 | $1.60 | 24d | 1 | 1.00mi |
| 1107-1115 Keystone Rd Chester, PA | 2.0 | 1.0 | 700 | $1,250 | $1.79 | 43d | 1 | 1.02mi |
| 908 Keystone Rd Chester, PA | 2.0 | 1.0 | 750 | $1,200 | $1.60 | 43d | 1 | 1.04mi |
| 906 Keystone Rd Unit 1 Chester, PA | 2.0 | 1.0 | 800 | $1,200 | $1.50 | 24d | 1 | 1.04mi |
| 906 Keystone Rd Chester, PA | 2.0 | 1.0 | 800 | $1,200 | $1.50 | 21d | 1 | 1.04mi |
| 3312 W 13th St Chester, PA | 2.0 | 1.0 | 936 | $1,499 | $1.60 | 21d | 1 | 1.04mi |
| 2820 Chichester Ave Boothwyn, PA | 2.0 | 1.0 | 850 | $1,347 | $1.58 | 21d | 1 | 1.30mi |
| 2832 W 6th St Unit 306 Chester, PA | 3.0 | 1.0 | 1428 | $1,500 | $1.05 | 4d | 1 | 1.32mi |
| 425 Highland Ave Apt A Chester, PA | 2.0 | 1.5 | 990 | $1,000 | $1.01 | 20d | 1 | 1.43mi |
Listing history 18 events
-
2026-06-18days on market $160,000 Active 161 DOM
-
2026-06-17days on market $160,000 Active 160 DOM
-
2026-06-16days on market $160,000 Active 159 DOM
-
2026-06-15days on market $160,000 Active 158 DOM
-
2026-06-13days on market $160,000 Active 156 DOM
-
2026-06-13days on market $160,000 Active 155 DOM
-
2026-06-09days on market $160,000 Active 152 DOM
-
2026-06-08days on market $160,000 Active 151 DOM
-
2026-06-07days on market $160,000 Active 150 DOM
-
2026-06-04days on market $160,000 Active 147 DOM
-
2026-06-03days on market $160,000 Active 146 DOM
-
2026-06-02days on market $160,000 Active 145 DOM
-
2026-06-01days on market $160,000 Active 144 DOM
-
2026-05-31days on market $160,000 Active 143 DOM
-
2026-04-03status Active 858-char remark
Show marketing remark (858 chars)
NO INTERIOR ACCESS. Do not approach the occupants. DRIVE BY ONLY. Sold at Auction and with occupant in place now and at settlement. Fantastic opportunity to acquire this neat twin with an enclosed front porch. The property is close to 95 and offers excellent rental potential or a nice home for the owner occupant. Easy Access to Center City and major Routes. Quiet street. No direct knowledge of interior condition or floorplan. Perfect for the savvy investor or owner occupant. All offers from interested buyers must be entered online at the auction website. Please consult the auction website for bidding instructions and terms of sale. All information regarding room count, measurements, and property information has been obtained thru third party sources. All information is reliable but you are advised to perform your own due diligence for your buyer.
-
2026-03-31historical 858-char remark
Show marketing remark (858 chars)
NO INTERIOR ACCESS. Do not approach the occupants. DRIVE BY ONLY. Sold at Auction and with occupant in place now and at settlement. Fantastic opportunity to acquire this neat twin with an enclosed front porch. The property is close to 95 and offers excellent rental potential or a nice home for the owner occupant. Easy Access to Center City and major Routes. Quiet street. No direct knowledge of interior condition or floorplan. Perfect for the savvy investor or owner occupant. All offers from interested buyers must be entered online at the auction website. Please consult the auction website for bidding instructions and terms of sale. All information regarding room count, measurements, and property information has been obtained thru third party sources. All information is reliable but you are advised to perform your own due diligence for your buyer.
-
2026-01-05$175,000 Active 858-char remark
Show marketing remark (858 chars)
NO INTERIOR ACCESS. Do not approach the occupants. DRIVE BY ONLY. Sold at Auction and with occupant in place now and at settlement. Fantastic opportunity to acquire this neat twin with an enclosed front porch. The property is close to 95 and offers excellent rental potential or a nice home for the owner occupant. Easy Access to Center City and major Routes. Quiet street. No direct knowledge of interior condition or floorplan. Perfect for the savvy investor or owner occupant. All offers from interested buyers must be entered online at the auction website. Please consult the auction website for bidding instructions and terms of sale. All information regarding room count, measurements, and property information has been obtained thru third party sources. All information is reliable but you are advised to perform your own due diligence for your buyer.
-
1985-04-29soldstatus $42,000
ⓘ Source: listings_history table (triggers on properties + properties_extension) + one-shot
backfill from property_details.listing_events for pre-trigger history.
Tax reassessment forecast PA · Partial reset (capped growth)
- Current annual tax
- $761 · $63/mo
- Projected year-2 tax
- $1,644 · $137/mo
- Expected delta
- +$884/yr (+$74/mo · 116.2%)
ⓘ Screening estimate from a state-policy table — verify with the county assessor before closing.
Climate risk First Street
- Flood 1/10 Low FEMA zone X (unshaded) · 0% chance over 30 yrs
- Wildfire 1/10 Low
- Heat 7/10 Severe 7 d/yr ≥104°F today · 15 d/yr by 30 yrs out
- Wind 6/10 Major 27% chance of damaging wind over 30 yrs
- Air quality 4/10 Moderate 4 unhealthy d/yr today · 7 by 30 yrs out
Nearby sold comps map
Loading sold comps map…
Walkable amenities ~0.75 mi
Loading nearby amenities…
Taxation est. · year 1
- Rental income
- $20,444
- − Mortgage interest
- −$8,962
- − Property taxes
- −$761
- − Insurance
- −$800
- − Repairs & maintenance
- −$1,635
- − Management
- −$1,635
- − Depreciation
- −$4,655
- Taxable income
- $1,995
- Est. tax owed @ 24.0%
- −$479
- After-tax cash flow
- $4,042/yr
For passive investors: Depreciation is non-cash, so a rental often shows a tax loss while cash-flowing — sheltering income. Rental losses are passive: they offset passive income freely, and up to $25,000/yr can offset ordinary (W-2) income if you actively participate and your MAGI is under $100k (phasing out to $0 by $150k); unused losses carry forward. On sale, claimed depreciation is recaptured at up to 25%, and gains may owe capital-gains tax (a 1031 exchange can defer both). Figures are a year-1 estimate at your 24.0% rate — not tax advice; consult a CPA.
Schools (NCES district)
- District
- Chichester SD
- NCES district ID
- 4205910
- Math proficiency
- 19% ▼ -12.00%
- Reading proficiency
- 41% ▼ -17.00%
- Median HH income
- $57,612
- Composite
- 26.84/100
- National rank
- #7110
- State rank
- #438 of 539 in PA
Livability — Linwood
- Score
- 79/100
- State rank
- #234
- US rank
- #2020
Category grades
Schools grade is shown separately in the Schools card above.
Census & demographics
- Census place
- Linwood, PA
- County
- Delaware County · 399,863 people
- City population
- 20,135
- Metro
- Philadelphia-Camden-Wilmington, PA-NJ-DE-MD
- Population (ZIP)
- 19,896
- Household income
- $82,005
- Rent vs Own
- Severe rent burden
- 612.0
Population outlook (Delaware County) Hauer SSP2
- Today (2025)
- 577,490 people
- By 2030
- 581,243 · +0.6%
- By 2040
- 584,700 · +1.2%
- By 2050
- 586,581 · +1.6%
- By 2075
- 598,706 · +3.7%
- By 2100
- 590,823 · +2.3%
Race, ethnicity, and origin ACS 2023
- Neighborhood character
- Predominantly White (74%)
- Race & ethnicity
- White 74% Black 11% Hispanic / Latino 5% Two or more races 5% Asian 4%
- Hispanic origin (detail)
- Mexican 1% Puerto Rican 2%
- Common ancestry
- Romanian 5% Subsaharan African 3% Polish 2%
- Foreign-born
- 8% · Canada, China, South Korea
- Languages at home
- 90% English-only · Spanish 3% Chinese 3% Other Indo-European 1%
Political lean MEDSL · Delaware
- 2024 margin
- Strong D (+23.7) · D 61.4% · R 37.6% · Other 1.0%
- 2008→2024 swing
- +2.3pp toward D · 2008: 21.4pp · 2024: 23.7pp
- All cycles
- 2024: D+23.7 2020: D+26.7 2016: D+22.0 2012: D+21.8 2008: D+21.4
Not yet ingested
- Civics
- —
Market trends
- HPI YoY
- ▼ -187.71%
- Current HPI
- 265.507
- Rent YoY
- ▲ 1.83%
- Metro
- Philadelphia-Camden-Wilmington, PA-NJ-DE-MD
- State GDP YoY
- ▲ 1.68%
- F500 in state
- 34
Industry mix (Fortune 500 HQ in PA)
| Industry | F500 HQs | Revenue |
|---|---|---|
| Healthcare | 2 | $309B |
|
||
| Insurance | 2 | $27B |
|
||
| Telecommunications / Media | 1 | $124B |
|
||
| Industrial Distribution | 1 | $22B |
|
||
| Financial Services | 1 | $20B |
|
||
| Chemicals / Materials | 1 | $18B |
|
||
Price history
+316.7% since first listed4 events — show timeline
- 2026-04-03 Relisted — BRIGHT MLS
- 2026-03-31 Listing Removed — BRIGHT MLS
- 2026-01-05 Listed $175,000 BRIGHT MLS
- 1985-04-29 Sold (Public Records) $42,000 Public Records
Property tax history
-7.4%/yrLatest (2026): $761 · -67.7% YoY. Source: county tax records.
Cash-flow waterfall
monthlySold comps — $/sqft
last 12 mo · ≤1 miLoading sold comps…