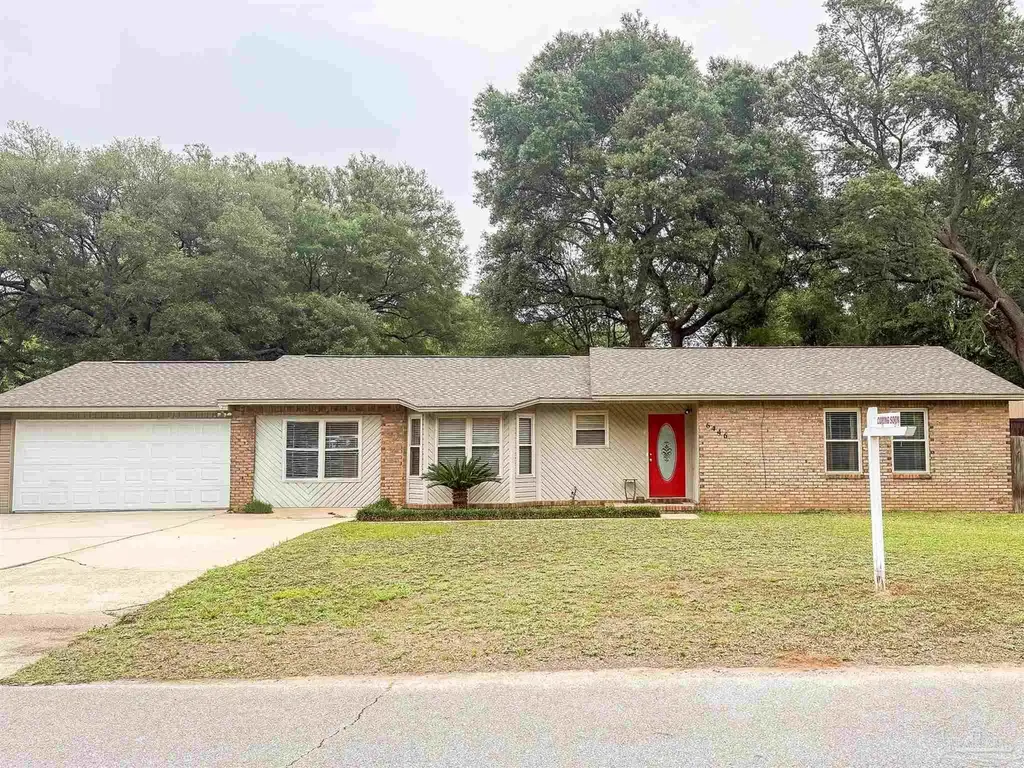
6446 Kennington Cir · Point Baker, FL
Flood risk 1/10 · Minimal
- FEMA flood zone
- X (unshaded)
- Chance of flooding over 30 yrs
- 0.0%
- Est. flood insurance / yr
- $507 – $1,088
Fire risk 5/10 · Moderate
- Est. fire insurance / yr
- $947 – $1,759
Heat risk 9/10 · Severe
- Hot days now (above 106°F)
- 7 days/yr
- Hot days in 30 yrs
- 20 days/yr
Wind risk 9/10 · Severe
- Chance of severe wind over 30 yrs
- 99.0%
Air-quality risk 2/10 · Minimal
- Unhealthy air days now
- 1 days/yr
- Unhealthy air days in 30 yrs
- 1 days/yr
Risk factors via First Street. Map © Google.
Why this score? — see what drove the D grade
The composite is a weighted blend of 9 inputs, each scored 0–100. Each bar is that input's sub-score; the figure is the points it added to the 100-point composite (weight × sub-score).
- Cash flow +13.8/30.0
- ARV discount +7.5/15.0
- Schools +5.3/10.0
- DSCR +4.2/10.0
- Rent growth +3.2/5.0
- Livability +3.2/5.0
- 1% rule +2.9/10.0
- Condition / age +2.5/5.0
- Appreciation +0.0/10.0
$245,000
🖨 Deal sheet (PDF) 📄 Offer letter ✓ Due diligence
Listing remarks MLS
Spacious 3 bedroom/ 2 bath home with 2 living rooms that could be a play room for a young family. This home is in a quiet neighborhood that is only 10 minutes from Whiting Field NAS and 15 minutes from I 10. The spacious backyard has a large 14X14 shed and a 16X12 deck for grilling.
Key facts
- Open deck
- Vaulted living room
- Granite countertops
Tags
Property features AI
Finance
- HOA & community: No association
Exterior
- Parking: Two covered parking spaces; 2-car carport with front entrance access
- Utilities: Public water; Septic tank sewer; Cable available; Circuit breakers and copper wiring
- Home design: Attached dwelling; One story
- Construction: Frame construction; Slab foundation; Composition roof
- Exterior features: Privacy fenced backyard; Deck; Yard building and workshop on the property; Paved, county-maintained road access; Insulated walls; Has fireplace (exterior feature noted)
Interior
- Kitchen: Updated kitchen; Granite countertops; Dishwasher; Refrigerator
- Bedrooms: Primary bedroom on the first floor; Additional bedrooms on the first floor
- Flooring: Tile; Carpet
- Bathrooms: Two full bathrooms; Updated bathrooms with granite countertops and updated cabinets
- Heating & cooling: Central heating; Fireplace(s); Central air conditioning; Ceiling fans for cooling
- Interior features: Baseboards; Ceiling fans; Vaulted ceilings; High-speed internet available; Insulated doors; Double-pane windows
- Laundry & utility: Indoor laundry; Electric water heater
Neighborhood map
What this means for you Summary
Snapshot
- This is a 3-bed/2.0-bath townhouse listed at $245k.
Deal economics
- At list price, monthly cash flow is $22 ($267/yr) — positive.
- The deal already cash-flows at list — no discount required.
- To meet the 1% rule (rent ≥ 1% of price), the offer needs to be $195k (20.6% below list).
- Recommended offer: $195k (20.6% below list) — sets the bar for 1% rule.
- Cap rate 6.4% vs local median 4.2% in Point Baker — top-decile yield for the area; either an underpriced asset or a hidden risk that comps aren't pricing in. Stress-test before assuming the spread holds.
Location & tenants
- Location reads 63/100 on livability (#735 in FL) — a middle-class / working-renter tenant base. Strengths: crime A+, cost of living A+, housing A+; Watch: amenities F, commute F, health & safety F.
- Santa Rosa (suburban): math 63% / reading 60% proficiency, ranked #8 of 73 in FL (top 11%) — acceptable for families but not a draw, mixed tenant base, ~2y average lease.
- Zoned schools: W. H. Rhodes Elementary School (math 55% / reading 47%, grade C-, #1,043 of 2,144 statewide, top 49%, 812 students, 79% FRL); Martin Luther King Middle School (math 38% / reading 41%, grade F, #373 of 571 statewide, top 66%, 660 students, 69% FRL); Milton High School (math 44% / reading 42%, grade F, #255 of 667 statewide, top 39%, 2,085 students, 54% FRL) — zoned schools average 67% FRL vs 36% district-wide (31 pts higher); higher-poverty schools than district average — tighter screening recommended.
- Zoned-school proficiency averages 44% at this address vs 62% district-wide (-17 pts) — the specific schools serving this property underperform the Santa Rosa average; the district grade overstates school quality for this exact location.
- Market conditions: Rents rising (+2.7%/yr); 360 active listings in the ZIP; 4 comparable units currently listed for rent nearby; rentals at typical pace (median 26d on market — plan ~3-4 weeks tenant-placement turnaround); solid renter incomes; 1,983 units permitted in Santa Rosa County in 2024 (128 in 5+ unit buildings).
- This rent runs 30% of the median local income ($77k/yr) — at the standard rent-burdened threshold; future hikes will face affordability resistance.
Forward outlook
- Local home prices are declining (-3.0%/yr); year-one equity from $2k of loan paydown is wiped out by about $7k of value loss. Plan a longer hold.
- Santa Rosa County population projected at +31% by 2050 — long-run rental-demand tailwind backs the buy-and-hold thesis.
Negotiation context
- It's been on market 31 days — a 3% lower offer ($238k) is reasonable based on typical stale-listing flexibility.
- 5 sale attempts since 10y ago with the ask held roughly flat each time — persistent listings suggest the price (not the market) is what's stuck; bring a comps-based counter.
- Current owner paid $149k; list at $245k implies a 64% gain — meaningful room to come down on a strong offer.
Risks & watch-outs
- Climate carrying-cost: severe wind risk, 99% chance of damaging wind over 30y; moderate wildfire risk; extreme-heat days projected 7→20/yr by 2055 (HVAC capex compounding) — expect insurance premiums to compound above CPI over the hold.
Questions for the listing agent
- It's been on market 31 days. Have you received any prior offers? Is the seller open to a 21% concession, seller financing, or rate buy-down credit?
- Is there a deadline driving the sale (1031 exchange, divorce, estate, relocation)? That informs how much negotiation room exists.
- Schools are F-rated, which usually means shorter tenancies and higher turnover. Who's the typical renter profile here, and what's been the actual vacancy rate?
- The area grade is low — what's the realistic commute time and amenity access for the typical tenant pool here? Any planned neighborhood developments (good or bad) we should know about?
- What's the average days-on-market for RENTAL listings here right now (not sales)? A rising rental-DOM trend means longer vacancies and softer asking-rent achievability than the comps imply.
- What's the recent tenant-quality profile in this submarket — average credit score on applications, eviction rate, late-payment / NSF rate, and stable-employment percentage? A property-management company in the area should have these aggregated.
- How much new for-sale + rental construction is in the pipeline within 1–3 miles? Heavy new supply typically softens prices + rents 12–24 months out; constrained supply supports both.
Investment metrics
- 1% rule
- 0.79% ✗
- Cap rate
- 6.40%
- Cash-on-cash
- 0.39%
- DSCR
- 1.02
- GRM
- 10.5
CMA / ARV
No comps found within radius.
Projected returns pro-forma
-3.0% appreciation · 2.7% rent growth · sell at horizon
- IRR
- -16.0%
- Equity multiple
- 0.43×
- Total profit
- $-38,951
- Equity at exit
- $36,530
- IRR
- -8.2%
- Equity multiple
- 0.49×
- Total profit
- $-34,810
- Equity at exit
- $21,183
Cash invested: $68,600 (down + closing). Projections, not guarantees.
Landlord ↔ Tenant lean methodology
- Overall (STATE)
- 87 Strongly Landlord-Friendly
- State Florida
- 87 Strongly Landlord-Friendly · R+3
- County
- — inherits STATE
- City
- — inherits STATE
ZIP-level market 32570
- Home prices YoY
- -15.1%
- Rents YoY
- 2.7%
- Active inventory
- 360
- Price-to-rent
- 10.5×
Monthly cashflow live
- Estimated rent
- $1,946 medium interval (Pro) →
- Mortgage (P&I)
- −$1,285
- Tax from tax record
- −$129 /mo · $1,543/yr
- Insurance
- −$102
- HOA
- −$0
- Vacancy / Maint / Mgmt
- −$409
- Net cashflow
- $22
Break-even live
Sensitivity live
| Price | -10% $161 | -5% $92 | +0% $22 | +5% $-47 | +10% $-116 |
|---|---|---|---|---|---|
| Rent | -10% $-132 | -5% $-55 | +0% $22 | +5% $99 | +10% $176 |
| Rate | -1.0pp $146 | -0.5pp $85 | base $22 | +0.5pp $-41 | +1.0pp $-106 |
UW: 25.0% down · 7.5% · 30yr · 1.5% tax · 5.0% vac · 8.0% maint · 8.0% mgmt
Financing live
Cash to close
- Down payment
- $61,250
- Closing costs
- $7,350
- Reserves months
- —
- Total cash needed
- —
Loan-product check · same deal, 3 products live
Conventional
25% down · 7.5% · 30yr
- Down + closing
- —
- Monthly P&I
- —
- Monthly cashflow
- —
- DSCR
- —
- Eligible?
- —
Personal DTI + credit; lowest rate.
DSCR
20% down · 8.5% · 30yr
- Down + closing
- —
- Monthly P&I
- —
- Monthly cashflow
- —
- DSCR
- —
- Eligible?
- —
No personal income docs; deal must DSCR.
Hard money
10% down · 12.0% · 12mo
- Down + closing
- —
- Monthly P&I
- —
- Monthly cashflow
- —
- DSCR
- —
- Eligible?
- —
Short-term bridge; refi at stabilization.
Rent comps 4 comps
| Address | Beds | Baths | Sqft | Rent | $/sqft | DOM | Units | Dist |
|---|---|---|---|---|---|---|---|---|
| 6707 Cedar Ridge Cir Milton, FL | 3.0 | 2.5 | 1669 | $1,900 | $1.14 | 16d | 1 | 1.05mi |
| 6716 Barnwood Dr Milton, FL | 3.0 | 2.0 | 1753 | $1,850 | $1.06 | 25d | 1 | 1.33mi |
| 6747 Weathered Dr Milton, FL | 3.0 | 2.0 | 1546 | $1,800 | $1.16 | 25d | 1 | 1.33mi |
| 5733 Orange St Milton, FL | 3.0 | 1.5 | 1640 | $1,500 | $0.91 | 25d | 1 | 1.46mi |
Listing history 24 events
-
2026-06-14statusdays on market $245,000 Pending 31 DOM
-
2026-06-10days on market $245,000 Contingent 30 DOM
-
2026-06-09days on market $245,000 Contingent 29 DOM
-
2026-06-08days on market $245,000 Contingent 28 DOM
-
2026-06-07days on market $245,000 Contingent 27 DOM
-
2026-06-05days on market $245,000 Contingent 24 DOM
-
2026-06-03days on market $245,000 Contingent 23 DOM
-
2026-06-02days on market $245,000 Contingent 22 DOM
-
2026-06-01days on market $245,000 Contingent 21 DOM
-
2026-05-31days on market $245,000 Contingent 20 DOM
-
2026-05-31days on market $245,000 Contingent 19 DOM
-
2026-05-15historical Contingent
-
2026-05-11$245,000 Active
-
2020-04-28soldstatus $149,000
-
2020-04-24soldstatus $149,000 284-char remark
Show marketing remark (284 chars)
Spacious 3 bedroom/ 2 bath home with 2 living rooms that could be a play room for a young family. This home is in a quiet neighborhood that is only 10 minutes from Whiting Field NAS and 15 minutes from I 10. The spacious backyard has a large 14X14 shed and a 16X12 deck for grilling.
-
2020-01-23$155,000 284-char remark
Show marketing remark (284 chars)
Spacious 3 bedroom/ 2 bath home with 2 living rooms that could be a play room for a young family. This home is in a quiet neighborhood that is only 10 minutes from Whiting Field NAS and 15 minutes from I 10. The spacious backyard has a large 14X14 shed and a 16X12 deck for grilling.
-
2018-02-16soldstatus $125,000 481-char remark
Show marketing remark (481 chars)
Charming 3 bed/2 bath home with all of the updates you could imagine. New tile flooring, updated kitchen cabinets and countertops, newer appliances & new windows to name a few! This home is ideal for a young family as it is situated in a quiet neighborhood and the big backyard offers plenty of space for outdoor activities. Also, there is a large shed on the property that accents the house perfectly and provides an ample amount of storage. Don't miss out on this great home!
-
2017-10-16$125,000 481-char remark
Show marketing remark (481 chars)
Charming 3 bed/2 bath home with all of the updates you could imagine. New tile flooring, updated kitchen cabinets and countertops, newer appliances & new windows to name a few! This home is ideal for a young family as it is situated in a quiet neighborhood and the big backyard offers plenty of space for outdoor activities. Also, there is a large shed on the property that accents the house perfectly and provides an ample amount of storage. Don't miss out on this great home!
-
2016-10-25soldstatus $109,000
-
2016-08-06$112,500
-
2016-06-18soldstatus $55,125
-
2016-03-22$56,900
-
1999-12-03soldstatus $70,000
-
1989-04-01soldstatus $45,000
ⓘ Source: listings_history table (triggers on properties + properties_extension) + one-shot
backfill from property_details.listing_events for pre-trigger history.
Tax reassessment forecast FL · Resets to sale price
- Current annual tax
- $1,543 · $129/mo
- Projected year-2 tax
- $2,034 · $169/mo
- Expected delta
- +$491/yr (+$41/mo · 31.8%)
ⓘ Screening estimate from a state-policy table — verify with the county assessor before closing.
Climate risk First Street
- Flood 1/10 Low FEMA zone X (unshaded) · 0% chance over 30 yrs
- Wildfire 5/10 Major
- Heat 9/10 Extreme 7 d/yr ≥106°F today · 20 d/yr by 30 yrs out
- Wind 9/10 Extreme 99% chance of damaging wind over 30 yrs
- Air quality 2/10 Low 1 unhealthy d/yr today · 1 by 30 yrs out
Nearby sold comps map
Loading sold comps map…
Walkable amenities ~0.75 mi
Loading nearby amenities…
Taxation est. · year 1
- Rental income
- $23,357
- − Mortgage interest
- −$13,724
- − Property taxes
- −$1,543
- − Insurance
- −$1,225
- − Repairs & maintenance
- −$1,869
- − Management
- −$1,869
- − Depreciation
- −$7,127
- Taxable loss
- −$3,999
- Est. tax savings @ 24.0%
- +$960
- After-tax cash flow
- $1,226/yr
For passive investors: Depreciation is non-cash, so a rental often shows a tax loss while cash-flowing — sheltering income. Rental losses are passive: they offset passive income freely, and up to $25,000/yr can offset ordinary (W-2) income if you actively participate and your MAGI is under $100k (phasing out to $0 by $150k); unused losses carry forward. On sale, claimed depreciation is recaptured at up to 25%, and gains may owe capital-gains tax (a 1031 exchange can defer both). Figures are a year-1 estimate at your 24.0% rate — not tax advice; consult a CPA.
Schools (NCES district)
- District
- Santa Rosa
- NCES district ID
- 1201650
- Math proficiency
- 63% ▼ -6.00%
- Reading proficiency
- 60% ▼ -5.00%
- Median HH income
- $58,161
- Composite
- 53.12/100
- National rank
- #1511
- State rank
- #8 of 73 in FL
Livability — Point Baker
- Score
- 63/100
- State rank
- #735
- US rank
- #15840
Category grades
Schools grade is shown separately in the Schools card above.
Census & demographics
- County
- Santa Rosa County · 194,764 people
- Metro
- Pensacola-Ferry Pass-Brent, FL
- Population (ZIP)
- 37,197
- Household income
- $77,222
- Rent vs Own
- Severe rent burden
- 590.0
Population outlook (Santa Rosa County) Hauer SSP2
- Today (2025)
- 195,978 people
- By 2030
- 209,782 · +7.0%
- By 2040
- 235,293 · +20.1%
- By 2050
- 256,408 · +30.8%
- By 2075
- 298,074 · +52.1%
- By 2100
- 303,216 · +54.7%
Race, ethnicity, and origin ACS 2023
- Neighborhood character
- Predominantly White (80%)
- Race & ethnicity
- White 80% Two or more races 7% Black 6% Hispanic / Latino 6% Asian 1%
- Hispanic origin (detail)
- Mexican 2% Puerto Rican 2%
- Common ancestry
- Italian 4% Lithuanian 3% Portuguese 2%
- Foreign-born
- 4% · Canada
- Languages at home
- 94% English-only · Spanish 4% Other Asian/Pacific 1%
Political lean MEDSL · Santa Rosa
- 2024 margin
- Solid R (+51.0) · D 24.1% · R 75.0%
- 2008→2024 swing
- -3.0pp toward R · 2008: -47.9pp · 2024: -51.0pp
- All cycles
- 2024: R+51.0 2020: R+46.5 2016: R+53.5 2012: R+52.6 2008: R+47.9
Not yet ingested
- Civics
- —
Market trends
- HPI YoY
- ▼ -51.06%
- Current HPI
- 287.7469
- Rent YoY
- ▲ 2.70%
- Metro
- Pensacola-Ferry Pass-Brent, FL
- State GDP YoY
- ▲ 3.28%
- F500 in state
- 36
Industry mix (Fortune 500 HQ in FL)
| Industry | F500 HQs | Revenue |
|---|---|---|
| Industrial Technology | 2 | $29B |
|
||
| Insurance | 2 | $17B |
|
||
| Retail | 1 | $60B |
|
||
| Technology Distribution | 1 | $58B |
|
||
| Homebuilding | 1 | $35B |
|
||
| Technology Manufacturing | 1 | $35B |
|
||
Price history
+444.4% since first listed13 events — show timeline
- 2026-05-15 Contingent — PARMLS
- 2026-05-11 Listed $245,000 PARMLS
- 2020-04-28 Sold (Public Records) $149,000 Public Records
- 2020-04-24 Sold (MLS) $149,000 PARMLS
- 2020-01-23 Listed $155,000 PARMLS
- 2018-02-16 Sold (MLS) $125,000 PARMLS
- 2017-10-16 Listed $125,000 PARMLS
- 2016-10-25 Sold (MLS) $109,000 PARMLS
- 2016-08-06 Listed $112,500 PARMLS
- 2016-06-18 Sold (MLS) $55,125 PARMLS
- 2016-03-22 Listed $56,900 PARMLS
- 1999-12-03 Sold (Public Records) $70,000 Public Records
- 1989-04-01 Sold (Public Records) $45,000 Public Records
Property tax history
+9.1%/yrLatest (2025): $1,543 · +1.6% YoY. Source: county tax records.
Cash-flow waterfall
monthlySold comps — $/sqft
last 12 mo · ≤1 miLoading sold comps…