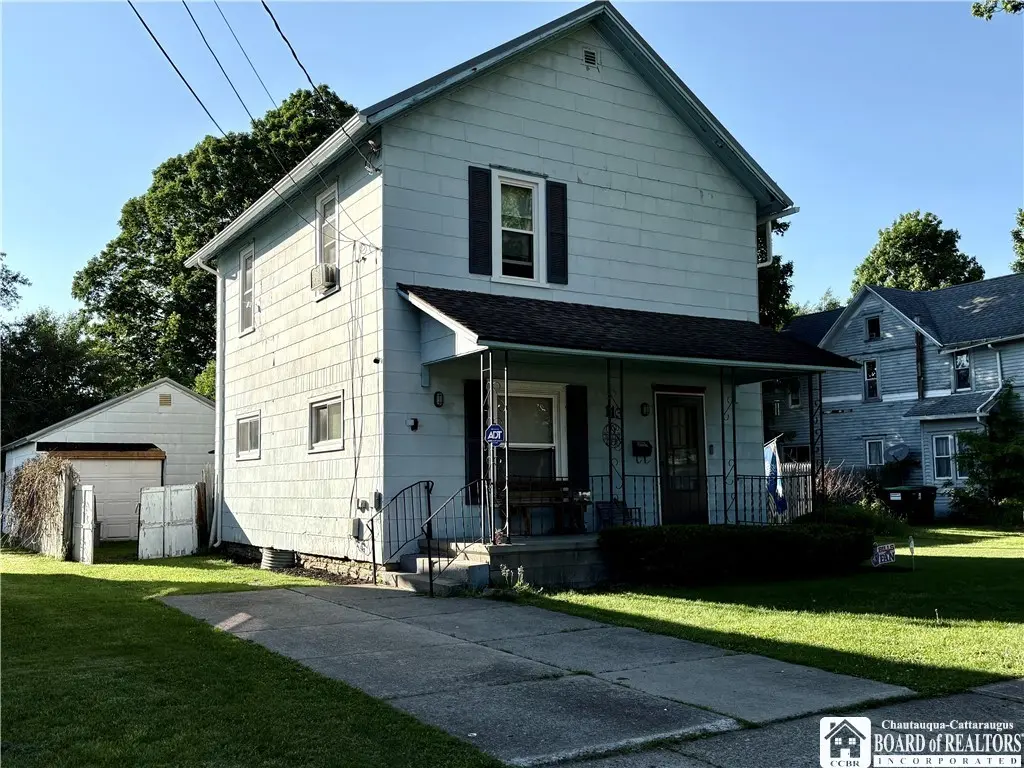
113 E James St · Falconer, NY
Flood risk 4/10 · Minor
- FEMA flood zone
- X
- Chance of flooding over 30 yrs
- 0.2%
- Est. flood insurance / yr
- $473 – $860
Fire risk 1/10 · Minimal
- Est. fire insurance / yr
- $691 – $1,283
Heat risk 2/10 · Minimal
- Hot days now (above 91°F)
- 7 days/yr
- Hot days in 30 yrs
- 17 days/yr
Wind risk 1/10 · Minimal
- Chance of severe wind over 30 yrs
- —
Air-quality risk 2/10 · Minimal
- Unhealthy air days now
- 0 days/yr
- Unhealthy air days in 30 yrs
- 1 days/yr
Risk factors via First Street. Map © Google.
Why this score? — see what drove the C+ grade
The composite is a weighted blend of 9 inputs, each scored 0–100. Each bar is that input's sub-score; the figure is the points it added to the 100-point composite (weight × sub-score).
- Cash flow +18.9/30.0
- ARV discount +15.0/15.0
- Appreciation +6.3/10.0
- DSCR +5.9/10.0
- 1% rule +5.8/10.0
- Schools +4.1/10.0
- Livability +3.6/5.0
- Rent growth +2.5/5.0
- Condition / age +2.5/5.0
$99,900
🖨 Deal sheet 📄 Offer letter ✓ Due diligence
Listing remarks
This well-appointed 3-bedroom, 1-bath home is ready to welcome its new owners. Inside, you'll love the large living room that offers abundant space for family life and entertaining guests. The bright and sunny kitchen fills the home with natural light and provides a cheerful space for daily meals and special occasions. Step outside to your private, fenced-in yard where you can enjoy peaceful evenings and weekend barbecues. The detached garage and off-street parking add valuable convenience and extra storage space. Recent investments in this home mean less worry for you. The roof was replaced in 2023 along with the garage roof, most windows were updated in 2023 to improve energy efficiency,
Key facts
- Bright kitchen
- Off street parking
- Large living room
Tags
Property features AI
Exterior
- Parking: Detached garage; One garage space
- Utilities: Public water connected; Sewer connected
- Home design: Two-story residence; Existing (previously built) property
- Construction: Stone foundation; Construction details: see remarks
- Exterior features: Concrete driveway; Rectangular residential lot; City street frontage; Lot dimensions roughly 60 x 120
Interior
- Kitchen: Gas cooktop; Gas oven; Gas range
- Flooring: Carpet; Vinyl; Varies
- Bathrooms: One full bathroom
- Heating & cooling: Gas heating; Baseboard heating; Window air conditioning units
- Interior features: Kitchen and family room combined; Additional interior features noted in remarks
- Laundry & utility: Gas water heater
Neighborhood map
What this means for you Summary
Snapshot
- This is a 3-bed/1.0-bath single-family listed at $100k.
Deal economics
- At list price, monthly cash flow is $102 ($1k/yr) — positive.
- The deal already cash-flows at list — no discount required.
- Meets the 1% rule at list price ($1k rent vs $100k).
- Recommended offer: $98k (1.5% below list) — sets the bar for market timing.
Location & tenants
- Location reads 71/100 on livability (#391 in NY) — a middle-class / working-renter tenant base. Strengths: cost of living A+, housing A+, health & safety A; Watch: amenities F, commute F, employment F.
- Falconer Central School District (town): math 43% / reading 54% proficiency, ranked #423 of 590 in NY (top 72%) — families likely to look elsewhere, expect single-tenant / working-renter base with shorter leases.
- Market conditions: 17 active listings in the ZIP; 127 units permitted in Chautauqua County in 2024 (0 in 5+ unit buildings).
Forward outlook
- In year one you build about $3k of equity ($691 loan paydown + $2k appreciation (2.5% local appreciation)).
- Chautauqua County population projected at -22% by 2050 — secular population decline; favor cash flow + early exit over multi-decade hold.
- At projected returns (2.5% appreciation + 3.0% rent growth), your $28k cash investment doubles in ~6 years — after that, you're playing with house money.
- By year 10, paydown + projected appreciation supports a ~$31k cash-out refi (75% LTV) — recoverable capital for the next deal without selling this one.
Negotiation context
- It's been on market 18 days — a 2% lower offer ($98k) is reasonable based on typical stale-listing flexibility.
- Current owner paid $33k; list at $100k implies a 202% gain — meaningful room to come down on a strong offer.
Risks & watch-outs
- Watch-outs: built in 1908 — expect roof / HVAC / electrical / plumbing capex.
Questions for the listing agent
- Built in 1908 — when were the roof, HVAC, electrical panel, plumbing, and water heater last replaced?
- Is there a deadline driving the sale (1031 exchange, divorce, estate, relocation)? That informs how much negotiation room exists.
- What's the average days-on-market for RENTAL listings here right now (not sales)? A rising rental-DOM trend means longer vacancies and softer asking-rent achievability than the comps imply.
- What's the recent tenant-quality profile in this submarket — average credit score on applications, eviction rate, late-payment / NSF rate, and stable-employment percentage? A property-management company in the area should have these aggregated.
- How much new for-sale + rental construction is in the pipeline within 1–3 miles? Heavy new supply typically softens prices + rents 12–24 months out; constrained supply supports both.
Investment metrics
- 1% rule
- 1.08% ✓
- Cap rate
- 7.52%
- Cash-on-cash
- 4.37%
- DSCR
- 1.19
- GRM
- 7.7
CMA / ARV
- ARV (on-the-fly)
- $131,560
- Comps found
- 7
Show comp detail 7 sales within ~0.75 mi
| Address | Dist | Beds/Ba | Sqft | Sold | Price | $/sf | Match |
|---|---|---|---|---|---|---|---|
| 222 E James St | 0.12mi | 3/1.0 | 1,144 (0%) | 18mo | $132,000 | $115 | 79 |
| 118 E Falconer St | 0.08mi | 3/1.0 | 1,040 (-9%) | 6mo | $154,000 | $148 | 76 |
| 421 West Ave | 0.21mi | 3/2.0 | 1,152 (+1%) | 17mo | $208,500 | $181 | 71 |
| 14 E Mosher St | 0.15mi | 3/1.0 | 1,256 (+10%) | 14mo | $72,000 | $57 | 65 |
| 225 Richard Ave | 0.39mi | 3/1.5 | 1,280 (+12%) | 1mo | $179,900 | $141 | 59 |
| 57 Mapleshade Ave | 0.41mi | 3/2.0 | 1,288 (+13%) | 2mo | $45,000 | $35 | 54 |
| 217 W Falconer St | 0.47mi | 3/1.0 | 1,248 (+9%) | 24mo | $110,000 | $88 | 43 |
Match score weights: distance 35% · size 25% · config 20% · recency 20%. Top-matched comps best support the ARV.
Projected returns pro-forma
2.5% appreciation · 3.0% rent growth · sell at horizon
- IRR
- 10.3%
- Equity multiple
- 1.57×
- Total profit
- $15,961
- Equity at exit
- $42,137
- IRR
- 12.9%
- Equity multiple
- 2.83×
- Total profit
- $51,132
- Equity at exit
- $62,852
Cash invested: $27,972 (down + closing). Projections, not guarantees.
Landlord ↔ Tenant lean methodology
- Overall (STATE)
- 15 Strongly Tenant-Friendly
- State New York
- 15 Strongly Tenant-Friendly · D+10
- County
- — inherits STATE
- City
- — inherits STATE
ZIP-level market 14733
- Home prices YoY
- 0.9%
- Active inventory
- 17
- Price-to-rent
- 7.7×
Monthly cashflow live
- Estimated rent
- $1,078 medium interval (Pro) →
- Mortgage (P&I)
- −$524
- Tax from tax record
- −$184 /mo · $2,210/yr
- Insurance
- −$42
- HOA
- −$0
- Vacancy / Maint / Mgmt
- −$226
- Net cashflow
- $102
Break-even live
UW: 25.0% down · 7.5% · 30yr · 1.5% tax · 5.0% vac · 8.0% maint · 8.0% mgmt
Financing live
Cash to close
- Down payment
- $24,975
- Closing costs
- $2,997
- Reserves months
- —
- Total cash needed
- —
Loan-product check · same deal, 3 products live
Conventional
25% down · 7.5% · 30yr
- Down + closing
- —
- Monthly P&I
- —
- Monthly cashflow
- —
- DSCR
- —
- Eligible?
- —
Personal DTI + credit; lowest rate.
DSCR
20% down · 8.5% · 30yr
- Down + closing
- —
- Monthly P&I
- —
- Monthly cashflow
- —
- DSCR
- —
- Eligible?
- —
No personal income docs; deal must DSCR.
Hard money
10% down · 12.0% · 12mo
- Down + closing
- —
- Monthly P&I
- —
- Monthly cashflow
- —
- DSCR
- —
- Eligible?
- —
Short-term bridge; refi at stabilization.
Listing history 12 events
-
2026-06-19days on market $99,900 Active 18 DOM
-
2026-06-18days on market $99,900 Active 17 DOM
-
2026-06-17days on market $99,900 Active 16 DOM
-
2026-06-16days on market $99,900 Active 15 DOM
-
2026-06-15days on market $99,900 Active 14 DOM
-
2026-06-14days on market $99,900 Active 12 DOM
-
2026-06-12days on market $99,900 Active 11 DOM
-
2026-06-09days on market $99,900 Active 8 DOM
-
2026-06-08days on market $99,900 Active 7 DOM
-
2026-06-07days on market $99,900 Active 6 DOM
-
2026-06-02remarks 699-char remark
-
2026-06-02$99,900 Active 1 DOM
ⓘ Source: listings_history table (triggers on properties + properties_extension) + one-shot
backfill from property_details.listing_events for pre-trigger history.
Tax reassessment forecast NY · Partial reset (capped growth)
- Current annual tax
- $2,210 · $184/mo
- Projected year-2 tax
- $2,210 · $184/mo
- Expected delta
- $0/yr ($0/mo · 0.0%)
ⓘ Screening estimate from a state-policy table — verify with the county assessor before closing.
Climate risk First Street
- Flood 4/10 Moderate FEMA zone X · 20% chance over 30 yrs
- Wildfire 1/10 Low
- Heat 2/10 Low 7 d/yr ≥91°F today · 17 d/yr by 30 yrs out
- Wind 1/10 Low
- Air quality 2/10 Low 0 unhealthy d/yr today · 1 by 30 yrs out
Nearby sold comps map
Loading sold comps map…
Walkable amenities ~0.75 mi
Loading nearby amenities…
Taxation est. · year 1
- Rental income
- $12,935
- − Mortgage interest
- −$5,596
- − Property taxes
- −$2,210
- − Insurance
- −$500
- − Repairs & maintenance
- −$1,035
- − Management
- −$1,035
- − Depreciation
- −$2,906
- Taxable loss
- −$346
- Est. tax savings @ 24.0%
- +$83
- After-tax cash flow
- $1,306/yr
For passive investors: Depreciation is non-cash, so a rental often shows a tax loss while cash-flowing — sheltering income. Rental losses are passive: they offset passive income freely, and up to $25,000/yr can offset ordinary (W-2) income if you actively participate and your MAGI is under $100k (phasing out to $0 by $150k); unused losses carry forward. On sale, claimed depreciation is recaptured at up to 25%, and gains may owe capital-gains tax (a 1031 exchange can defer both). Figures are a year-1 estimate at your 24.0% rate — not tax advice; consult a CPA.
Schools (NCES district)
- District
- Falconer Central School District
- NCES district ID
- 3610920
- Math proficiency
- 43% ▼ -9.00%
- Reading proficiency
- 54% ▲ 11.00%
- Median HH income
- $44,363
- Composite
- 40.96/100
- National rank
- #3600
- State rank
- #423 of 590 in NY
Livability — Falconer
- Score
- 71/100
- State rank
- #391
- US rank
- #6759
Category grades
Schools grade is shown separately in the Schools card above.
Census & demographics
- Census place
- Falconer, NY
- Population (ZIP)
- 3,201
Population outlook (Chautauqua County) Hauer SSP2
- Today (2025)
- 123,454 people
- By 2030
- 118,509 · -4.0%
- By 2040
- 107,311 · -13.1%
- By 2050
- 96,703 · -21.7%
- By 2075
- 76,757 · -37.8%
- By 2100
- 60,984 · -50.6%
Race, ethnicity, and origin ACS 2023
- Neighborhood character
- Predominantly White (91%)
- Race & ethnicity
- White 91% Two or more races 6% Hispanic / Latino 1%
- Common ancestry
- Romanian 3% Lithuanian 2% Iranian 2%
- Foreign-born
- 1%
- Languages at home
- 98% English-only · Spanish 1%
Political lean MEDSL · Chautauqua
- 2024 margin
- Strong R (+22.0) · D 39.0% · R 61.0%
- 2008→2024 swing
- -22.9pp toward R · 2008: 0.9pp · 2024: -22.0pp
- All cycles
- 2024: R+22.0 2020: R+19.8 2016: R+24.6 2012: R+8.2 2008: D+0.9
Not yet ingested
- Civics
- —
Market trends
- HPI YoY
- ▲ 2.50%
- Current HPI
- 271.5037
- Rent YoY
- —
- Metro
- —
- State GDP YoY
- ▲ 2.60%
- F500 in state
- 92
Industry mix (Fortune 500 HQ in NY)
| Industry | F500 HQs | Revenue |
|---|---|---|
| Financial Services | 10 | $950B |
|
||
| Consumer Goods | 9 | $162B |
|
||
| Insurance | 4 | $225B |
|
||
| Telecommunications | 2 | $144B |
|
||
| Pharmaceuticals | 2 | $112B |
|
||
| Media / Entertainment | 2 | $69B |
|
||
Price history
+212.2% since first listed3 events — show timeline
- 2026-06-01 Listed $99,900 UNYREIS
- 2003-03-07 Sold (Public Records) $33,105 Public Records
- 2000-02-01 Sold (Public Records) $32,000 Public Records
Property tax history
-0.2%/yrLatest (2025): $2,210 · +5.1% YoY. Source: county tax records.
Cash-flow waterfall
monthlySold comps — $/sqft
last 12 mo · ≤1 miLoading sold comps…