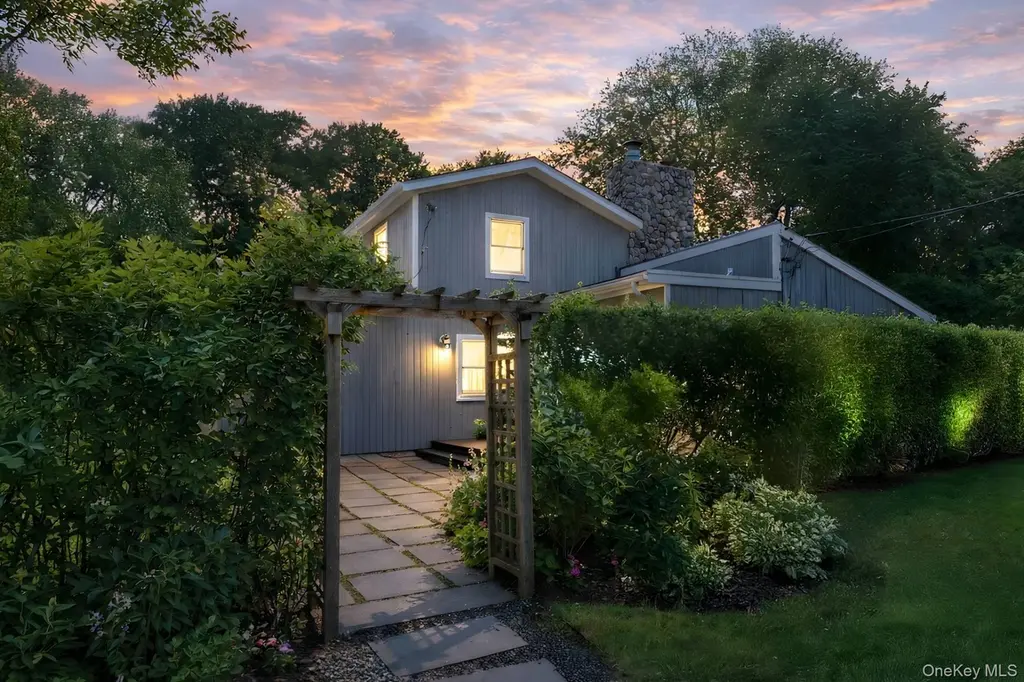
64 Fairview Ave · Montauk, NY
Flood risk 1/10 · Minimal
- FEMA flood zone
- X (unshaded)
- Chance of flooding over 30 yrs
- 0.0%
- Est. flood insurance / yr
- $473 – $860
Fire risk 2/10 · Minimal
- Est. fire insurance / yr
- $691 – $1,283
Heat risk 4/10 · Minor
- Hot days now (above 88°F)
- 7 days/yr
- Hot days in 30 yrs
- 20 days/yr
Wind risk 8/10 · Major
- Chance of severe wind over 30 yrs
- 80.0%
Air-quality risk 3/10 · Minor
- Unhealthy air days now
- 2 days/yr
- Unhealthy air days in 30 yrs
- 3 days/yr
Risk factors via First Street. Map © Google.
Why this score? — see what drove the A- grade
The composite is a weighted blend of 9 inputs, each scored 0–100. Each bar is that input's sub-score; the figure is the points it added to the 100-point composite (weight × sub-score).
- Cash flow +30.0/30.0
- ARV discount +15.0/15.0
- DSCR +10.0/10.0
- 1% rule +7.7/10.0
- Schools +5.1/10.0
- Appreciation +4.1/10.0
- Livability +3.5/5.0
- Rent growth +2.5/5.0
- Condition / age +2.5/5.0
$1,675,000
🖨 Deal sheet 📄 Offer letter ✓ Due diligence
Listing remarks MLS
Moments to Village and Golf. Full of Potential. Some properties offer a house. This one offers a legacy. 64 Fairview Avenue sits in the heart of Montauk, one of the East End's most sought-after addresses and this summer, it's priced to sell! This 4-bedroom, 3.5-bath home has the bones, the proportions, and the location that serious buyers know are impossible to manufacture. What you do with it is entirely up to you. Whether you're envisioning a stunning primary retreat, a high-performing rental, or the cherished family home that becomes part of your story and gets passed down to the people who matter most, the foundation is here. The potential is extraordinary. Step outside and Montauk's finest rewards are at your door: the village's beloved restaurants and boutiques, the ocean beaches, the scenic trails, and just moments away, the legendary Montauk Downs State Park Golf Course, offering championship golf, tennis, and sweeping parkland practically in your backyard.
Key facts
- Finished lower level
- 0.6 acre lot
- Built 1980
Tags
Neighborhood map
What this means for you Summary
Snapshot
- This is a 4-bed/2.5-bath single-family listed at $1.68M.
Deal economics
- At list price, monthly cash flow is $7k ($79k/yr) — positive.
- The deal already cash-flows at list — no discount required.
- Meets the 1% rule at list price ($21k rent vs $1.68M).
- Recommended offer: $1.52M (9.0% below list) — sets the bar for market timing.
- Cap rate 11.0% vs local median 7.9% in Montauk — top-decile yield for the area; either an underpriced asset or a hidden risk that comps aren't pricing in. Stress-test before assuming the spread holds.
Location & tenants
- Location reads 69/100 on livability (#474 in NY) — a middle-class / working-renter tenant base. Strengths: crime A+, employment A+, health & safety A; Watch: housing C-, amenities F, commute F.
- Montauk Union Free School District (town): math 50% / reading 60% proficiency, ranked #311 of 755 in NY (top 41%) — acceptable for families but not a draw, mixed tenant base, ~2y average lease.
- Market conditions: 39 active listings in the ZIP; 3 comparable units currently listed for rent nearby; rentals at typical pace (median 19d on market — plan ~3-4 weeks tenant-placement turnaround); high-income renter base; 1,366 units permitted in Suffolk County in 2024 (216 in 5+ unit buildings).
- At $21,336/mo this rent would consume 179% of the median local household income ($143k/yr) (locally 20% of renters already pay >50% of income on rent) — very limited rent-growth headroom before tenants either downsize or default.
Forward outlook
- Local home prices are declining (-1.8%/yr); year-one equity from $12k of loan paydown is wiped out by about $30k of value loss. Plan a longer hold.
- Suffolk County population projected to shrink 5% by 2050 — rents likely to lag national; underwrite the cash flow, not the appreciation.
- At projected returns (-1.8% appreciation + 3.0% rent growth), your $469k cash investment doubles in ~6 years — after that, you're playing with house money.
Negotiation context
- It's been on market 115 days — a 9% lower offer ($1.52M) is reasonable based on typical stale-listing flexibility.
- 2 sale attempts with the ask held roughly flat each time — persistent listings suggest the price (not the market) is what's stuck; bring a comps-based counter.
- Current owner paid $430k; list at $1.68M implies a 290% gain — meaningful room to come down on a strong offer.
Risks & watch-outs
- Climate carrying-cost: severe wind risk, 80% chance of damaging wind over 30y — expect insurance premiums to compound above CPI over the hold.
Questions for the listing agent
- It's been on market 115 days. Have you received any prior offers? Is the seller open to a 9% concession, seller financing, or rate buy-down credit?
- Why hasn't it sold? Are there any deal-killer items the seller is aware of (foundation, flood, title, zoning, code violations)?
- Is there a deadline driving the sale (1031 exchange, divorce, estate, relocation)? That informs how much negotiation room exists.
- What's the average days-on-market for RENTAL listings here right now (not sales)? A rising rental-DOM trend means longer vacancies and softer asking-rent achievability than the comps imply.
- What's the recent tenant-quality profile in this submarket — average credit score on applications, eviction rate, late-payment / NSF rate, and stable-employment percentage? A property-management company in the area should have these aggregated.
- How much new for-sale + rental construction is in the pipeline within 1–3 miles? Heavy new supply typically softens prices + rents 12–24 months out; constrained supply supports both.
Investment metrics
- 1% rule
- 1.27% ✓
- Cap rate
- 11.01%
- Cash-on-cash
- 16.86%
- DSCR
- 1.75
- GRM
- 6.5
CMA / ARV
- ARV (median comp)
- $2,621,734
- List price
- $1,675,000
- Delta
- -36.11%
- Verdict
- UNDERPRICED
- Comps
- 2 within 1.0 mi
Projected returns pro-forma
-1.78% appreciation · 3.0% rent growth · sell at horizon
- IRR
- 11.7%
- Equity multiple
- 1.50×
- Total profit
- $234,802
- Equity at exit
- $342,382
- IRR
- 18.8%
- Equity multiple
- 2.75×
- Total profit
- $821,385
- Equity at exit
- $309,043
Cash invested: $469,000 (down + closing). Projections, not guarantees.
Landlord ↔ Tenant lean methodology
- Overall (STATE)
- 15 Strongly Tenant-Friendly
- State New York
- 15 Strongly Tenant-Friendly · D+10
- County
- — inherits STATE
- City
- — inherits STATE
ZIP-level market 11954
- Home prices YoY
- -0.3%
- Active inventory
- 39
- Price-to-rent
- 6.5×
Monthly cashflow live
- Estimated rent
- $21,336 medium interval (Pro) →
- Mortgage (P&I)
- −$8,784
- Tax from tax record
- −$785 /mo · $9,423/yr
- Insurance
- −$698
- HOA
- −$0
- Vacancy / Maint / Mgmt
- −$4,481
- Net cashflow
- $6,589
Break-even live
UW: 25.0% down · 7.5% · 30yr · 1.5% tax · 5.0% vac · 8.0% maint · 8.0% mgmt
Financing live
Cash to close
- Down payment
- $418,750
- Closing costs
- $50,250
- Reserves months
- —
- Total cash needed
- —
Loan-product check · same deal, 3 products live
Conventional
25% down · 7.5% · 30yr
- Down + closing
- —
- Monthly P&I
- —
- Monthly cashflow
- —
- DSCR
- —
- Eligible?
- —
Personal DTI + credit; lowest rate.
DSCR
20% down · 8.5% · 30yr
- Down + closing
- —
- Monthly P&I
- —
- Monthly cashflow
- —
- DSCR
- —
- Eligible?
- —
No personal income docs; deal must DSCR.
Hard money
10% down · 12.0% · 12mo
- Down + closing
- —
- Monthly P&I
- —
- Monthly cashflow
- —
- DSCR
- —
- Eligible?
- —
Short-term bridge; refi at stabilization.
Rent comps 3 comps
| Address | Beds | Baths | Sqft | Rent | $/sqft | DOM | Units | Dist |
|---|---|---|---|---|---|---|---|---|
| 155 S Essex St Montauk, NY | 5.0 | 2.0 | 2348 | $55,000 | $23.42 | 22d | 1 | 0.67mi |
| 154 W Lake Dr Montauk, NY | 4.0 | 2.5 | 2800 | $30,000 | $10.71 | 19d | 1 | 0.86mi |
| 70 S Delrey Rd Montauk, NY | 4.0 | 3.0 | 2000 | $30,000 | $15.00 | 1d | 1 | 1.39mi |
Listing history 21 events
-
2026-06-18days on market $1,675,000 Active 115 DOM
-
2026-06-17days on market $1,675,000 Active 114 DOM
-
2026-06-16days on market $1,675,000 Active 113 DOM
-
2026-06-15days on market $1,675,000 Active 112 DOM
-
2026-06-13days on market $1,675,000 Active 110 DOM
-
2026-06-13days on market $1,675,000 Active 109 DOM
-
2026-06-09days on market $1,675,000 Active 106 DOM
-
2026-06-08days on market $1,675,000 Active 105 DOM
-
2026-06-07days on market $1,675,000 Active 104 DOM
-
2026-06-04days on market $1,675,000 Active 101 DOM
-
2026-06-03days on market $1,675,000 Active 100 DOM
-
2026-06-02days on market $1,675,000 Active 99 DOM
-
2026-06-01days on market $1,675,000 Active 98 DOM
-
2026-05-31days on market $1,675,000 Active 97 DOM
-
2026-02-23$1,675,000 Active 979-char remark
Show marketing remark (979 chars)
Moments to Village and Golf. Full of Potential. Some properties offer a house. This one offers a legacy. 64 Fairview Avenue sits in the heart of Montauk, one of the East End's most sought-after addresses and this summer, it's priced to sell! This 4-bedroom, 3.5-bath home has the bones, the proportions, and the location that serious buyers know are impossible to manufacture. What you do with it is entirely up to you. Whether you're envisioning a stunning primary retreat, a high-performing rental, or the cherished family home that becomes part of your story and gets passed down to the people who matter most, the foundation is here. The potential is extraordinary. Step outside and Montauk's finest rewards are at your door: the village's beloved restaurants and boutiques, the ocean beaches, the scenic trails, and just moments away, the legendary Montauk Downs State Park Golf Course, offering championship golf, tennis, and sweeping parkland practically in your backyard.
-
2026-02-19historical
-
2025-12-18price $1,800,000
-
2025-12-18price $180,000
-
2025-07-31price $1,950,000
-
2025-02-18$2,350,000 Active
-
2003-10-28soldstatus $430,000
ⓘ Source: listings_history table (triggers on properties + properties_extension) + one-shot
backfill from property_details.listing_events for pre-trigger history.
Tax reassessment forecast NY · Partial reset (capped growth)
- Current annual tax
- $9,423 · $785/mo
- Projected year-2 tax
- $18,865 · $1,572/mo
- Expected delta
- +$9,442/yr (+$787/mo · 100.2%)
ⓘ Screening estimate from a state-policy table — verify with the county assessor before closing.
Climate risk First Street
- Flood 1/10 Low FEMA zone X (unshaded) · 0% chance over 30 yrs
- Wildfire 2/10 Low
- Heat 4/10 Moderate 7 d/yr ≥88°F today · 20 d/yr by 30 yrs out
- Wind 8/10 Severe 80% chance of damaging wind over 30 yrs
- Air quality 3/10 Moderate 2 unhealthy d/yr today · 3 by 30 yrs out
Nearby sold comps map
Loading sold comps map…
Walkable amenities ~0.75 mi
Loading nearby amenities…
Taxation est. · year 1
- Rental income
- $256,035
- − Mortgage interest
- −$93,826
- − Property taxes
- −$9,423
- − Insurance
- −$8,375
- − Repairs & maintenance
- −$20,483
- − Management
- −$20,483
- − Depreciation
- −$48,727
- Taxable income
- $54,718
- Est. tax owed @ 24.0%
- −$13,132
- After-tax cash flow
- $65,931/yr
For passive investors: Depreciation is non-cash, so a rental often shows a tax loss while cash-flowing — sheltering income. Rental losses are passive: they offset passive income freely, and up to $25,000/yr can offset ordinary (W-2) income if you actively participate and your MAGI is under $100k (phasing out to $0 by $150k); unused losses carry forward. On sale, claimed depreciation is recaptured at up to 25%, and gains may owe capital-gains tax (a 1031 exchange can defer both). Figures are a year-1 estimate at your 24.0% rate — not tax advice; consult a CPA.
Schools (NCES district)
- District
- Montauk Union Free School District
- NCES district ID
- 3619710
- Math proficiency
- 50% ▼ -10.00%
- Reading proficiency
- 60% ▬ 0.00%
- Median HH income
- $73,702
- Composite
- 50.99/100
- National rank
- #3831
- State rank
- #311 of 755 in NY
Livability — Montauk
- Score
- 69/100
- State rank
- #474
- US rank
- #8373
Category grades
Schools grade is shown separately in the Schools card above.
Census & demographics
- Census place
- Montauk, NY
- County
- Suffolk County · 679,920 people
- City population
- 4,223
- Metro
- New York-Newark-Jersey City, NY-NJ-PA
- Population (ZIP)
- 4,223
- Household income
- $142,961
- Rent vs Own
- Severe rent burden
- 20.0
Population outlook (Suffolk County) Hauer SSP2
- Today (2025)
- 1,505,262 people
- By 2030
- 1,498,318 · -0.5%
- By 2040
- 1,471,101 · -2.3%
- By 2050
- 1,424,848 · -5.3%
- By 2075
- 1,337,157 · -11.2%
- By 2100
- 1,217,720 · -19.1%
Race, ethnicity, and origin ACS 2023
- Neighborhood character
- Predominantly White (89%)
- Race & ethnicity
- White 89% Hispanic / Latino 6% Two or more races 4% Black 1%
- Hispanic origin (detail)
- Mexican 2% Dominican 1%
- Common ancestry
- Romanian 4% Scotch-Irish 3% Italian 3%
- Foreign-born
- 10% · Canada, Jamaica
- Languages at home
- 90% English-only · Spanish 4% Russian/Polish/Slavic 4% Other Indo-European 1%
Political lean MEDSL · Suffolk
- 2024 margin
- Lean R (+10.0) · D 45.0% · R 55.0%
- 2008→2024 swing
- -16.0pp toward R · 2008: 6.0pp · 2024: -10.0pp
- All cycles
- 2024: R+10.0 2020: R+0.0 2016: R+8.2 2012: D+2.9 2008: D+6.0
Not yet ingested
- Civics
- —
Market trends
- HPI YoY
- ▼ -1.78%
- Current HPI
- 577.7344
- Rent YoY
- —
- Metro
- New York-Newark-Jersey City, NY-NJ-PA
- State GDP YoY
- ▲ 2.60%
- F500 in state
- 92
Industry mix (Fortune 500 HQ in NY)
| Industry | F500 HQs | Revenue |
|---|---|---|
| Financial Services | 10 | $950B |
|
||
| Consumer Goods | 9 | $162B |
|
||
| Insurance | 4 | $225B |
|
||
| Telecommunications | 2 | $144B |
|
||
| Pharmaceuticals | 2 | $112B |
|
||
| Media / Entertainment | 2 | $69B |
|
||
Price history
+289.5% since first listed7 events — show timeline
- 2026-02-23 Listed $1,675,000 OneKey® MLS as Distributed by MLS Grid
- 2026-02-19 Listing Removed — OneKey® MLS as Distributed by MLS Grid
- 2025-12-18 Price Changed $1,800,000 OneKey® MLS as Distributed by MLS Grid
- 2025-12-18 Price Changed $180,000 OneKey® MLS as Distributed by MLS Grid
- 2025-07-31 Price Changed $1,950,000 OneKey® MLS as Distributed by MLS Grid
- 2025-02-18 Listed $2,350,000 OneKey® MLS as Distributed by MLS Grid
- 2003-10-28 Sold (Public Records) $430,000 Public Records
Property tax history
+1.8%/yrLatest (2025): $9,423 · +0.0% YoY. Source: county tax records.
Cash-flow waterfall
monthlySold comps — $/sqft
last 12 mo · ≤1 miLoading sold comps…