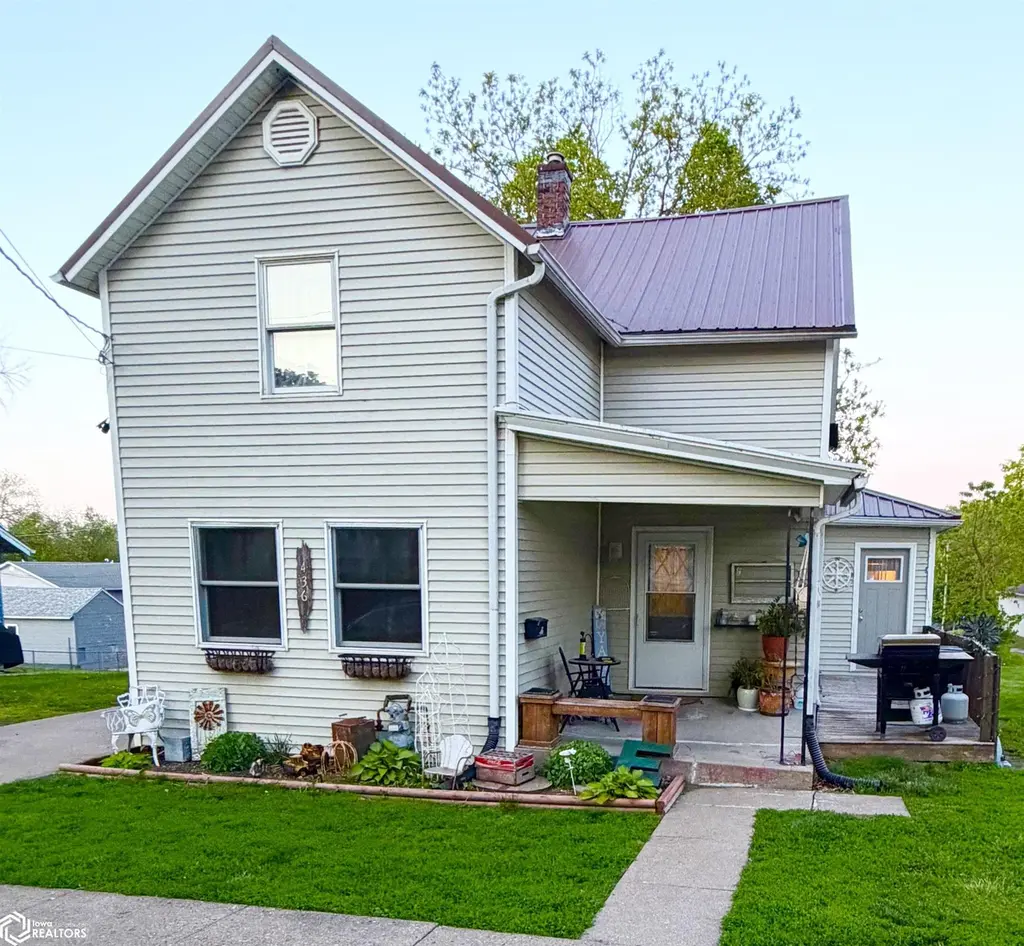
436 N 4th St · Oskaloosa, IA
Flood risk 1/10 · Minimal
- FEMA flood zone
- X (unshaded)
- Chance of flooding over 30 yrs
- 0.0%
- Est. flood insurance / yr
- $473 – $860
Fire risk 1/10 · Minimal
- Est. fire insurance / yr
- $902 – $1,676
Heat risk 3/10 · Minor
- Hot days now (above 103°F)
- 7 days/yr
- Hot days in 30 yrs
- 16 days/yr
Wind risk 2/10 · Minimal
- Chance of severe wind over 30 yrs
- —
Air-quality risk 2/10 · Minimal
- Unhealthy air days now
- 1 days/yr
- Unhealthy air days in 30 yrs
- 1 days/yr
Risk factors via First Street. Map © Google.
Why this score? — see what drove the C grade
The composite is a weighted blend of 9 inputs, each scored 0–100. Each bar is that input's sub-score; the figure is the points it added to the 100-point composite (weight × sub-score).
- Cash flow +17.9/30.0
- ARV discount +15.0/15.0
- DSCR +5.6/10.0
- Schools +5.4/10.0
- 1% rule +4.6/10.0
- Livability +4.0/5.0
- Rent growth +2.5/5.0
- Condition / age +2.5/5.0
- Appreciation +0.0/10.0
$149,900
🖨 Deal sheet (PDF) 📄 Offer letter ✓ Due diligence
Listing remarks MLS
Remodeled 3-4 BR home in a great neighborhood! Tons of windows for natural light throughout! Many updates! Brand new furnace and central air! Flooring and paint.
Key facts
- 6,098 sq ft lot
- Built 1930
- Listed 45 days
Property features AI
Exterior
- Parking: Outside parking on concrete
- Utilities: Public water; Public sewer
- Home design: Two levels; Single-family residence; Vinyl siding
- Construction: Vinyl siding construction
- Exterior features: Lot approx. 0.14 acres (50 x 120)
Interior
- Bathrooms: 1 full bathroom; 1 half bathroom
- Heating & cooling: Central air; Forced air heating
- Interior features: Basement present; Central air conditioning; Forced air heating
Neighborhood map
What this means for you Summary
Snapshot
- This is a 4-bed/1.5-bath single-family listed at $150k.
Deal economics
- At list price, monthly cash flow is $127 ($2k/yr) — positive.
- The deal already cash-flows at list — no discount required.
- To meet the 1% rule (rent ≥ 1% of price), the offer needs to be $145k (3.6% below list).
- Recommended offer: $145k (3.6% below list) — sets the bar for 1% rule.
- Cap rate 7.3% vs local median 4.9% in Oskaloosa — top-decile yield for the area; either an underpriced asset or a hidden risk that comps aren't pricing in. Stress-test before assuming the spread holds.
Location & tenants
- Location reads 81/100 on livability (#57 in IA, #1,325 nationally) — a professional / high-income tenant draw. Strengths: cost of living A+, housing A+, health & safety A+; Watch: employment C-, amenities D-, commute F.
- Oskaloosa Community School District (rural): math 62% / reading 67% proficiency, ranked #208 of 289 in IA (top 72%) — acceptable for families but not a draw, mixed tenant base, ~2y average lease.
- Zoned schools: Oskaloosa Elementary School (math 67% / reading 62%, grade B, #317 of 616 statewide, top 58%, 886 students, 53% FRL); Oskaloosa Middle School (math 65% / reading 71%, grade A-, #131 of 246 statewide, top 53%, 454 students, 49% FRL); Oskaloosa High School (math 55% / reading 67%, grade C+, #258 of 336 statewide, top 78%, 600 students, 36% FRL) — zoned schools at 46% FRL track the district average.
- Market conditions: 73 active listings in the ZIP; 13 units permitted in Mahaska County in 2024 (0 in 5+ unit buildings).
Forward outlook
- Local home prices are declining (-3.0%/yr); year-one equity from $1k of loan paydown is wiped out by about $4k of value loss. Plan a longer hold.
- Mahaska County population projected at -10% by 2050 — secular population decline; favor cash flow + early exit over multi-decade hold.
Negotiation context
- It's been on market 45 days — a 3% lower offer ($145k) is reasonable based on typical stale-listing flexibility.
- 3 sale attempts since 4y ago with the ask held roughly flat each time — persistent listings suggest the price (not the market) is what's stuck; bring a comps-based counter.
- Current owner paid $109k; 38% above their basis — modest negotiation headroom, anchor on the comps not their cost.
Risks & watch-outs
- Watch-outs: built in 1930 — expect roof / HVAC / electrical / plumbing capex.
Questions for the listing agent
- It's been on market 45 days. Have you received any prior offers? Is the seller open to a 4% concession, seller financing, or rate buy-down credit?
- Built in 1930 — when were the roof, HVAC, electrical panel, plumbing, and water heater last replaced?
- Is there a deadline driving the sale (1031 exchange, divorce, estate, relocation)? That informs how much negotiation room exists.
- Schools are B-rated — typically a magnet for longer-tenancy family renters. What's the average tenant stay here, and is there a school-zone premium baked into asking?
- What's the average days-on-market for RENTAL listings here right now (not sales)? A rising rental-DOM trend means longer vacancies and softer asking-rent achievability than the comps imply.
- What's the recent tenant-quality profile in this submarket — average credit score on applications, eviction rate, late-payment / NSF rate, and stable-employment percentage? A property-management company in the area should have these aggregated.
- How much new for-sale + rental construction is in the pipeline within 1–3 miles? Heavy new supply typically softens prices + rents 12–24 months out; constrained supply supports both.
Investment metrics
- 1% rule
- 0.96% ✗
- Cap rate
- 7.31%
- Cash-on-cash
- 3.63%
- DSCR
- 1.16
- GRM
- 8.6
CMA / ARV
- ARV (median comp)
- $201,368
- List price
- $149,900
- Delta
- -25.56%
- Verdict
- UNDERPRICED
- Comps
- 20 within 1.0 mi
Show comp detail 12 sales within ~0.75 mi
| Address | Dist | Beds/Ba | Sqft | Sold | Price | $/sf | Match |
|---|---|---|---|---|---|---|---|
| 1109 N 2nd St | 0.32mi | 3/1.5 (-1) | 1,451 (-1%) | 6mo | $162,000 | $112 | 74 |
| 403 A Ave E | 0.24mi | 4/2.0 | 1,534 (+5%) | 8mo | $115,000 | $75 | 72 |
| 436 North 3rd St | 0.06mi | 3/2.0 (-1) | 1,621 (+11%) | 10mo | $252,500 | $156 | 64 |
| 410 N B St | 0.37mi | 3/2.0 (-1) | 1,345 (-8%) | 4mo | $136,000 | $101 | 59 |
| 129 K Ave E | 0.37mi | 4/2.0 | 1,646 (+13%) | 1mo | $281,000 | $171 | 58 |
| 210 S 9th St | 0.51mi | 4/2.0 | 1,357 (-7%) | 10mo | $175,000 | $129 | 54 |
| 1042 1st Ave E | 0.57mi | 3/1.5 (-1) | 1,352 (-7%) | 3mo | $147,500 | $109 | 54 |
| 1105 N 3rd St | 0.29mi | 3/2.0 (-1) | 1,676 (+15%) | 2mo | $175,000 | $104 | 53 |
| 710 N C St | 0.45mi | 3/1.0 (-1) | 1,242 (-15%) | 7mo | $60,000 | $48 | 41 |
| 611 S Market St | 0.71mi | 3/2.0 (-1) | 1,604 (+10%) | 3mo | $144,000 | $90 | 41 |
| 712 N H St | 0.74mi | 3/1.0 (-1) | 1,276 (-13%) | 0mo | $165,000 | $129 | 37 |
| 408 4th Ave E | 0.57mi | 3/2.0 (-1) | 1,660 (+14%) | 10mo | $150,000 | $90 | 35 |
Match score weights: distance 35% · size 25% · config 20% · recency 20%. Top-matched comps best support the ARV.
Projected returns pro-forma
-3.0% appreciation · 3.0% rent growth · sell at horizon
- IRR
- -10.6%
- Equity multiple
- 0.61×
- Total profit
- $-16,193
- Equity at exit
- $22,351
- IRR
- -1.3%
- Equity multiple
- 0.91×
- Total profit
- $-3,649
- Equity at exit
- $12,961
Cash invested: $41,972 (down + closing). Projections, not guarantees.
Landlord ↔ Tenant lean methodology
- Overall (STATE)
- 83 Strongly Landlord-Friendly
- State Iowa
- 83 Strongly Landlord-Friendly · R+6
- County
- — inherits STATE
- City
- — inherits STATE
ZIP-level market 52577
- Home prices YoY
- -25.4%
- Active inventory
- 73
- Price-to-rent
- 8.6×
Monthly cashflow live
- Estimated rent
- $1,445 medium interval (Pro) →
- Mortgage (P&I)
- −$786
- Tax from tax record
- −$166 /mo · $1,994/yr
- Insurance
- −$62
- HOA
- −$0
- Vacancy / Maint / Mgmt
- −$303
- Net cashflow
- $127
Break-even live
Sensitivity live
| Price | -10% $212 | -5% $169 | +0% $127 | +5% $85 | +10% $42 |
|---|---|---|---|---|---|
| Rent | -10% $13 | -5% $70 | +0% $127 | +5% $184 | +10% $241 |
| Rate | -1.0pp $202 | -0.5pp $165 | base $127 | +0.5pp $88 | +1.0pp $49 |
UW: 25.0% down · 7.5% · 30yr · 1.5% tax · 5.0% vac · 8.0% maint · 8.0% mgmt
Financing live
Cash to close
- Down payment
- $37,475
- Closing costs
- $4,497
- Reserves months
- —
- Total cash needed
- —
Loan-product check · same deal, 3 products live
Conventional
25% down · 7.5% · 30yr
- Down + closing
- —
- Monthly P&I
- —
- Monthly cashflow
- —
- DSCR
- —
- Eligible?
- —
Personal DTI + credit; lowest rate.
DSCR
20% down · 8.5% · 30yr
- Down + closing
- —
- Monthly P&I
- —
- Monthly cashflow
- —
- DSCR
- —
- Eligible?
- —
No personal income docs; deal must DSCR.
Hard money
10% down · 12.0% · 12mo
- Down + closing
- —
- Monthly P&I
- —
- Monthly cashflow
- —
- DSCR
- —
- Eligible?
- —
Short-term bridge; refi at stabilization.
Listing history 23 events
-
2026-06-21days on market $149,900 Active 45 DOM
-
2026-06-21days on market $149,900 Active 44 DOM
-
2026-06-18days on market $149,900 Active 42 DOM
-
2026-06-17days on market $149,900 Active 41 DOM
-
2026-06-16days on market $149,900 Active 40 DOM
-
2026-06-15days on market $149,900 Active 39 DOM
-
2026-06-14price $149,900 Active 37 DOM
-
2026-06-13days on market $154,000 Active 37 DOM
-
2026-06-12days on market $154,000 Active 36 DOM
-
2026-06-09days on market $154,000 Active 33 DOM
-
2026-06-08days on market $154,000 Active 32 DOM
-
2026-06-07days on market $154,000 Active 31 DOM
-
2026-06-07days on market $154,000 Active 30 DOM
-
2026-06-04days on market $154,000 Active 27 DOM
-
2026-06-02days on market $154,000 Active 26 DOM
-
2026-06-01days on market $154,000 Active 25 DOM
-
2026-05-31days on market $154,000 Active 24 DOM
-
2026-05-31days on market $154,000 Active 23 DOM
-
2026-05-16historical Active Under Contract 443-char remark
-
2026-05-07$154,000 Active 443-char remark
-
2022-07-29soldstatus $109,000
-
2022-07-28soldstatus $109,000 161-char remark
Show marketing remark (161 chars)
Remodeled 3-4 BR home in a great neighborhood! Tons of windows for natural light throughout! Many updates! Brand new furnace and central air! Flooring and paint.
-
2022-06-16$108,000 161-char remark
Show marketing remark (161 chars)
Remodeled 3-4 BR home in a great neighborhood! Tons of windows for natural light throughout! Many updates! Brand new furnace and central air! Flooring and paint.
ⓘ Source: listings_history table (triggers on properties + properties_extension) + one-shot
backfill from property_details.listing_events for pre-trigger history.
Tax reassessment forecast IA · Partial reset (capped growth)
- Current annual tax
- $1,994 · $166/mo
- Projected year-2 tax
- $2,174 · $181/mo
- Expected delta
- +$180/yr (+$15/mo · 9.0%)
ⓘ Screening estimate from a state-policy table — verify with the county assessor before closing.
Climate risk First Street
- Flood 1/10 Low FEMA zone X (unshaded) · 0% chance over 30 yrs
- Wildfire 1/10 Low
- Heat 3/10 Moderate 7 d/yr ≥103°F today · 16 d/yr by 30 yrs out
- Wind 2/10 Low
- Air quality 2/10 Low 1 unhealthy d/yr today · 1 by 30 yrs out
Nearby sold comps map
Loading sold comps map…
Walkable amenities ~0.75 mi
Loading nearby amenities…
Taxation est. · year 1
- Rental income
- $17,343
- − Mortgage interest
- −$8,397
- − Property taxes
- −$1,994
- − Insurance
- −$750
- − Repairs & maintenance
- −$1,387
- − Management
- −$1,387
- − Depreciation
- −$4,361
- Taxable loss
- −$933
- Est. tax savings @ 24.0%
- +$224
- After-tax cash flow
- $1,748/yr
For passive investors: Depreciation is non-cash, so a rental often shows a tax loss while cash-flowing — sheltering income. Rental losses are passive: they offset passive income freely, and up to $25,000/yr can offset ordinary (W-2) income if you actively participate and your MAGI is under $100k (phasing out to $0 by $150k); unused losses carry forward. On sale, claimed depreciation is recaptured at up to 25%, and gains may owe capital-gains tax (a 1031 exchange can defer both). Figures are a year-1 estimate at your 24.0% rate — not tax advice; consult a CPA.
Schools (NCES district)
- District
- Oskaloosa Community School District
- NCES district ID
- 1921870
- Math proficiency
- 62% ▼ -4.00%
- Reading proficiency
- 67% ▬ 0.00%
- Median HH income
- $44,362
- Composite
- 54.26/100
- National rank
- #1373
- State rank
- #208 of 289 in IA
Livability — Oskaloosa
- Score
- 81/100
- State rank
- #57
- US rank
- #1325
Category grades
Schools grade is shown separately in the Schools card above.
Census & demographics
- Census place
- Oskaloosa, IA
- Population (ZIP)
- 14,336
Population outlook (Mahaska County) Hauer SSP2
- Today (2025)
- 22,032 people
- By 2030
- 21,682 · -1.6%
- By 2040
- 20,750 · -5.8%
- By 2050
- 19,800 · -10.1%
- By 2075
- 17,839 · -19.0%
- By 2100
- 15,829 · -28.2%
Race, ethnicity, and origin ACS 2023
- Neighborhood character
- Predominantly White (92%)
- Race & ethnicity
- White 92% Two or more races 3% Hispanic / Latino 2% Black 2% Asian 1%
- Common ancestry
- Iranian 8% Italian 3% Portuguese 2%
- Foreign-born
- 2%
- Languages at home
- 97% English-only · Other Asian/Pacific 1% Spanish 1%
Political lean MEDSL · Mahaska
- 2024 margin
- Solid R (+51.6) · D 23.6% · R 75.2% · Other 1.1%
- 2008→2024 swing
- -35.1pp toward R · 2008: -16.5pp · 2024: -51.6pp
- All cycles
- 2024: R+51.6 2020: R+47.4 2016: R+45.7 2012: R+20.5 2008: R+16.5
Not yet ingested
- Civics
- —
Market trends
- HPI YoY
- ▼ -81.78%
- Current HPI
- 239.9131
- Rent YoY
- —
- Metro
- —
- State GDP YoY
- ▲ 2.48%
- F500 in state
- 4
Industry mix (Fortune 500 HQ in IA)
| Industry | F500 HQs | Revenue |
|---|---|---|
| Financial Services | 1 | $16B |
|
||
| Retail / Convenience | 1 | $15B |
|
||
Price history
+38.8% since first listed7 events — show timeline
- 2026-06-14 Price Changed $149,900 IAR
- 2026-05-29 Relisted — IAR
- 2026-05-16 Contingent — IAR
- 2026-05-07 Listed $154,000 IAR
- 2022-07-29 Sold (Public Records) $109,000 Public Records
- 2022-07-28 Sold (MLS) $109,000 IAR
- 2022-06-16 Listed $108,000 IAR
Property tax history
+2.7%/yrLatest (2025): $1,994 · +0.9% YoY. Source: county tax records.
Cash-flow waterfall
monthlySold comps — $/sqft
last 12 mo · ≤1 miLoading sold comps…