2444 NW 55th Ter · Lauderhill, FL
Flood risk 1/10 · Minimal
- FEMA flood zone
- X (shaded)
- Chance of flooding over 30 yrs
- 0.0%
- Est. flood insurance / yr
- $507 – $1,088
Fire risk 1/10 · Minimal
- Est. fire insurance / yr
- $947 – $1,759
Heat risk 10/10 · Severe
- Hot days now (above 105°F)
- 7 days/yr
- Hot days in 30 yrs
- 27 days/yr
Wind risk 10/10 · Severe
- Chance of severe wind over 30 yrs
- 99.0%
Air-quality risk 3/10 · Minor
- Unhealthy air days now
- 3 days/yr
- Unhealthy air days in 30 yrs
- 3 days/yr
Risk factors via First Street. Map © Google.
Why this score? — see what drove the C- grade
The composite is a weighted blend of 9 inputs, each scored 0–100. Each bar is that input's sub-score; the figure is the points it added to the 100-point composite (weight × sub-score).
- Cash flow +19.6/30.0
- ARV discount +7.5/15.0
- DSCR +6.2/10.0
- 1% rule +5.5/10.0
- Schools +4.1/10.0
- Livability +4.0/5.0
- Rent growth +2.6/5.0
- Condition / age +2.5/5.0
- Appreciation +0.0/10.0
$182,000
🖨 Deal sheet 📄 Offer letter ✓ Due diligence
Listing remarks
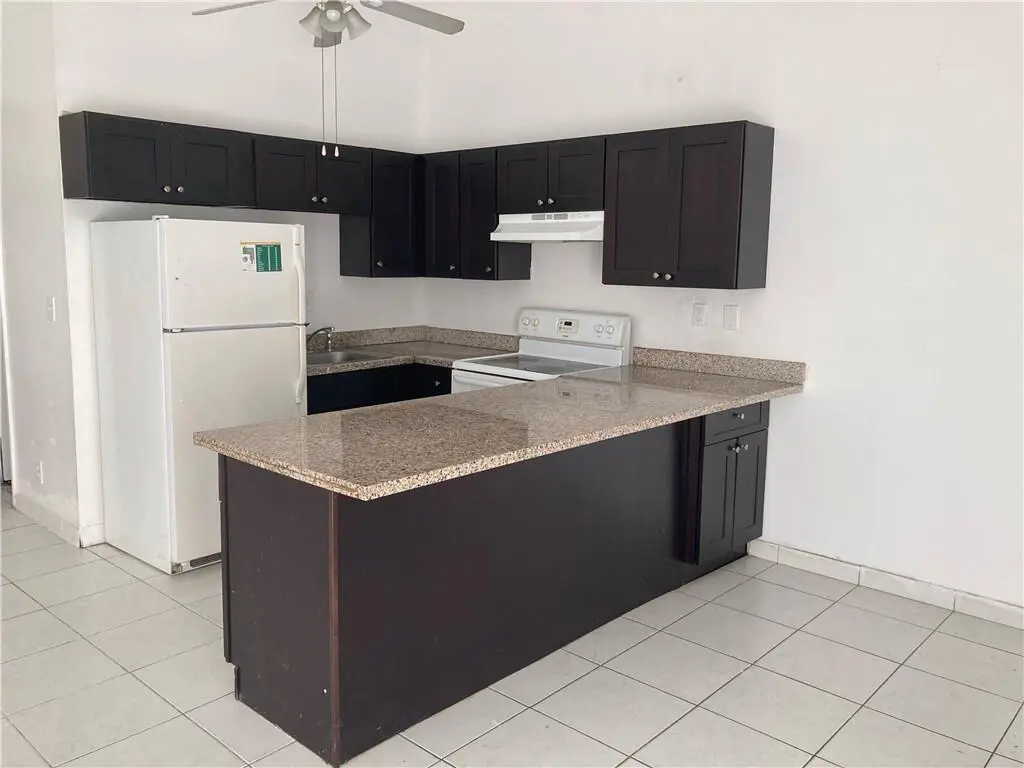
Welcome to this charming 2-bedroom, 1-bathroom townhouse located in Orchard Lake Town Houses in Lauderhill, FL. This single-story residence offers 849 square feet of finished living space, providing an efficient and comfortable layout. The thoughtful design maximizes functionality within the townhouse format, making it an excellent option for those seeking practical living accommodations. Situated in the Orchard Lake Town Houses community, this property presents an accessible choice for buyers looking to invest in Lauderhill's residential market.
Key facts
- $86 HOA
- Parking
- Built 1983
Property features AI
Finance
- Financial info: Pets allowed with breed restrictions
- HOA & community: HOA with $86 monthly fee; HOA covers grounds maintenance, structure maintenance, and common areas; Association reports no additional amenities
Exterior
- Parking: Assigned parking; Guest parking (total 1 parking space)
- Utilities: Public water; Public sewer; Sewer and water available
- Home design: Townhouse; One story; West-facing; Resale property
- Construction: CBS construction; Tile roof; Built using assessor records
- Exterior features: Back yard fencing; Not waterfront
Interior
- Kitchen: Electric range; Microwave; Refrigerator
- Bedrooms: 1 bedroom on the main level
- Flooring: Tile
- Bathrooms: 1 full bathroom
- Heating & cooling: Central heating; Central air; Ceiling fan(s)
- Interior features: Tile flooring; Electric range, Microwave, Refrigerator
- Laundry & utility: In-unit laundry
Neighborhood map
What this means for you Summary
Snapshot
- This is a 2-bed/1.5-bath townhouse listed at $182k.
Deal economics
- At list price, monthly cash flow is $210 ($3k/yr) — positive.
- The deal already cash-flows at list — no discount required.
- Meets the 1% rule at list price ($2k rent vs $182k).
- Cap rate 7.7% vs local median 4.3% in Lauderhill — top-decile yield for the area; either an underpriced asset or a hidden risk that comps aren't pricing in. Stress-test before assuming the spread holds.
Location & tenants
- Location reads 79/100 on livability (#139 in FL, #2,059 nationally) — a middle-class / working-renter tenant base. Strengths: commute A+, cost of living A+, housing A+; Watch: employment D, amenities F.
- Broward (suburban): math 42% / reading 53% proficiency, ranked #46 of 73 in FL (top 63%) — families likely to look elsewhere, expect single-tenant / working-renter base with shorter leases.
- Zoned schools: Endeavour Primary Learning Center (math 15% / reading 17%, grade F, #2,130 of 2,144 statewide, top 99%, 332 students, 90% FRL); Boyd H. Anderson High School (math 10% / reading 14%, grade F, #622 of 667 statewide, top 93%, 2,038 students, 72% FRL) — zoned schools average 81% FRL vs 51% district-wide (30 pts higher); higher-poverty schools than district average — tighter screening recommended.
- Zoned-school proficiency averages 14% at this address vs 48% district-wide (-34 pts) — the specific schools serving this property underperform the Broward average; the district grade overstates school quality for this exact location.
- Market conditions: Rents flat; 656 active listings in the ZIP; 40 comparable units currently listed for rent nearby; rentals at typical pace (median 21d on market — plan ~3-4 weeks tenant-placement turnaround); 2,111 units permitted in Broward County in 2024 (1,265 in 5+ unit buildings).
- At $1,905/mo this rent would consume 49% of the median local household income ($46k/yr) (locally 5692% of renters already pay >50% of income on rent) — very limited rent-growth headroom before tenants either downsize or default.
Forward outlook
- Local home prices are declining (-3.0%/yr); year-one equity from $1k of loan paydown is wiped out by about $5k of value loss. Plan a longer hold.
- Broward County population projected at +34% by 2050 — long-run rental-demand tailwind backs the buy-and-hold thesis.
Negotiation context
- Only 14 days on market — expect competitive offers; lowballing is unlikely to land.
- Current owner paid $119k; list at $182k implies a 53% gain — meaningful room to come down on a strong offer.
Risks & watch-outs
- Climate carrying-cost: severe wind risk, 99% chance of damaging wind over 30y; extreme-heat days projected 7→27/yr by 2055 (HVAC capex compounding) — expect insurance premiums to compound above CPI over the hold.
Questions for the listing agent
- What does the HOA fee cover, when was the last increase, and are there any pending special assessments or reserve-fund shortfalls?
- Is there a deadline driving the sale (1031 exchange, divorce, estate, relocation)? That informs how much negotiation room exists.
- Schools are D-rated, which usually means shorter tenancies and higher turnover. Who's the typical renter profile here, and what's been the actual vacancy rate?
- What's the average days-on-market for RENTAL listings here right now (not sales)? A rising rental-DOM trend means longer vacancies and softer asking-rent achievability than the comps imply.
- What's the recent tenant-quality profile in this submarket — average credit score on applications, eviction rate, late-payment / NSF rate, and stable-employment percentage? A property-management company in the area should have these aggregated.
- How much new for-sale + rental construction is in the pipeline within 1–3 miles? Heavy new supply typically softens prices + rents 12–24 months out; constrained supply supports both.
Investment metrics
- 1% rule
- 1.05% ✓
- Cap rate
- 7.68%
- Cash-on-cash
- 4.94%
- DSCR
- 1.22
- GRM
- 8.0
CMA / ARV
- ARV (on-the-fly)
- $99,333
- Comps found
- 8
Show comp detail 8 sales within ~0.75 mi
| Address | Dist | Beds/Ba | Sqft | Sold | Price | $/sf | Match |
|---|---|---|---|---|---|---|---|
| 2401 NW 56th Ave Unit 3-103 | 0.23mi | 2/2.0 | 855 (+1%) | 10mo | $117,000 | $137 | 77 |
| 2820 NW 55th Ave Unit 1D | 0.23mi | 1/1.5 (-1) | 840 (-1%) | 7mo | $130,000 | $155 | 77 |
| 2998 NW 48th Ter #220 | 0.61mi | 2/2.0 | 960 (+13%) | 3mo | $140,000 | $146 | 46 |
| 2881 NW 47th Ter #103 | 0.72mi | 1/1.0 (-1) | 768 (-10%) | 1mo | $70,000 | $91 | 42 |
| 2999 NW 48th Ave #142 | 0.70mi | 2/2.0 | 960 (+13%) | 2mo | $110,000 | $115 | 42 |
| 3070 NW 48th Ter #415 | 0.67mi | 2/2.0 | 960 (+13%) | 8mo | $69,000 | $72 | 39 |
| 4750 NW 22nd Ct #217 | 0.65mi | 1/1.5 (-1) | 928 (+9%) | 23mo | $100,000 | $108 | 30 |
| 4751 NW 21st St #501 | 0.69mi | 1/1.5 (-1) | 928 (+9%) | 23mo | $108,900 | $117 | 28 |
Match score weights: distance 35% · size 25% · config 20% · recency 20%. Top-matched comps best support the ARV.
Projected returns pro-forma
-3.0% appreciation · 0.26% rent growth · sell at horizon
- IRR
- -11.8%
- Equity multiple
- 0.58×
- Total profit
- $-21,188
- Equity at exit
- $27,137
- IRR
- -7.4%
- Equity multiple
- 0.59×
- Total profit
- $-20,888
- Equity at exit
- $15,736
Cash invested: $50,960 (down + closing). Projections, not guarantees.
Landlord ↔ Tenant lean methodology
- Overall (STATE)
- 87 Strongly Landlord-Friendly
- State Florida
- 87 Strongly Landlord-Friendly · R+3
- County
- — inherits STATE
- City
- — inherits STATE
ZIP-level market 33313
- Rents YoY
- 0.3%
- Active inventory
- 656
- Price-to-rent
- 8.0×
Monthly cashflow live
- Estimated rent
- $1,905 high interval (Pro) →
- Mortgage (P&I)
- −$954
- Tax from tax record
- −$179 /mo · $2,144/yr
- Insurance
- −$76
- HOA
- −$86
- Vacancy / Maint / Mgmt
- −$400
- Net cashflow
- $210
Break-even live
UW: 25.0% down · 7.5% · 30yr · 1.5% tax · 5.0% vac · 8.0% maint · 8.0% mgmt
Financing live
Cash to close
- Down payment
- $45,500
- Closing costs
- $5,460
- Reserves months
- —
- Total cash needed
- —
Loan-product check · same deal, 3 products live
Conventional
25% down · 7.5% · 30yr
- Down + closing
- —
- Monthly P&I
- —
- Monthly cashflow
- —
- DSCR
- —
- Eligible?
- —
Personal DTI + credit; lowest rate.
DSCR
20% down · 8.5% · 30yr
- Down + closing
- —
- Monthly P&I
- —
- Monthly cashflow
- —
- DSCR
- —
- Eligible?
- —
No personal income docs; deal must DSCR.
Hard money
10% down · 12.0% · 12mo
- Down + closing
- —
- Monthly P&I
- —
- Monthly cashflow
- —
- DSCR
- —
- Eligible?
- —
Short-term bridge; refi at stabilization.
Rent comps 40 comps
| Address | Beds | Baths | Sqft | Rent | $/sqft | DOM | Units | Dist |
|---|---|---|---|---|---|---|---|---|
| 2427 NW 55th Ter Unit 2427 Lauderhill, FL | 2.0 | 1.0 | 849 | $2,400 | $2.83 | 24d | 1 | 0.07mi |
| 5323 NW 24th St #118 Lauderhill, FL | 2.0 | 1.0 | 829 | $1,550 | $1.87 | 24d | 1 | 0.09mi |
| 5405 NW 23rd St #187 Lauderhill, FL | 2.0 | 1.0 | 829 | $1,850 | $2.23 | 4d | 1 | 0.12mi |
| 5314 NW 24th St #143 Lauderhill, FL | 2.0 | 1.0 | 829 | $1,995 | $2.41 | 20d | 1 | 0.13mi |
| 2580 NW 56th Ave Lauderhill, FL | 1.0–2.0 | 1.0–2.0 | 1007 | $2,053 | $2.04 | 1d | 11 | 0.18mi |
| 2410 NW 52nd Ave #2410 Lauderhill, FL | 2.0 | 1.5 | 1020 | $1,700 | $1.67 | 5d | 1 | 0.18mi |
| 2410 NW 52nd Ave #2410 Lauderhill, FL | 2.0 | 1.5 | 1020 | $1,700 | $1.67 | 14d | 1 | 0.18mi |
| 2512 NW 52nd Ave Unit 22B Lauderhill, FL | 2.0 | 1.5 | 940 | $1,700 | $1.81 | 17d | 1 | 0.18mi |
| 2552 NW 52nd Ave Unit B19 Lauderhill, FL | 2.0 | 1.5 | 940 | $1,900 | $2.02 | 4d | 1 | 0.19mi |
| 2306 NW 52nd Ave Lauderhill, FL | 2.0 | 1.5 | 1020 | $1,900 | $1.86 | 17d | 1 | 0.20mi |
| 5411 NW 22nd St Unit 5411 Lauderhill, FL | 2.0 | 1.0 | 850 | $2,050 | $2.41 | 12d | 1 | 0.22mi |
| 5411 NW 22nd St Unit 5411 Lauderhill, FL | 2.0 | 1.0 | 850 | $2,050 | $2.41 | 5d | 1 | 0.22mi |
| 5415 NW 22nd St #5415 Lauderhill, FL | 2.0 | 1.0 | 936 | $2,150 | $2.30 | 24d | 1 | 0.22mi |
| 2604 NW 52nd Ave Unit C15 Lauderhill, FL | 2.0 | 1.5 | 940 | $1,800 | $1.91 | 24d | 1 | 0.22mi |
| 2606 NW 52nd Ave Unit D15 Lauderhill, FL | 2.0 | 1.5 | 1020 | $1,950 | $1.91 | 24d | 1 | 0.22mi |
| 5231 NW 27th St Unit 8A Lauderhill, FL | 2.0 | 1.5 | 1020 | $1,900 | $1.86 | 24d | 1 | 0.23mi |
| 2360 NW 56th Ave Lauderhill, FL | 1.0–3.0 | 1.0–2.0 | 924 | $2,650 | $2.87 | 2d | 22 | 0.23mi |
| 5223 NW 27th St Unit 9B Fort Lauderdale, FL | 2.0 | 1.5 | 940 | $1,750 | $1.86 | 24d | 1 | 0.24mi |
| 2814 NW 55th Ave Unit 1B Lauderhill, FL | 2.0 | 2.0 | 1070 | $1,800 | $1.68 | 24d | 1 | 0.25mi |
| 2571 NW 56th Ave Unit G Lauderhill, FL | 2.0 | 2.0 | 950 | $1,895 | $1.99 | 24d | 1 | 0.27mi |
| 5321 NW 21st Ct Lauderhill, FL | 2.0 | 1.0 | 750 | $1,900 | $2.53 | 24d | 1 | 0.27mi |
| 2810 NW 55th Ave Unit 2A Lauderhill, FL | 2.0 | 2.0 | 1060 | $2,000 | $1.89 | 7d | 1 | 0.28mi |
| 2591 NW 56th Ave Lauderhill, FL | 2.0 | 1.0 | 812 | $1,995 | $2.46 | 24d | 1 | 0.28mi |
| 2561 NW 56th Ave Lauderhill, FL | 2.0 | 1.0 | 812 | $1,925 | $2.37 | 24d | 1 | 0.30mi |
| 2800 NW 56th Ave Lauderhill, FL | 1.0–2.0 | 1.0–2.0 | 847 | $1,850 | $2.18 | 3d | 8 | 0.33mi |
| 2800 NW 56th Ave Lauderhill, FL | 1.0–2.0 | 1.0–2.0 | 847 | $1,850 | $2.18 | 24d | 8 | 0.33mi |
| 2800 NW 56th Ave Lauderhill, FL | 1.0–2.0 | 1.0–2.0 | 847 | $1,850 | $2.18 | 4d | 8 | 0.33mi |
| 2800 NW 56th Ave Lauderhill, FL | 1.0–2.0 | 1.0–2.0 | 847 | $1,850 | $2.18 | 15d | 6 | 0.33mi |
| 2800 NW 56th Ave Lauderhill, FL | 1.0–2.0 | 1.0–2.0 | 847 | $1,850 | $2.18 | 22d | 7 | 0.33mi |
| 2148 NW 57th Ave Unit 14E Lauderhill, FL | 3.0 | 2.0 | 1080 | $2,300 | $2.13 | 24d | 1 | 0.34mi |
| 2101 NW 55th Ave Lauderhill, FL | 2.0 | 2.0 | 900 | $1,949 | $2.17 | 1d | 8 | 0.34mi |
| 2481 NW 56th Ave Unit 6-16 Lauderhill, FL | 1.0 | 1.0 | 745 | $1,600 | $2.15 | 17d | 1 | 0.34mi |
| 2551 NW 56th Ave Unit 1-20 Lauderhill, FL | 2.0 | 2.0 | 1014 | $1,900 | $1.87 | 24d | 1 | 0.34mi |
| 2551 NW 56th Ave Unit 1-20 Lauderhill, FL | 2.0 | 2.0 | 1014 | $1,900 | $1.87 | 10d | 1 | 0.34mi |
| 2982 NW 55th Ave Unit 2C Lauderhill, FL | 1.0 | 1.5 | 840 | $1,600 | $1.90 | 24d | 1 | 0.36mi |
| 2914 NW 55th Ave Lauderhill, FL | 1.0 | 2.0 | 840 | $1,600 | $1.90 | 12d | 1 | 0.36mi |
| 2914 NW 55th Ave Unit 1D Lauderhill, FL | 1.0 | 1.5 | 840 | $1,600 | $1.90 | 17d | 1 | 0.36mi |
| 2481 NW 56th Ave Unit 105 Lauderhill, FL | 1.0 | 1.5 | 800 | $1,400 | $1.75 | 24d | 1 | 0.38mi |
| 2916 NW 55th Ave Unit 2A Lauderhill, FL | 2.0 | 2.0 | 1060 | $2,200 | $2.08 | 7d | 1 | 0.38mi |
| 2900 NW 56th Ave Lauderhill, FL | 1.0–2.0 | 1.0–2.0 | 1030 | $1,975 | $1.92 | 24d | 1 | 0.39mi |
HOA detail
- Monthly dues
- $86 · $1,032/yr
Listing history 9 events
-
2026-06-18days on market $182,000 Active 14 DOM
-
2026-06-17days on market $182,000 Active 13 DOM
-
2026-06-16days on market $182,000 Active 12 DOM
-
2026-06-15days on market $182,000 Active 11 DOM
-
2026-06-13days on market $182,000 Active 9 DOM
-
2026-06-09days on market $182,000 Active 5 DOM
-
2026-06-08days on market $182,000 Active 4 DOM
-
2026-06-07remarks 552-char remark
-
2026-06-07$182,000 Active 3 DOM
ⓘ Source: listings_history table (triggers on properties + properties_extension) + one-shot
backfill from property_details.listing_events for pre-trigger history.
Tax reassessment forecast FL · Resets to sale price
- Current annual tax
- $2,144 · $179/mo
- Projected year-2 tax
- $2,144 · $179/mo
- Expected delta
- $0/yr ($0/mo · 0.0%)
ⓘ Screening estimate from a state-policy table — verify with the county assessor before closing.
Climate risk First Street
- Flood 1/10 Low FEMA zone X (shaded) · 0% chance over 30 yrs
- Wildfire 1/10 Low
- Heat 10/10 Extreme 7 d/yr ≥105°F today · 27 d/yr by 30 yrs out
- Wind 10/10 Extreme 99% chance of damaging wind over 30 yrs
- Air quality 3/10 Moderate 3 unhealthy d/yr today · 3 by 30 yrs out
Nearby sold comps map
Loading sold comps map…
Walkable amenities ~0.75 mi
Loading nearby amenities…
Taxation est. · year 1
- Rental income
- $22,857
- − Mortgage interest
- −$10,195
- − Property taxes
- −$2,144
- − Insurance
- −$910
- − Repairs & maintenance
- −$1,829
- − Management
- −$1,829
- − HOA
- −$1,032
- − Depreciation
- −$5,295
- Taxable loss
- −$376
- Est. tax savings @ 24.0%
- +$90
- After-tax cash flow
- $2,608/yr
For passive investors: Depreciation is non-cash, so a rental often shows a tax loss while cash-flowing — sheltering income. Rental losses are passive: they offset passive income freely, and up to $25,000/yr can offset ordinary (W-2) income if you actively participate and your MAGI is under $100k (phasing out to $0 by $150k); unused losses carry forward. On sale, claimed depreciation is recaptured at up to 25%, and gains may owe capital-gains tax (a 1031 exchange can defer both). Figures are a year-1 estimate at your 24.0% rate — not tax advice; consult a CPA.
Schools (NCES district)
- District
- Broward
- NCES district ID
- 1200180
- Math proficiency
- 42% ▼ -18.00%
- Reading proficiency
- 53% ▼ -5.00%
- Median HH income
- $52,139
- Composite
- 40.88/100
- National rank
- #3621
- State rank
- #46 of 73 in FL
Livability — Lauderhill
- Score
- 79/100
- State rank
- #139
- US rank
- #2059
Category grades
Schools grade is shown separately in the Schools card above.
Census & demographics
- Census place
- Lauderhill, FL
- County
- Broward County · 1,963,430 people
- City population
- 62,807
- Metro
- Miami-Fort Lauderdale-Pompano Beach, FL
- Population (ZIP)
- 62,807
- Household income
- $46,305
- Rent vs Own
- Severe rent burden
- 5692.0
Population outlook (Broward County) Hauer SSP2
- Today (2025)
- 2,207,033 people
- By 2030
- 2,360,704 · +7.0%
- By 2040
- 2,661,208 · +20.6%
- By 2050
- 2,946,698 · +33.5%
- By 2075
- 3,602,273 · +63.2%
- By 2100
- 3,970,984 · +79.9%
Race, ethnicity, and origin ACS 2023
- Neighborhood character
- Predominantly Black (77%)
- Race & ethnicity
- Black 77% Hispanic / Latino 12% Two or more races 8% White 7% Asian 2%
- Hispanic origin (detail)
- Puerto Rican 2% Cuban 3% Dominican 1%
- Common ancestry
- Hispanic 20%
- Foreign-born
- 39% · Canada, Jamaica, Dominican Republic
- Languages at home
- 66% English-only · French/Haitian/Cajun 22% Spanish 10%
Political lean MEDSL · Broward
- 2024 margin
- D (+17.0) · D 58.0% · R 41.0%
- 2008→2024 swing
- -17.8pp toward R · 2008: 34.7pp · 2024: 17.0pp
- All cycles
- 2024: D+17.0 2020: D+29.8 2016: D+35.0 2012: D+34.9 2008: D+34.7
Not yet ingested
- Civics
- —
Market trends
- HPI YoY
- ▼ -338.15%
- Current HPI
- 288.9345
- Rent YoY
- ▲ 0.26%
- Metro
- Miami-Fort Lauderdale-Pompano Beach, FL
- State GDP YoY
- ▲ 3.28%
- F500 in state
- 36
Industry mix (Fortune 500 HQ in FL)
| Industry | F500 HQs | Revenue |
|---|---|---|
| Industrial Technology | 2 | $29B |
|
||
| Insurance | 2 | $17B |
|
||
| Retail | 1 | $60B |
|
||
| Technology Distribution | 1 | $58B |
|
||
| Homebuilding | 1 | $35B |
|
||
| Technology Manufacturing | 1 | $35B |
|
||
Price history
+576.6% since first listed7 events — show timeline
- 2026-06-04 Listed $182,000 Beaches MLS
- 2020-11-23 Sold (Public Records) $119,000 Public Records
- 2007-01-26 Sold (Public Records) $105,000 Public Records
- 1994-10-14 Sold (Public Records) $37,000 Public Records
- 1994-01-26 Sold (Public Records) $28,000 Public Records
- 1988-02-01 Sold (Public Records) $43,000 Public Records
- 1988-02-01 Sold (Public Records) $26,900 Public Records
Property tax history
+8.0%/yrLatest (2025): $2,144 · +1.1% YoY. Source: county tax records.
Cash-flow waterfall
monthlySold comps — $/sqft
last 12 mo · ≤1 miLoading sold comps…