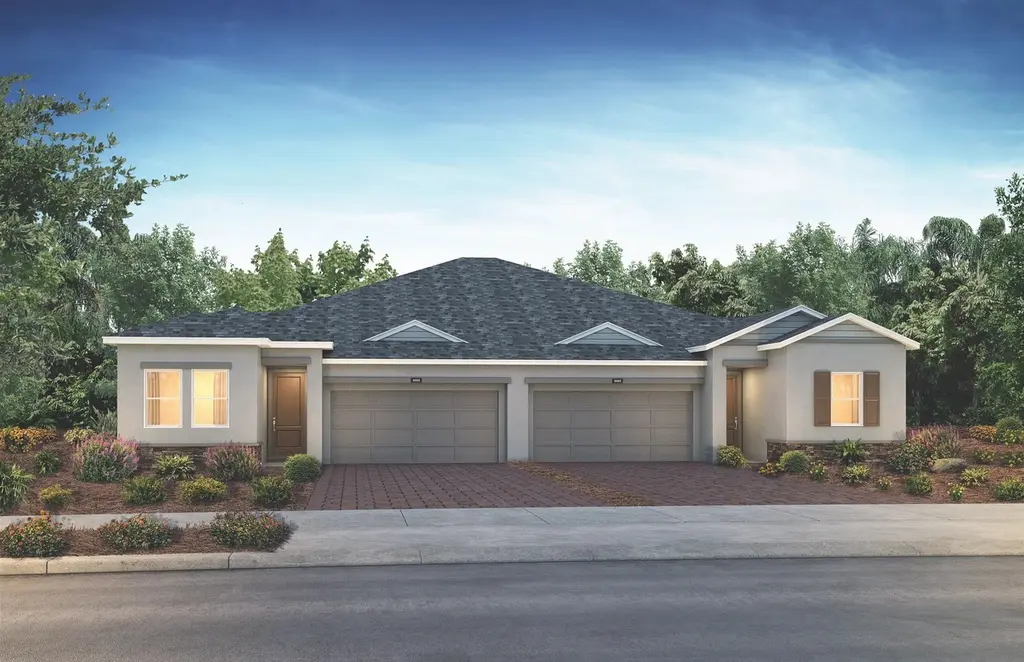
3227 NW 52nd Avenue Rd · Ocala, FL
Flood risk No data
- FEMA flood zone
- —
- Chance of flooding over 30 yrs
- —
- Est. flood insurance / yr
- —
Fire risk No data
- Est. fire insurance / yr
- —
Heat risk No data
- Hot days now (above threshold)
- —
- Hot days in 30 yrs
- —
Wind risk No data
- Chance of severe wind over 30 yrs
- —
Air-quality risk No data
- Unhealthy air days now
- —
- Unhealthy air days in 30 yrs
- —
Risk factors via First Street. Map © Google.
Why this score? — see what drove the C- grade
The composite is a weighted blend of 9 inputs, each scored 0–100. Each bar is that input's sub-score; the figure is the points it added to the 100-point composite (weight × sub-score).
- Cash flow +21.9/30.0
- DSCR +7.0/10.0
- Rent growth +5.0/5.0
- 1% rule +4.5/10.0
- ARV discount +4.4/15.0
- Condition / age +4.0/5.0
- Schools +3.6/10.0
- Livability +3.5/5.0
- Appreciation +0.0/10.0
$249,990
🖨 Deal sheet 📄 Offer letter ✓ Due diligence
Listing remarks MLS
55+ Home , Home Includes over $52,000 in Upgrades, Upgraded Stone on Front Exterior, Stainless Steel Appliance Package, Whirlpool Refrigerator , Laundry Package, Cabinet Package with 36" Uppers , 2" Crown on Cabinets with Soft-Close Drawers, Stunning Silestone Countertops with Tile Backsplash , Upgraded Kitchen Sink & Faucet, Silestone Countertops at Baths, Upgraded Door Trim & Plumbing Package, Upgraded Interior Door Package, French Doors at Den, Ceiling Fans, Additional LED Lighting , Upgraded Flooring Throughout, Tile Surround at Primary Shower , Window Blinds Throughout
Key facts
- Laundry package
- Faucet
- 2 garage spots
Tags
Neighborhood map
What this means for you Summary
Snapshot
- This is a 2-bed/2.5-bath single-family listed at $250k. Condition is rated good.
Deal economics
- At list price, monthly cash flow is $392 ($5k/yr) — positive.
- The deal already cash-flows at list — no discount required.
- To meet the 1% rule (rent ≥ 1% of price), the offer needs to be $237k (5.2% below list).
- Recommended offer: $220k (12.0% below list) — sets the bar for market timing.
- Cap rate 8.2% vs local median 4.2% in Ocala — top-decile yield for the area; either an underpriced asset or a hidden risk that comps aren't pricing in. Stress-test before assuming the spread holds.
Location & tenants
- Location reads 69/100 on livability (#476 in FL) — a middle-class / working-renter tenant base. Strengths: cost of living A+, housing A+, health & safety A+; Watch: crime F, amenities F, commute F.
- Marion (rural): math 42% / reading 43% proficiency, ranked #61 of 73 in FL (top 84%) — families likely to look elsewhere, expect single-tenant / working-renter base with shorter leases; 61% free/reduced lunch — lower-income household profile, screen leases tightly.
- Market conditions: Rents rising fast (+11.1%/yr); 663 active listings in the ZIP; 36 comparable units currently listed for rent nearby; rentals at typical pace (median 21d on market — plan ~3-4 weeks tenant-placement turnaround); 7,071 units permitted in Marion County in 2024 (534 in 5+ unit buildings).
- This rent runs 43% of the median local income ($66k/yr) — at the standard rent-burdened threshold; future hikes will face affordability resistance.
Forward outlook
- Local home prices are declining (-3.0%/yr); year-one equity from $2k of loan paydown is wiped out by about $8k of value loss. Plan a longer hold.
- Marion County population projected at +13% by 2050 — modest demand growth; plan on rents tracking national, not racing it.
- At projected returns (-3.0% appreciation + 8.0% rent growth), your $70k cash investment doubles in ~9 years — after that, you're playing with house money.
Negotiation context
- It's been on market 223 days — a 12% lower offer ($220k) is reasonable based on typical stale-listing flexibility.
Questions for the listing agent
- It's been on market 223 days. Have you received any prior offers? Is the seller open to a 12% concession, seller financing, or rate buy-down credit?
- Why hasn't it sold? Are there any deal-killer items the seller is aware of (foundation, flood, title, zoning, code violations)?
- Is there a deadline driving the sale (1031 exchange, divorce, estate, relocation)? That informs how much negotiation room exists.
- Crime grade is F in this area — have there been break-ins, vandalism, or insurance claims at this property in the last 3 years? What carrier currently insures it and at what premium?
- What's the average days-on-market for RENTAL listings here right now (not sales)? A rising rental-DOM trend means longer vacancies and softer asking-rent achievability than the comps imply.
- What's the recent tenant-quality profile in this submarket — average credit score on applications, eviction rate, late-payment / NSF rate, and stable-employment percentage? A property-management company in the area should have these aggregated.
- How much new for-sale + rental construction is in the pipeline within 1–3 miles? Heavy new supply typically softens prices + rents 12–24 months out; constrained supply supports both.
Investment metrics
- 1% rule
- 0.95% ✗
- Cap rate
- 8.17%
- Cash-on-cash
- 6.71%
- DSCR
- 1.30
- GRM
- 8.8
CMA / ARV
- ARV (median comp)
- $233,885
- List price
- $249,990
- Delta
- 6.89%
- Verdict
- FAIR
- Comps
- 1 within 2.0 mi
Show comp detail 12 sales within ~0.75 mi
| Address | Dist | Beds/Ba | Sqft | Sold | Price | $/sf | Match |
|---|---|---|---|---|---|---|---|
| 3901 NW 49th Ct | 0.49mi | 2/2.0 | 1,666 (-3%) | 20mo | $315,000 | $189 | 54 |
| 4802 NW 39th Street Rd | 0.61mi | 2/2.0 | 1,565 (-9%) | 1mo | $256,150 | $164 | 54 |
| 4811 NW 39th Pl | 0.60mi | 3/2.0 (+1) | 1,844 (+7%) | 2mo | $317,665 | $172 | 51 |
| 5160 NW 25th Loop | 0.57mi | 2/2.0 | 1,569 (-9%) | 8mo | $237,500 | $151 | 50 |
| 4998 NW 30th Pl | 0.34mi | 3/2.0 (+1) | 1,476 (-14%) | 9mo | $259,000 | $175 | 46 |
| 5654 NW 37th Lane Rd | 0.57mi | 2/2.0 | 1,956 (+14%) | 4mo | $440,000 | $225 | 45 |
| 4487 NW 53rd Ave | 0.55mi | 3/2.5 (+1) | 1,894 (+10%) | 13mo | $467,990 | $247 | 42 |
| 5405 NW 25th Loop | 0.55mi | 2/2.0 | 1,590 (-8%) | 22mo | $275,000 | $173 | 42 |
| 5520 NW 26th Ln | 0.56mi | 3/2.0 (+1) | 1,526 (-11%) | 8mo | $215,000 | $141 | 41 |
| 2570 NW 55th Avenue Rd | 0.68mi | 2/2.0 | 1,914 (+11%) | 10mo | $297,500 | $155 | 40 |
| 4936 NW 39th Loop | 0.54mi | 3/2.0 (+1) | 1,844 (+7%) | 22mo | $322,205 | $175 | 38 |
| 2439 NW 55th Avenue Rd | 0.73mi | 3/2.0 (+1) | 1,514 (-12%) | 17mo | $240,000 | $159 | 25 |
Match score weights: distance 35% · size 25% · config 20% · recency 20%. Top-matched comps best support the ARV.
Projected returns pro-forma
-3.0% appreciation · 8.0% rent growth · sell at horizon
- IRR
- -1.1%
- Equity multiple
- 0.95×
- Total profit
- $-3,157
- Equity at exit
- $37,274
- IRR
- 12.8%
- Equity multiple
- 2.23×
- Total profit
- $85,910
- Equity at exit
- $21,615
Cash invested: $69,997 (down + closing). Projections, not guarantees.
Landlord ↔ Tenant lean methodology
- Overall (STATE)
- 87 Strongly Landlord-Friendly
- State Florida
- 87 Strongly Landlord-Friendly · R+3
- County
- — inherits STATE
- City
- — inherits STATE
ZIP-level market 34482
- Rents YoY
- 11.1%
- Active inventory
- 663
- Price-to-rent
- 8.8×
Monthly cashflow live
- Estimated rent
- $2,370 high interval (Pro) →
- Mortgage (P&I)
- −$1,311
- Tax from tax record
- −$66 /mo · $790/yr
- Insurance
- −$104
- HOA
- −$0
- Vacancy / Maint / Mgmt
- −$498
- Net cashflow
- $392
Break-even live
UW: 25.0% down · 7.5% · 30yr · 1.5% tax · 5.0% vac · 8.0% maint · 8.0% mgmt
Financing live
Cash to close
- Down payment
- $62,498
- Closing costs
- $7,500
- Reserves months
- —
- Total cash needed
- —
Loan-product check · same deal, 3 products live
Conventional
25% down · 7.5% · 30yr
- Down + closing
- —
- Monthly P&I
- —
- Monthly cashflow
- —
- DSCR
- —
- Eligible?
- —
Personal DTI + credit; lowest rate.
DSCR
20% down · 8.5% · 30yr
- Down + closing
- —
- Monthly P&I
- —
- Monthly cashflow
- —
- DSCR
- —
- Eligible?
- —
No personal income docs; deal must DSCR.
Hard money
10% down · 12.0% · 12mo
- Down + closing
- —
- Monthly P&I
- —
- Monthly cashflow
- —
- DSCR
- —
- Eligible?
- —
Short-term bridge; refi at stabilization.
Rent comps 36 comps
| Address | Beds | Baths | Sqft | Rent | $/sqft | DOM | Units | Dist |
|---|---|---|---|---|---|---|---|---|
| 5333 NW 33rd Pl Ocala, FL | 2.0 | 2.0 | 1368 | $2,300 | $1.68 | 14d | 1 | 0.06mi |
| 3335 NW 52nd Avenue Rd Ocala, FL | 2.0 | 2.5 | 1318 | $2,500 | $1.90 | 21d | 1 | 0.06mi |
| 5361 NW 33rd Pl Ocala, FL | 2.0 | 2.0 | 1318 | $2,500 | $1.90 | 21d | 1 | 0.07mi |
| 5191 NW 34th St Ocala, FL | 2.0 | 2.0 | 1318 | $2,400 | $1.82 | 21d | 1 | 0.09mi |
| 3384 NW 54th Ct Ocala, FL | 2.0 | 2.5 | 1722 | $2,300 | $1.34 | 21d | 1 | 0.16mi |
| 5471 NW 34th St Ocala, FL | 2.0 | 2.0 | 1318 | $2,900 | $2.20 | 21d | 1 | 0.17mi |
| 5048 NW 35th St Ocala, FL | 3.0 | 2.0 | 1552 | $1,900 | $1.22 | 14d | 1 | 0.20mi |
| 5423 NW 35th Lane Rd Ocala, FL | 2.0 | 2.0 | 1656 | $3,200 | $1.93 | 21d | 1 | 0.21mi |
| 5353 N US Highway 27 Ocala, FL | 1.0–3.0 | 1.0–2.0 | 1169 | $1,785 | $1.53 | 21d | 1 | 0.24mi |
| 4859 NW 35th Lane Rd Ocala, FL | 2.0 | 2.0 | 1666 | $2,495 | $1.50 | 21d | 1 | 0.50mi |
| 4122 NW 48th Terrace Rd Ocala, FL | 2.0 | 2.0 | 1816 | $1,999 | $1.10 | 14d | 1 | 0.59mi |
| 5530 NW 40th Loop Ocala, FL | 3.0 | 2.0 | 1622 | $2,000 | $1.23 | 21d | 1 | 0.64mi |
| 4743 NW 39th Street Rd Ocala, FL | 3.0 | 2.0 | 1565 | $2,500 | $1.60 | 21d | 1 | 0.66mi |
| 4342 NW 55th Ct Ocala, FL | 3.0 | 2.5 | 2172 | $2,600 | $1.20 | 14d | 1 | 0.75mi |
| 4110 NW 44th Cir Ocala, FL | 3.0 | 2.0 | 1610 | $2,400 | $1.49 | 14d | 1 | 0.76mi |
| 4111 NW 44th Cir Ocala, FL | 3.0 | 2.0 | 1505 | $2,300 | $1.53 | 14d | 1 | 0.78mi |
| 4395 NW 55th Ter Ocala, FL | 3.0 | 2.0 | 1853 | $2,700 | $1.46 | 21d | 1 | 0.80mi |
| 4078 NW 44th Cir Ocala, FL | 3.0 | 2.0 | 1504 | $2,500 | $1.66 | 21d | 1 | 0.81mi |
| 5521 NW 45th Ln Ocala, FL | 3.0 | 2.0 | 1862 | $2,600 | $1.40 | 14d | 1 | 0.94mi |
| 5254 NW 43rd Lane Rd Ocala, FL | 3.0 | 2.0 | 1728 | $3,500 | $2.03 | 21d | 1 | 0.96mi |
| 5347 NW 46th Lane Rd Ocala, FL | 3.0 | 2.0 | 1552 | $2,550 | $1.64 | 21d | 1 | 0.97mi |
| 5416 NW 46th Lane Rd Ocala, FL | 3.0 | 2.0 | 1590 | $2,300 | $1.45 | 14d | 1 | 1.00mi |
| 2048 NW 50th Ave Ocala, FL | 2.0 | 2.0 | 1062 | $2,250 | $2.12 | 21d | 1 | 1.02mi |
| 2038 NW 50th Ave Ocala, FL | 2.0 | 2.0 | 1062 | $2,250 | $2.12 | 21d | 1 | 1.03mi |
| 2028 NW 50th Ave Ocala, FL | 2.0 | 2.0 | 1066 | $1,595 | $1.50 | 21d | 1 | 1.03mi |
| 5358 NW 48th Pl Ocala, FL | 3.0 | 2.0 | 1565 | $2,500 | $1.60 | 21d | 1 | 1.05mi |
| 1918 NW 50th Cir Ocala, FL | 2.0 | 2.0 | 1061 | $2,200 | $2.07 | 21d | 1 | 1.05mi |
| 5375 NW 48th Pl Ocala, FL | 2.0 | 2.0 | 1565 | $2,350 | $1.50 | 21d | 1 | 1.07mi |
| 5389 NW 48th Pl Ocala, FL | 2.0 | 2.0 | 1552 | $2,300 | $1.48 | 21d | 1 | 1.07mi |
| 5237 NW 48th Pl Ocala, FL | 3.0 | 2.0 | 1552 | $4,500 | $2.90 | 21d | 1 | 1.08mi |
| 5293 NW 48th Pl Ocala, FL | 2.0 | 2.0 | 1552 | $2,450 | $1.58 | 21d | 1 | 1.08mi |
| 5399 NW 18th St Ocala, FL | 2.0 | 2.0 | 1085 | $2,100 | $1.94 | 21d | 1 | 1.17mi |
| 5399 NW 18th St Ocala, FL | 2.0 | 2.0 | 1085 | $2,100 | $1.94 | 14d | 1 | 1.17mi |
| 4530 NW 14th Loop Ocala, FL | 3.0 | 2.5 | 1966 | $2,250 | $1.14 | 14d | 1 | 1.39mi |
| 5391 NW 55th Ct Ocala, FL | 3.0 | 2.0 | 1332 | $1,650 | $1.24 | 21d | 1 | 1.48mi |
| 1527 NW 57th Ct Unit 1 Ocala, FL | 3.0 | 2.0 | 1460 | $1,550 | $1.06 | 21d | 1 | 1.49mi |
Listing history 17 events
-
2026-06-18days on market $249,990 Active 223 DOM
-
2026-06-17days on market $249,990 Active 222 DOM
-
2026-06-16days on market $249,990 Active 221 DOM
-
2026-06-15days on market $249,990 Active 220 DOM
-
2026-06-14days on market $249,990 Active 218 DOM
-
2026-06-13days on market $249,990 Active 217 DOM
-
2026-06-10days on market $249,990 Active 215 DOM
-
2026-06-09days on market $249,990 Active 214 DOM
-
2026-06-08days on market $249,990 Active 213 DOM
-
2026-06-07days on market $249,990 Active 212 DOM
-
2026-06-03days on market $249,990 Active 208 DOM
-
2026-06-02days on market $249,990 Active 207 DOM
-
2026-05-31days on market $249,990 Active 205 DOM
-
2026-05-30days on market $249,990 Active 204 DOM
-
2026-05-01price $249,990 602-char remark
Show marketing remark (602 chars)
55+ Home , Home Includes over $52,000 in Upgrades, Upgraded Stone on Front Exterior, Stainless Steel Appliance Package, Whirlpool Refrigerator , Laundry Package, Cabinet Package with 36" Uppers , 2" Crown on Cabinets with Soft-Close Drawers, Stunning Silestone Countertops with Tile Backsplash , Upgraded Kitchen Sink & Faucet, Silestone Countertops at Baths, Upgraded Door Trim & Plumbing Package, Upgraded Interior Door Package, French Doors at Den, Ceiling Fans, Additional LED Lighting , Upgraded Flooring Throughout, Tile Surround at Primary Shower , Window Blinds Throughout
-
2026-04-01price $262,120 602-char remark
Show marketing remark (602 chars)
55+ Home , Home Includes over $52,000 in Upgrades, Upgraded Stone on Front Exterior, Stainless Steel Appliance Package, Whirlpool Refrigerator , Laundry Package, Cabinet Package with 36" Uppers , 2" Crown on Cabinets with Soft-Close Drawers, Stunning Silestone Countertops with Tile Backsplash , Upgraded Kitchen Sink & Faucet, Silestone Countertops at Baths, Upgraded Door Trim & Plumbing Package, Upgraded Interior Door Package, French Doors at Den, Ceiling Fans, Additional LED Lighting , Upgraded Flooring Throughout, Tile Surround at Primary Shower , Window Blinds Throughout
-
2025-11-07$272,120 Active 602-char remark
Show marketing remark (602 chars)
55+ Home , Home Includes over $52,000 in Upgrades, Upgraded Stone on Front Exterior, Stainless Steel Appliance Package, Whirlpool Refrigerator , Laundry Package, Cabinet Package with 36" Uppers , 2" Crown on Cabinets with Soft-Close Drawers, Stunning Silestone Countertops with Tile Backsplash , Upgraded Kitchen Sink & Faucet, Silestone Countertops at Baths, Upgraded Door Trim & Plumbing Package, Upgraded Interior Door Package, French Doors at Den, Ceiling Fans, Additional LED Lighting , Upgraded Flooring Throughout, Tile Surround at Primary Shower , Window Blinds Throughout
ⓘ Source: listings_history table (triggers on properties + properties_extension) + one-shot
backfill from property_details.listing_events for pre-trigger history.
Tax reassessment forecast FL · Resets to sale price
- Current annual tax
- $790 · $66/mo
- Projected year-2 tax
- $2,075 · $173/mo
- Expected delta
- +$1,285/yr (+$107/mo · 162.6%)
ⓘ Screening estimate from a state-policy table — verify with the county assessor before closing.
Nearby sold comps map
Loading sold comps map…
Walkable amenities ~0.75 mi
Loading nearby amenities…
Taxation est. · year 1
- Rental income
- $28,444
- − Mortgage interest
- −$14,003
- − Property taxes
- −$790
- − Insurance
- −$1,250
- − Repairs & maintenance
- −$2,276
- − Management
- −$2,276
- − Depreciation
- −$7,272
- Taxable income
- $577
- Est. tax owed @ 24.0%
- −$139
- After-tax cash flow
- $4,561/yr
For passive investors: Depreciation is non-cash, so a rental often shows a tax loss while cash-flowing — sheltering income. Rental losses are passive: they offset passive income freely, and up to $25,000/yr can offset ordinary (W-2) income if you actively participate and your MAGI is under $100k (phasing out to $0 by $150k); unused losses carry forward. On sale, claimed depreciation is recaptured at up to 25%, and gains may owe capital-gains tax (a 1031 exchange can defer both). Figures are a year-1 estimate at your 24.0% rate — not tax advice; consult a CPA.
Condition & rehab AI · 12 photos
This home is in excellent condition with recent upgrades, making it move-in ready and highly attractive for both resale and rental markets.
Value-add opportunities
- Both Paint exterior trim — Enhances curb appeal and value
- Both Replace carpet with hardwood or tile — Improves aesthetics and is easier to maintain
- Both Install smart home features — Attracts tech-savvy buyers and renters
Renovation cost estimate screening
Value-add ROI direction
- Both Paint exterior trim — Enhances curb appeal and value ↑
- Both Replace carpet with hardwood or tile — Improves aesthetics and is easier to maintain ↑
- Both Install smart home features — Attracts tech-savvy buyers and renters ↑
ⓘ Cost ranges are severity-bucket heuristics (US national rule-of-thumb). Get contractor quotes + a written scope before underwriting a rehab budget.
Schools (NCES district)
- District
- Marion
- NCES district ID
- 1201260
- Math proficiency
- 42% ▼ -7.00%
- Reading proficiency
- 43% ▼ -4.00%
- Median HH income
- $40,015
- Composite
- 35.61/100
- National rank
- #4890
- State rank
- #61 of 73 in FL
Livability — Ocala
- Score
- 69/100
- State rank
- #476
- US rank
- #8461
Category grades
Schools grade is shown separately in the Schools card above.
Census & demographics
- County
- Marion County · 315,796 people
- City population
- 263,375
- Metro
- Ocala, FL
- Population (ZIP)
- 22,807
- Household income
- $65,901
- Rent vs Own
- Severe rent burden
- 282.0
Population outlook (Marion County) Hauer SSP2
- Today (2025)
- 365,905 people
- By 2030
- 376,768 · +3.0%
- By 2040
- 396,555 · +8.4%
- By 2050
- 412,723 · +12.8%
- By 2075
- 446,090 · +21.9%
- By 2100
- 436,193 · +19.2%
Race, ethnicity, and origin ACS 2023
- Neighborhood character
- Majority White (63%)
- Race & ethnicity
- White 63% Hispanic / Latino 19% Black 14% Two or more races 12%
- Hispanic origin (detail)
- Mexican 6% Puerto Rican 9% Cuban 2%
- Common ancestry
- Lithuanian 2% Romanian 2% Slovak 2%
- Foreign-born
- 10% · Canada
- Languages at home
- 81% English-only · Spanish 16% Other Indo-European 1%
Political lean MEDSL · Marion
- 2024 margin
- Solid R (+31.6) · D 33.8% · R 65.5%
- 2008→2024 swing
- -20.0pp toward R · 2008: -11.6pp · 2024: -31.6pp
- All cycles
- 2024: R+31.6 2020: R+25.9 2016: R+26.2 2012: R+16.2 2008: R+11.6
Not yet ingested
- Civics
- —
Market trends
- HPI YoY
- ▼ -133.62%
- Current HPI
- 194.3857
- Rent YoY
- ▲ 11.12%
- Metro
- Ocala, FL
- State GDP YoY
- ▲ 3.28%
- F500 in state
- 36
Industry mix (Fortune 500 HQ in FL)
| Industry | F500 HQs | Revenue |
|---|---|---|
| Industrial Technology | 2 | $29B |
|
||
| Insurance | 2 | $17B |
|
||
| Retail | 1 | $60B |
|
||
| Technology Distribution | 1 | $58B |
|
||
| Homebuilding | 1 | $35B |
|
||
| Technology Manufacturing | 1 | $35B |
|
||
Price history
-8.1% since first listed3 events — show timeline
- 2026-05-01 Price Changed $249,990 Zillow
- 2026-04-01 Price Changed $262,120 Zillow
- 2025-11-07 Listed $272,120 Zillow
Property tax history
+51.9%/yrLatest (2025): $790 · +51.9% YoY. Source: county tax records.
Cash-flow waterfall
monthlySold comps — $/sqft
last 12 mo · ≤1 miLoading sold comps…