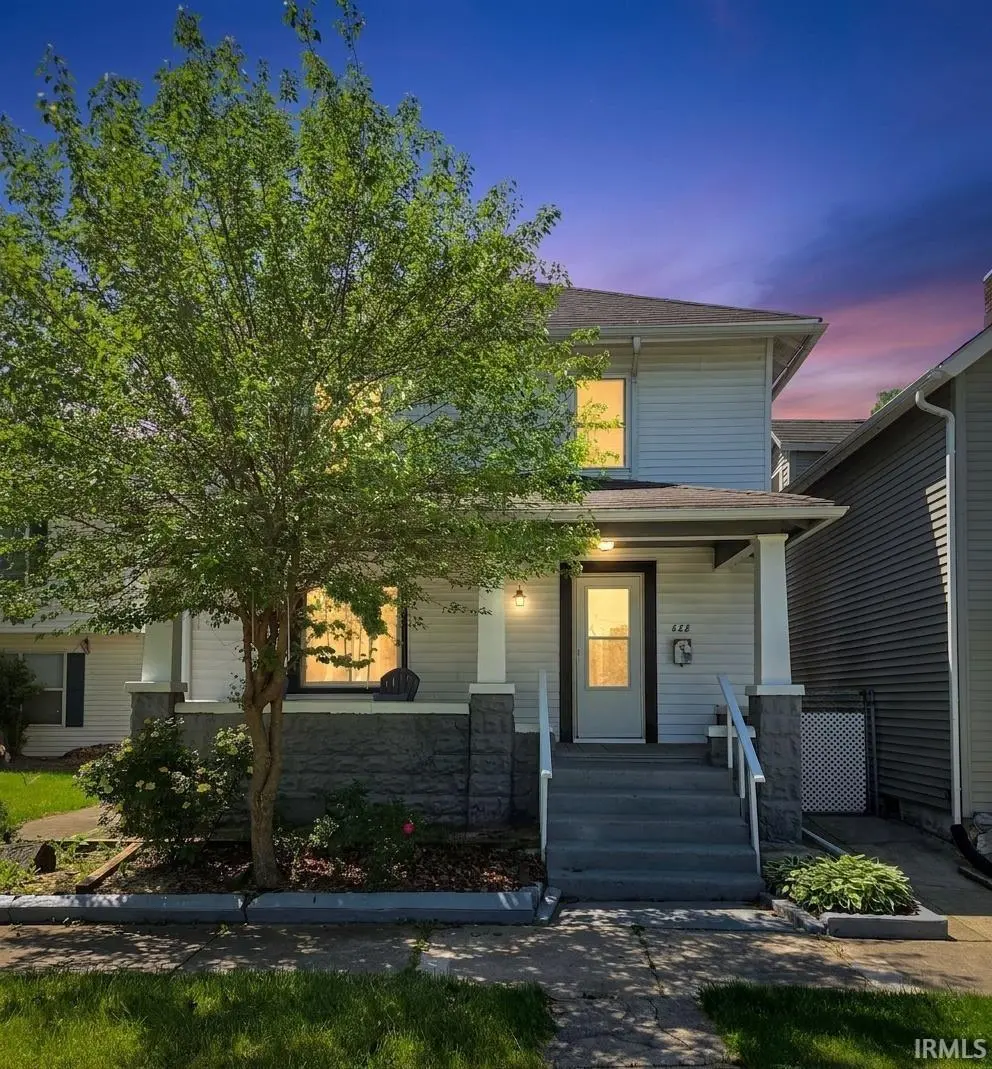
522 E Masterson Ave · Fort Wayne, IN
Flood risk 1/10 · Minimal
- FEMA flood zone
- X (unshaded)
- Chance of flooding over 30 yrs
- 0.0%
- Est. flood insurance / yr
- $473 – $860
Fire risk 1/10 · Minimal
- Est. fire insurance / yr
- $717 – $1,331
Heat risk 3/10 · Minor
- Hot days now (above 100°F)
- 7 days/yr
- Hot days in 30 yrs
- 17 days/yr
Wind risk 2/10 · Minimal
- Chance of severe wind over 30 yrs
- —
Air-quality risk 3/10 · Minor
- Unhealthy air days now
- 2 days/yr
- Unhealthy air days in 30 yrs
- 3 days/yr
Risk factors via First Street. Map © Google.
Why this score? — see what drove the D grade
The composite is a weighted blend of 9 inputs, each scored 0–100. Each bar is that input's sub-score; the figure is the points it added to the 100-point composite (weight × sub-score).
- Appreciation +10.0/10.0
- Cash flow +9.4/30.0
- ARV discount +7.5/15.0
- Livability +4.2/5.0
- DSCR +2.6/10.0
- Rent growth +2.5/5.0
- Condition / age +2.5/5.0
- Schools +2.2/10.0
- 1% rule +1.5/10.0
$198,000
🖨 Deal sheet 📄 Offer letter ✓ Due diligence
Listing remarks MLS
Purchasing as is, was used as rental. 4 bedrooms. Home minutes from downtown.
Key facts
- Tiled walk-in shower
- Stone countertops
- Freshly renovated
Tags
Property features AI
Exterior
- Parking: Detached 2-car garage
- Utilities: Public water; Public sewer
- Home design: Single-family residence (site-built); 2 stories
- Construction: Vinyl siding construction; Asphalt roof; Concrete perimeter foundation; Built above grade finished area: 1,409
- Exterior features: Covered porch; Porch; Level lot
Interior
- Kitchen: Gas range; Refrigerator
- Bedrooms: Total rooms: 6
- Flooring: Vinyl flooring
- Bathrooms: 2 full bathrooms; 1 main level bathroom
- Heating & cooling: Forced air heating; Central air conditioning; Ceiling fans
- Interior features: Open floorplan; Stone counters; Window treatments; Unfinished basement
- Laundry & utility: Washer and dryer included; Electric dryer hookup; Laundry located in basement; Gas water heater; Water heater
Neighborhood map
What this means for you Summary
Snapshot
- This is a 3-bed/2.0-bath single-family listed at $198k.
Deal economics
- At list price, monthly cash flow is $-142 ($-2k/yr) — negative.
- To cash-flow at today's rent, offer at most $173k (12.7% below list).
- To meet the 1% rule (rent ≥ 1% of price), the offer needs to be $128k (35.1% below list).
- Recommended offer: $128k (35.1% below list) — sets the bar for 1% rule.
Location & tenants
- Location reads 84/100 on livability (#6 in IN, #676 nationally) — a professional / high-income tenant draw. Strengths: amenities A+, commute A+, cost of living A+; Watch: crime C-, employment D+.
- Fort Wayne Community Schools (urban): math 22% / reading 29% proficiency, ranked #263 of 301 in IN (top 87%) — low school quality limits family demand, transient renter base, plan for 1-2y turnover; 60% free/reduced lunch — lower-income household profile, screen leases tightly.
- Zoned schools: Arlington Elementary School (math 37% / reading 32%, grade F, #597 of 994 statewide, top 63%, 420 students, 54% FRL); Jefferson Middle School (math 22% / reading 29%, grade F, #243 of 330 statewide, top 74%, 682 students, 58% FRL); Northrop High School (math 25% / reading 62%, grade F, #191 of 369 statewide, top 52%, 2,136 students, 54% FRL).
- Market conditions: 52 active listings in the ZIP; 40 comparable units currently listed for rent nearby; rentals at typical pace (median 21d on market — plan ~3-4 weeks tenant-placement turnaround); 40% of comp listings sitting > 30 days — soft ceiling on asking rent; lower-income renter base — watch delinquency; 1,861 units permitted in Allen County in 2024 (576 in 5+ unit buildings).
- This rent runs 45% of the median local income ($34k/yr) — at the standard rent-burdened threshold; future hikes will face affordability resistance.
Forward outlook
- In year one you build about $21k of equity ($1k loan paydown + $20k appreciation (10.0% local appreciation)).
- Allen County population projected at +10% by 2050 — modest demand growth; plan on rents tracking national, not racing it.
- By year 2, paydown + projected appreciation supports a ~$34k cash-out refi (75% LTV) — recoverable capital for the next deal without selling this one.
Negotiation context
- It's been on market 27 days — a 2% lower offer ($195k) is reasonable based on typical stale-listing flexibility.
- 2 sale attempts since 2y ago with the ask held roughly flat each time — persistent listings suggest the price (not the market) is what's stuck; bring a comps-based counter.
- Current owner paid $70k; list at $198k implies a 183% gain — meaningful room to come down on a strong offer.
Risks & watch-outs
- Watch-outs: built in 1908 — expect roof / HVAC / electrical / plumbing capex.
Questions for the listing agent
- What do current leases actually rent for vs. the listed asking? Can we see a recent rent roll and the last 12 months of T-12 income?
- Built in 1908 — when were the roof, HVAC, electrical panel, plumbing, and water heater last replaced?
- Is there a deadline driving the sale (1031 exchange, divorce, estate, relocation)? That informs how much negotiation room exists.
- Schools are D-rated, which usually means shorter tenancies and higher turnover. Who's the typical renter profile here, and what's been the actual vacancy rate?
- The area grade is low — what's the realistic commute time and amenity access for the typical tenant pool here? Any planned neighborhood developments (good or bad) we should know about?
- What's the average days-on-market for RENTAL listings here right now (not sales)? A rising rental-DOM trend means longer vacancies and softer asking-rent achievability than the comps imply.
- What's the recent tenant-quality profile in this submarket — average credit score on applications, eviction rate, late-payment / NSF rate, and stable-employment percentage? A property-management company in the area should have these aggregated.
- How much new for-sale + rental construction is in the pipeline within 1–3 miles? Heavy new supply typically softens prices + rents 12–24 months out; constrained supply supports both.
Investment metrics
- 1% rule
- 0.65% ✗
- Cap rate
- 5.43%
- Cash-on-cash
- -3.08%
- DSCR
- 0.86
- GRM
- 12.8
CMA / ARV
- ARV (on-the-fly)
- $94,403
- Comps found
- 12
Show comp detail 12 sales within ~0.75 mi
| Address | Dist | Beds/Ba | Sqft | Sold | Price | $/sf | Match |
|---|---|---|---|---|---|---|---|
| 416 E Creighton Ave | 0.32mi | 3/2.0 | 1,512 (+7%) | 2mo | $62,500 | $41 | 72 |
| 2524 Gay St | 0.58mi | 3/1.0 | 1,378 (-2%) | 6mo | $63,800 | $46 | 60 |
| 2432 S Hanna St | 0.42mi | 2/1.0 (-1) | 1,439 (+2%) | 10mo | $96,000 | $67 | 60 |
| 328 W Williams St | 0.61mi | 3/2.0 | 1,344 (-5%) | 9mo | $75,000 | $56 | 56 |
| 313 W Masterson Ave | 0.56mi | 3/2.0 | 1,326 (-6%) | 10mo | $80,000 | $60 | 56 |
| 2517 Caroline St | 0.47mi | 4/2.0 (+1) | 1,480 (+5%) | 11mo | $184,900 | $125 | 56 |
| 616 Boltz St | 0.70mi | 3/1.0 | 1,392 (-1%) | 11mo | $50,000 | $36 | 52 |
| 344 W Dewald St | 0.66mi | 3/1.5 | 1,500 (+6%) | 5mo | $160,000 | $107 | 52 |
| 2102 Webster St | 0.57mi | 4/2.0 (+1) | 1,516 (+8%) | 5mo | $196,000 | $129 | 52 |
| 527 E Leith St | 0.60mi | 3/1.0 | 1,312 (-7%) | 10mo | $61,000 | $46 | 48 |
| 316 W Creighton Ave | 0.63mi | 4/2.0 (+1) | 1,558 (+11%) | 4mo | $190,000 | $122 | 45 |
| 826 E Jefferson Blvd | 0.66mi | 4/2.0 (+1) | 1,562 (+11%) | 10mo | $147,900 | $95 | 37 |
Match score weights: distance 35% · size 25% · config 20% · recency 20%. Top-matched comps best support the ARV.
Projected returns pro-forma
10.0% appreciation · 3.0% rent growth · sell at horizon
- IRR
- 22.1%
- Equity multiple
- 2.78×
- Total profit
- $98,664
- Equity at exit
- $178,374
- IRR
- 19.8%
- Equity multiple
- 6.37×
- Total profit
- $297,455
- Equity at exit
- $384,670
Cash invested: $55,440 (down + closing). Projections, not guarantees.
Landlord ↔ Tenant lean methodology
- Overall (STATE)
- 90 Strongly Landlord-Friendly
- State Indiana
- 90 Strongly Landlord-Friendly · R+11
- County
- — inherits STATE
- City
- — inherits STATE
ZIP-level market 46803
- Active inventory
- 52
- Price-to-rent
- 12.8×
Monthly cashflow live
- Estimated rent
- $1,284 high interval (Pro) →
- Mortgage (P&I)
- −$1,038
- Tax from tax record
- −$36 /mo · $432/yr
- Insurance
- −$82
- HOA
- −$0
- Vacancy / Maint / Mgmt
- −$270
- Net cashflow
- $-142
Break-even live
UW: 25.0% down · 7.5% · 30yr · 1.5% tax · 5.0% vac · 8.0% maint · 8.0% mgmt
Financing live
Cash to close
- Down payment
- $49,500
- Closing costs
- $5,940
- Reserves months
- —
- Total cash needed
- —
Loan-product check · same deal, 3 products live
Conventional
25% down · 7.5% · 30yr
- Down + closing
- —
- Monthly P&I
- —
- Monthly cashflow
- —
- DSCR
- —
- Eligible?
- —
Personal DTI + credit; lowest rate.
DSCR
20% down · 8.5% · 30yr
- Down + closing
- —
- Monthly P&I
- —
- Monthly cashflow
- —
- DSCR
- —
- Eligible?
- —
No personal income docs; deal must DSCR.
Hard money
10% down · 12.0% · 12mo
- Down + closing
- —
- Monthly P&I
- —
- Monthly cashflow
- —
- DSCR
- —
- Eligible?
- —
Short-term bridge; refi at stabilization.
Rent comps 40 comps
| Address | Beds | Baths | Sqft | Rent | $/sqft | DOM | Units | Dist |
|---|---|---|---|---|---|---|---|---|
| 420 E Dewald St Fort Wayne, IN | 3.0 | 1.5 | 1472 | $1,300 | $0.88 | 43d | 1 | 0.21mi |
| 859 Buchanan St Fort Wayne, IN | 1.0–4.0 | 1.0 | 887 | $1,074 | $1.21 | 21d | 1 | 0.27mi |
| 2530 Lafayette St Fort Wayne, IN | 4.0 | 1.0 | 1816 | $1,500 | $0.83 | 43d | 1 | 0.46mi |
| 217 W Masterson Ave Fort Wayne, IN | 2.0 | 1.0 | 1100 | $995 | $0.90 | 21d | 1 | 0.49mi |
| 451 E Pontiac St Fort Wayne, IN | 3.0 | 1.0 | 1308 | $1,050 | $0.80 | 43d | 1 | 0.50mi |
| 309 W Williams St Unit 1 Fort Wayne, IN | 2.0 | 1.0 | 900 | $900 | $1.00 | 21d | 1 | 0.54mi |
| 1132 S Hanna St Unit 1 Fort Wayne, IN | 4.0 | 1.5 | 1656 | $1,600 | $0.97 | 43d | 1 | 0.59mi |
| 116 E Pontiac St Fort Wayne, IN | 3.0 | 1.5 | 1400 | $1,175 | $0.84 | 21d | 1 | 0.61mi |
| 1131 E Lewis St Fort Wayne, IN | 4.0 | 2.0 | 1476 | $1,950 | $1.32 | 13d | 1 | 0.66mi |
| 919 Madison St Fort Wayne, IN | 2.0 | 1.0 | 1332 | $995 | $0.75 | 43d | 1 | 0.69mi |
| 309 W Leith St Unit 2 Fort Wayne, IN | 2.0 | 1.0 | 900 | $1,000 | $1.11 | 43d | 1 | 0.79mi |
| 112 W Washington Blvd Fort Wayne, IN | 1.0–2.0 | 1.0–2.0 | 768 | $1,500 | $1.95 | 21d | 2 | 0.79mi |
| 2445 Fairfield Ave Fort Wayne, IN | 2.0 | 1.5 | 950 | $1,150 | $1.21 | 13d | 3 | 0.82mi |
| 1250 Ewing St Fort Wayne, IN | 2.0 | 1.0–2.0 | 980 | $2,081 | $2.12 | 21d | 24 | 0.82mi |
| 1024 Colerick St Fort Wayne, IN | 4.0 | 1.0 | 1388 | $1,065 | $0.77 | 21d | 1 | 0.83mi |
| 3008 Webster St Fort Wayne, IN | 3.0 | 1.0 | 1344 | $1,449 | $1.08 | 21d | 1 | 0.86mi |
| 603 Lavina St Fort Wayne, IN | 3.0 | 2.0 | 1872 | $1,899 | $1.01 | 43d | 1 | 0.89mi |
| 805 Edgewater Ave Fort Wayne, IN | 3.0 | 1.0 | 1075 | $1,550 | $1.44 | 13d | 1 | 0.98mi |
| 807 Edgewater Ave Fort Wayne, IN | 3.0 | 1.0 | 1075 | $1,450 | $1.35 | 21d | 1 | 0.98mi |
| 3009 Holton Ave Fort Wayne, IN | 3.0 | 1.0 | 1212 | $1,400 | $1.16 | 13d | 1 | 0.99mi |
| 2431 Fox Ave Fort Wayne, IN | 3.0 | 1.5 | 1522 | $1,550 | $1.02 | 13d | 1 | 1.00mi |
| 877 Lavina St Fort Wayne, IN | 1.0–3.0 | 1.0–2.0 | 997 | $2,980 | $2.99 | 43d | 17 | 1.03mi |
| 101 Three Rivers N Fort Wayne, IN | 2.0 | 1.0 | 760 | $2,102 | $2.76 | 21d | 11 | 1.08mi |
| 3510 S Harrison St Fort Wayne, IN | 3.0 | 1.0 | 1248 | $975 | $0.78 | 13d | 1 | 1.12mi |
| 227 W Darrow Ave Fort Wayne, IN | 3.0 | 1.0 | 995 | $1,000 | $1.01 | 43d | 1 | 1.12mi |
| 907 Lincoln Ave Fort Wayne, IN | 2.0 | 1.0 | 1060 | $850 | $0.80 | 13d | 1 | 1.13mi |
| 1104 Stophlet St Fort Wayne, IN | 3.0 | 1.5 | 1288 | $1,400 | $1.09 | 13d | 1 | 1.14mi |
| 1023 Hamilton Ave Fort Wayne, IN | 3.0 | 1.0 | 1152 | $1,075 | $0.93 | 13d | 1 | 1.17mi |
| 835 Van Buren St Fort Wayne, IN | 2.0 | 1.0–2.0 | 750 | $1,995 | $2.66 | 13d | 29 | 1.17mi |
| 1118 Rockhill St Fort Wayne, IN | 3.0 | 3.0 | 1790 | $2,300 | $1.28 | 43d | 1 | 1.19mi |
| 901 W Wayne St Unit 3 Fort Wayne, IN | 2.0 | 2.0 | 1312 | $1,700 | $1.30 | 43d | 1 | 1.19mi |
| 3801 Lafayette St Fort Wayne, IN | 2.0 | 1.0 | 1116 | $995 | $0.89 | 13d | 1 | 1.19mi |
| 1235 Huestis Ave Unit A Fort Wayne, IN | 2.0 | 1.0 | 1040 | $950 | $0.91 | 43d | 1 | 1.26mi |
| 1332 Swinney Ave Fort Wayne, IN | 2.0 | 1.0 | 1035 | $1,300 | $1.26 | 43d | 1 | 1.31mi |
| 3410 S Anthony Blvd Fort Wayne, IN | 3.0 | 1.0 | 900 | $1,200 | $1.33 | 43d | 1 | 1.31mi |
| 1206 Columbia Ave Unit 2 Fort Wayne, IN | 2.0 | 2.0 | 1118 | $995 | $0.89 | 43d | 1 | 1.31mi |
| 1342 Guthrie St Fort Wayne, IN | 3.0 | 1.0 | 1200 | $899 | $0.75 | 43d | 1 | 1.32mi |
| 2720 Queen St Fort Wayne, IN | 3.0 | 2.0 | 1316 | $1,395 | $1.06 | 13d | 1 | 1.36mi |
| 1353 Huestis Ave Fort Wayne, IN | 4.0 | 1.0 | 1328 | $1,300 | $0.98 | 13d | 1 | 1.38mi |
| 1360 Huestis Ave Fort Wayne, IN | 3.0 | 1.0 | 1056 | $1,080 | $1.02 | 13d | 1 | 1.38mi |
Listing history 19 events
-
2026-06-18days on market $198,000 Active 27 DOM
-
2026-06-17days on market $198,000 Active 26 DOM
-
2026-06-16days on market $198,000 Active 25 DOM
-
2026-06-15days on market $198,000 Active 24 DOM
-
2026-06-14days on market $198,000 Active 22 DOM
-
2026-06-10days on market $198,000 Active 19 DOM
-
2026-06-09days on market $198,000 Active 18 DOM
-
2026-06-09price $198,000 Active 17 DOM
-
2026-06-08days on market $208,000 Active 17 DOM
-
2026-06-07days on market $208,000 Active 16 DOM
-
2026-06-03days on market $208,000 Active 12 DOM
-
2026-06-02days on market $208,000 Active 11 DOM
-
2026-06-01days on market $208,000 Active 10 DOM
-
2026-05-31days on market $208,000 Active 9 DOM
-
2026-05-30days on market $208,000 Active 8 DOM
-
2026-05-22$208,000 Active
-
2024-11-06soldstatus $70,000 Closed 77-char remark
Show marketing remark (77 chars)
Purchasing as is, was used as rental. 4 bedrooms. Home minutes from downtown.
-
2024-10-18status Pending 77-char remark
Show marketing remark (77 chars)
Purchasing as is, was used as rental. 4 bedrooms. Home minutes from downtown.
-
2024-10-14$89,900 Active 77-char remark
Show marketing remark (77 chars)
Purchasing as is, was used as rental. 4 bedrooms. Home minutes from downtown.
ⓘ Source: listings_history table (triggers on properties + properties_extension) + one-shot
backfill from property_details.listing_events for pre-trigger history.
Tax reassessment forecast IN · Partial reset (capped growth)
- Current annual tax
- $432 · $36/mo
- Projected year-2 tax
- $1,058 · $88/mo
- Expected delta
- +$625/yr (+$52/mo · 144.6%)
ⓘ Screening estimate from a state-policy table — verify with the county assessor before closing.
Climate risk First Street
- Flood 1/10 Low FEMA zone X (unshaded) · 0% chance over 30 yrs
- Wildfire 1/10 Low
- Heat 3/10 Moderate 7 d/yr ≥100°F today · 17 d/yr by 30 yrs out
- Wind 2/10 Low
- Air quality 3/10 Moderate 2 unhealthy d/yr today · 3 by 30 yrs out
Nearby sold comps map
Loading sold comps map…
Walkable amenities ~0.75 mi
Loading nearby amenities…
Taxation est. · year 1
- Rental income
- $15,412
- − Mortgage interest
- −$11,091
- − Property taxes
- −$432
- − Insurance
- −$990
- − Repairs & maintenance
- −$1,233
- − Management
- −$1,233
- − Depreciation
- −$5,760
- Taxable loss
- −$5,328
- Est. tax savings @ 24.0%
- +$1,279
- After-tax cash flow
- $-429/yr
For passive investors: Depreciation is non-cash, so a rental often shows a tax loss while cash-flowing — sheltering income. Rental losses are passive: they offset passive income freely, and up to $25,000/yr can offset ordinary (W-2) income if you actively participate and your MAGI is under $100k (phasing out to $0 by $150k); unused losses carry forward. On sale, claimed depreciation is recaptured at up to 25%, and gains may owe capital-gains tax (a 1031 exchange can defer both). Figures are a year-1 estimate at your 24.0% rate — not tax advice; consult a CPA.
Schools (NCES district)
- District
- Fort Wayne Community Schools
- NCES district ID
- 1803630
- Math proficiency
- 22% ▼ -11.00%
- Reading proficiency
- 29% ▼ -7.00%
- Median HH income
- $41,951
- Composite
- 21.68/100
- National rank
- #8275
- State rank
- #263 of 301 in IN
Livability — Fort Wayne
- Score
- 84/100
- State rank
- #6
- US rank
- #676
Category grades
Schools grade is shown separately in the Schools card above.
Census & demographics
- Census place
- Fort Wayne, IN
- County
- Allen County · 326,813 people
- City population
- 326,813
- Metro
- Fort Wayne, IN
- Population (ZIP)
- 10,994
- Household income
- $34,381
- Rent vs Own
- Severe rent burden
- 660.0
Population outlook (Allen County) Hauer SSP2
- Today (2025)
- 394,020 people
- By 2030
- 405,128 · +2.8%
- By 2040
- 423,476 · +7.5%
- By 2050
- 435,137 · +10.4%
- By 2075
- 450,293 · +14.3%
- By 2100
- 424,101 · +7.6%
Race, ethnicity, and origin ACS 2023
- Neighborhood character
- Diverse neighborhood (Simpson 0.69)
- Race & ethnicity
- Black 42% White 27% Hispanic / Latino 24% Two or more races 10% Native American 2% Asian 1%
- Hispanic origin (detail)
- Mexican 17% Puerto Rican 1%
- Common ancestry
- Lithuanian 1% Iranian 1% Serbian 1%
- Foreign-born
- 11% · Canada, Philippines
- Languages at home
- 81% English-only · Spanish 16% Other Asian/Pacific 1% French/Haitian/Cajun 1%
Political lean MEDSL · Allen
- 2024 margin
- R (+12.5) · D 42.9% · R 55.4% · Other 1.7%
- 2008→2024 swing
- -8.1pp toward R · 2008: -4.3pp · 2024: -12.5pp
- All cycles
- 2024: R+12.5 2020: R+11.2 2016: R+19.6 2012: R+16.8 2008: R+4.3
Not yet ingested
- Civics
- —
Market trends
- HPI YoY
- ▲ 107.58%
- Current HPI
- 404.7976
- Rent YoY
- —
- Metro
- Fort Wayne, IN
- State GDP YoY
- ▲ 2.90%
- F500 in state
- 18
Industry mix (Fortune 500 HQ in IN)
| Industry | F500 HQs | Revenue |
|---|---|---|
| Industrial Machinery | 2 | $37B |
|
||
| Healthcare | 1 | $177B |
|
||
| Pharmaceuticals | 1 | $45B |
|
||
| Metals / Steel | 1 | $18B |
|
||
| Agriculture | 1 | $17B |
|
||
| Packaging | 1 | $12B |
|
||
Price history
+131.4% since first listed4 events — show timeline
- 2026-05-22 Listed $208,000 IRMLS
- 2024-11-06 Sold (MLS) $70,000 IRMLS
- 2024-10-18 Pending — IRMLS
- 2024-10-14 Listed $89,900 IRMLS
Property tax history
-0.5%/yrLatest (2024): $432 · -72.2% YoY. Source: county tax records.
Cash-flow waterfall
monthlySold comps — $/sqft
last 12 mo · ≤1 miLoading sold comps…