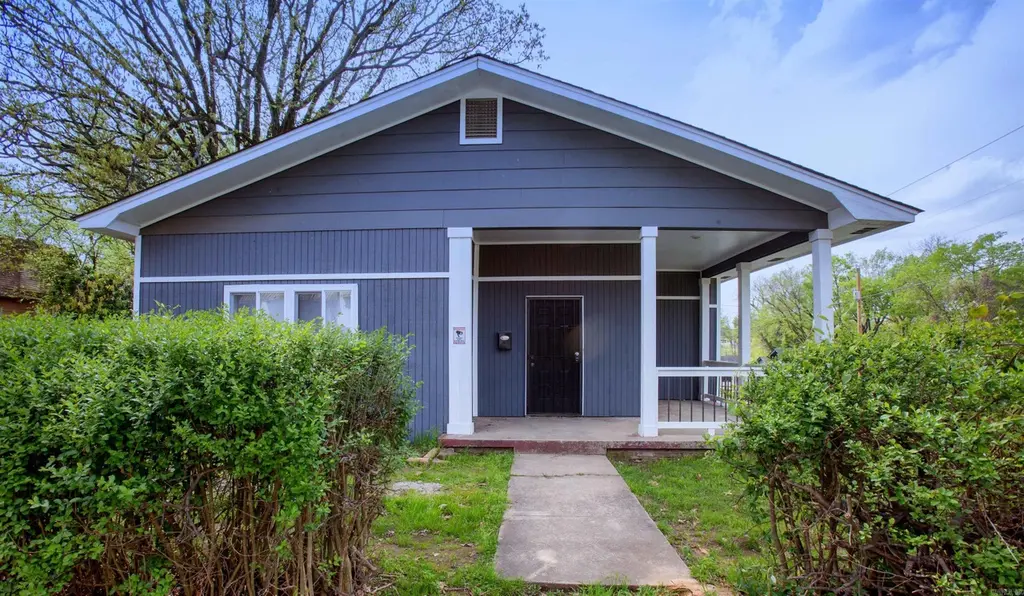
1900 S Pulaski St · Little Rock, AR
Flood risk 1/10 · Minimal
- FEMA flood zone
- X (unshaded)
- Chance of flooding over 30 yrs
- 0.0%
- Est. flood insurance / yr
- $507 – $1,088
Fire risk 1/10 · Minimal
- Est. fire insurance / yr
- $1,499 – $2,785
Heat risk 7/10 · Major
- Hot days now (above 110°F)
- 7 days/yr
- Hot days in 30 yrs
- 19 days/yr
Wind risk 4/10 · Minor
- Chance of severe wind over 30 yrs
- 9.0%
Air-quality risk 2/10 · Minimal
- Unhealthy air days now
- 1 days/yr
- Unhealthy air days in 30 yrs
- 1 days/yr
Risk factors via First Street. Map © Google.
Why this score? — see what drove the C+ grade
The composite is a weighted blend of 9 inputs, each scored 0–100. Each bar is that input's sub-score; the figure is the points it added to the 100-point composite (weight × sub-score).
- Cash flow +30.0/30.0
- 1% rule +10.0/10.0
- DSCR +10.0/10.0
- Livability +3.7/5.0
- Rent growth +3.3/5.0
- ARV discount +2.7/15.0
- Condition / age +2.5/5.0
- Schools +2.1/10.0
- Appreciation +0.0/10.0
$90,000
🖨 Deal sheet (PDF) 📄 Offer letter ✓ Due diligence
Listing remarks MLS
Check out this 3BD/1.5BA house in Little Rock. Granite countertops in the kitchen. Fully fenced yard perfect for anyone with kids or pets. A large back deck ready for all the cookouts. No SPD. Showing are appointment only, only Monday- Friday 8:30 to 4:30. 24-hour notice required. Tenant occupied.
Key facts
- Large back deck
- Granite countertops
- Fully fenced yard
Tags
Neighborhood map
What this means for you Summary
Snapshot
- This is a 3-bed/1.5-bath single-family listed at $90k.
Deal economics
- At list price, monthly cash flow is $486 ($6k/yr) — positive.
- The deal already cash-flows at list — no discount required.
- Meets the 1% rule at list price ($1k rent vs $90k).
- Recommended offer: $85k (6.0% below list) — sets the bar for market timing.
- Cap rate 12.8% vs local median 4.1% in Little Rock — top-decile yield for the area; either an underpriced asset or a hidden risk that comps aren't pricing in. Stress-test before assuming the spread holds.
Location & tenants
- Location reads 73/100 on livability (#22 in AR) — a middle-class / working-renter tenant base. Strengths: commute A+, cost of living A+, housing A+; Watch: crime F.
- Little Rock School District (urban): math 23% / reading 26% proficiency, ranked #183 of 238 in AR (top 77%) — low school quality limits family demand, transient renter base, plan for 1-2y turnover; 69% free/reduced lunch — lower-income household profile, screen leases tightly.
- Zoned schools: Washington Elementary School (math 12% / reading 8%, grade F, #429 of 454 statewide, top 96%, 319 students, 97% FRL); Dunbar Magnet Middle School (math 6% / reading 13%, grade F, #196 of 201 statewide, top 98%, 320 students, 90% FRL); Central High School (math 32% / reading 42%, grade F, #64 of 292 statewide, top 26%, 2,338 students, 53% FRL).
- Market conditions: Rents rising (+3.4%/yr); 127 active listings in the ZIP; 40 comparable units currently listed for rent nearby; rentals at typical pace (median 25d on market — plan ~3-4 weeks tenant-placement turnaround); 45% of comp listings sitting > 30 days — soft ceiling on asking rent; 1,006 units permitted in Pulaski County in 2024 (0 in 5+ unit buildings).
- This rent runs 32% of the median local income ($52k/yr) — at the standard rent-burdened threshold; future hikes will face affordability resistance.
Forward outlook
- Local home prices are declining (-3.0%/yr); year-one equity from $622 of loan paydown is wiped out by about $3k of value loss. Plan a longer hold.
- Pulaski County population projected at +6% by 2050 — modest demand growth; plan on rents tracking national, not racing it.
- At projected returns (-3.0% appreciation + 3.4% rent growth), your $25k cash investment doubles in ~6 years — after that, you're playing with house money.
Negotiation context
- It's been on market 67 days — a 6% lower offer ($85k) is reasonable based on typical stale-listing flexibility.
- 12 sale attempts since 9y ago with the ask held roughly flat each time — persistent listings suggest the price (not the market) is what's stuck; bring a comps-based counter.
Risks & watch-outs
- Watch-outs: built in 1910 — expect roof / HVAC / electrical / plumbing capex.
- Climate carrying-cost: extreme-heat days projected 7→19/yr by 2055 (HVAC capex compounding) — expect insurance premiums to compound above CPI over the hold.
Questions for the listing agent
- It's been on market 67 days. Have you received any prior offers? Is the seller open to a 6% concession, seller financing, or rate buy-down credit?
- Built in 1910 — when were the roof, HVAC, electrical panel, plumbing, and water heater last replaced?
- Why hasn't it sold? Are there any deal-killer items the seller is aware of (foundation, flood, title, zoning, code violations)?
- Is there a deadline driving the sale (1031 exchange, divorce, estate, relocation)? That informs how much negotiation room exists.
- Crime grade is F in this area — have there been break-ins, vandalism, or insurance claims at this property in the last 3 years? What carrier currently insures it and at what premium?
- What's the average days-on-market for RENTAL listings here right now (not sales)? A rising rental-DOM trend means longer vacancies and softer asking-rent achievability than the comps imply.
- What's the recent tenant-quality profile in this submarket — average credit score on applications, eviction rate, late-payment / NSF rate, and stable-employment percentage? A property-management company in the area should have these aggregated.
- How much new for-sale + rental construction is in the pipeline within 1–3 miles? Heavy new supply typically softens prices + rents 12–24 months out; constrained supply supports both.
Investment metrics
- 1% rule
- 1.55% ✓
- Cap rate
- 12.77%
- Cash-on-cash
- 23.12%
- DSCR
- 2.03
- GRM
- 5.4
CMA / ARV
- ARV (median comp)
- $81,339
- List price
- $90,000
- Delta
- 10.65%
- Verdict
- OVERPRICED
- Comps
- 20 within 1.0 mi
Show comp detail 12 sales within ~0.75 mi
| Address | Dist | Beds/Ba | Sqft | Sold | Price | $/sf | Match |
|---|---|---|---|---|---|---|---|
| 1509 W 19th St | 0.11mi | 2/1.0 (-1) | 1,352 (-0%) | 7mo | $50,000 | $37 | 82 |
| 1517 W 15th St | 0.38mi | 3/2.5 | 1,292 (-5%) | 4mo | $229,500 | $178 | 67 |
| 1417 Wolfe St | 0.49mi | 2/1.0 (-1) | 1,374 (+2%) | 2mo | $155,000 | $113 | 66 |
| 1806 S State St | 0.36mi | 3/1.0 | 1,464 (+8%) | 3mo | $105,000 | $72 | 65 |
| 1106 W 21 St | 0.17mi | 3/1.0 | 1,180 (-13%) | 5mo | $33,500 | $28 | 64 |
| 1872 S Gaines St | 0.41mi | 2/2.0 (-1) | 1,410 (+4%) | 5mo | $64,500 | $46 | 63 |
| 1504 Bishop St | 0.41mi | 3/2.5 | 1,254 (-7%) | 10mo | $225,000 | $179 | 57 |
| 1502 Bishop St | 0.41mi | 3/2.5 | 1,254 (-7%) | 10mo | $225,000 | $179 | 56 |
| 316 W 22nd St | 0.68mi | 2/1.5 (-1) | 1,263 (-7%) | 2mo | $225,000 | $178 | 50 |
| 2411 S Schiller | 0.57mi | 3/2.0 | 1,547 (+14%) | 2mo | $240,000 | $155 | 46 |
| 2018 Center St | 0.69mi | 2/1.0 (-1) | 1,422 (+5%) | 9mo | $170,000 | $120 | 45 |
| 2220 W 22nd St | 0.65mi | 3/1.0 | 1,200 (-11%) | 8mo | $130,000 | $108 | 42 |
Match score weights: distance 35% · size 25% · config 20% · recency 20%. Top-matched comps best support the ARV.
Projected returns pro-forma
-3.0% appreciation · 3.36% rent growth · sell at horizon
- IRR
- 16.5%
- Equity multiple
- 1.67×
- Total profit
- $16,862
- Equity at exit
- $13,419
- IRR
- 25.4%
- Equity multiple
- 3.25×
- Total profit
- $56,657
- Equity at exit
- $7,782
Cash invested: $25,200 (down + closing). Projections, not guarantees.
Landlord ↔ Tenant lean methodology
- Overall (STATE)
- 92 Strongly Landlord-Friendly
- State Arkansas
- 92 Strongly Landlord-Friendly · R+14
- County
- — inherits STATE
- City
- — inherits STATE
ZIP-level market 72206
- Rents YoY
- 3.4%
- Active inventory
- 127
- Price-to-rent
- 5.4×
Monthly cashflow live
- Estimated rent
- $1,391 high interval (Pro) →
- Mortgage (P&I)
- −$472
- Tax from tax record
- −$104 /mo · $1,250/yr
- Insurance
- −$38
- HOA
- −$0
- Vacancy / Maint / Mgmt
- −$292
- Net cashflow
- $486
Break-even live
Sensitivity live
| Price | -10% $536 | -5% $511 | +0% $486 | +5% $460 | +10% $435 |
|---|---|---|---|---|---|
| Rent | -10% $376 | -5% $431 | +0% $486 | +5% $540 | +10% $595 |
| Rate | -1.0pp $531 | -0.5pp $508 | base $486 | +0.5pp $462 | +1.0pp $438 |
UW: 25.0% down · 7.5% · 30yr · 1.5% tax · 5.0% vac · 8.0% maint · 8.0% mgmt
Financing live
Cash to close
- Down payment
- $22,500
- Closing costs
- $2,700
- Reserves months
- —
- Total cash needed
- —
Loan-product check · same deal, 3 products live
Conventional
25% down · 7.5% · 30yr
- Down + closing
- —
- Monthly P&I
- —
- Monthly cashflow
- —
- DSCR
- —
- Eligible?
- —
Personal DTI + credit; lowest rate.
DSCR
20% down · 8.5% · 30yr
- Down + closing
- —
- Monthly P&I
- —
- Monthly cashflow
- —
- DSCR
- —
- Eligible?
- —
No personal income docs; deal must DSCR.
Hard money
10% down · 12.0% · 12mo
- Down + closing
- —
- Monthly P&I
- —
- Monthly cashflow
- —
- DSCR
- —
- Eligible?
- —
Short-term bridge; refi at stabilization.
Rent comps 40 comps
| Address | Beds | Baths | Sqft | Rent | $/sqft | DOM | Units | Dist |
|---|---|---|---|---|---|---|---|---|
| 1903 Marshall St Little Rock, AR | 3.0 | 2.0 | 1152 | $1,200 | $1.04 | 25d | 1 | 0.20mi |
| 1209 W 22nd St Little Rock, AR | 4.0 | 2.0 | 1104 | $1,850 | $1.68 | 45d | 1 | 0.22mi |
| 1921 Wolfe St Unit A Little Rock, AR | 2.0 | 2.0 | 875 | $875 | $1.00 | 25d | 1 | 0.27mi |
| 1906 S State St Little Rock, AR | 2.0 | 2.0 | 1160 | $1,895 | $1.63 | 45d | 1 | 0.31mi |
| 1908 S State St Little Rock, AR | 2.0 | 2.0 | 1160 | $1,650 | $1.42 | 45d | 1 | 0.31mi |
| 1515 Wolfe St Little Rock, AR | 3.0 | 2.0 | 1386 | $1,100 | $0.79 | 25d | 1 | 0.45mi |
| 2113 W 19th St Little Rock, AR | 2.0 | 1.0 | 1703 | $1,300 | $0.76 | 45d | 1 | 0.51mi |
| 2610 S Izard St Little Rock, AR | 3.0 | 2.0 | 1136 | $1,150 | $1.01 | 45d | 1 | 0.58mi |
| 2616 S Izard St Little Rock, AR | 4.0 | 2.0 | 1223 | $1,595 | $1.30 | 45d | 1 | 0.59mi |
| 2200 Dennison St Little Rock, AR | 3.0 | 1.5 | 1080 | $1,000 | $0.93 | 45d | 1 | 0.70mi |
| 313 W 23rd St Little Rock, AR | 3.0 | 2.0 | 1134 | $925 | $0.82 | 25d | 1 | 0.71mi |
| 2323 S Spring St Little Rock, AR | 3.0 | 2.0 | 1070 | $1,100 | $1.03 | 45d | 1 | 0.72mi |
| 926 W 29th St Little Rock, AR | 3.0 | 1.0 | 1229 | $1,050 | $0.85 | 25d | 1 | 0.72mi |
| 2604 Broadway St Little Rock, AR | 4.0 | 2.0 | 1223 | $1,595 | $1.30 | 25d | 1 | 0.73mi |
| 1500 Center St Unit 5 Little Rock, AR | 2.0 | 1.5 | 1100 | $1,295 | $1.18 | 45d | 1 | 0.74mi |
| 2014 S Louisiana St Unit 3 Little Rock, AR | 2.0 | 1.0 | 900 | $1,350 | $1.50 | 45d | 1 | 0.74mi |
| 2324 W Daisy L Gatson Bates Dr Unit 1 Little Rock, AR | 2.0 | 1.0 | 881 | $1,095 | $1.24 | 45d | 1 | 0.84mi |
| 2324 W Daisy L Gatson Bates Dr Unit 2 Little Rock, AR | 2.0 | 1.0 | 881 | $1,050 | $1.19 | 25d | 1 | 0.84mi |
| 1212 Center St Little Rock, AR | 2.0 | 2.0 | 1200 | $1,750 | $1.46 | 25d | 1 | 0.84mi |
| 201 E 17th St Little Rock, AR | 2.0 | 1.5 | 1124 | $1,550 | $1.38 | 15d | 1 | 0.90mi |
| 907 S Park St Little Rock, AR | 2.0 | 2.0 | 950 | $2,100 | $2.21 | 25d | 1 | 0.95mi |
| 1123 Thayer St Little Rock, AR | 4.0 | 2.0 | 1223 | $1,595 | $1.30 | 25d | 1 | 0.96mi |
| 2900 Center St Little Rock, AR | 3.0 | 1.0 | 1456 | $1,050 | $0.72 | 45d | 1 | 0.96mi |
| 717 W 32nd St Unit A and B Little Rock, AR | 3.0 | 2.5 | 1300 | $1,550 | $1.19 | 15d | 1 | 0.98mi |
| 3222 Bishop St Unit B Little Rock, AR | 3.0 | 2.0 | 1200 | $1,300 | $1.08 | 25d | 1 | 0.99mi |
| 1401 Cumberland St Little Rock, AR | 3.0 | 1.0 | 1566 | $1,250 | $0.80 | 45d | 1 | 1.04mi |
| 1401 Cumberland St Little Rock, AR | 3.0 | 1.0 | 1566 | $1,295 | $0.83 | 15d | 1 | 1.04mi |
| 2318 Rock St Little Rock, AR | 2.0 | 2.0 | 1358 | $2,300 | $1.69 | 45d | 1 | 1.05mi |
| 2803 W Daisy L Gatson Bates Dr Little Rock, AR | 4.0 | 2.0 | 1138 | $1,495 | $1.31 | 45d | 1 | 1.06mi |
| 421 W 32nd St Little Rock, AR | 4.0 | 2.0 | 1223 | $1,550 | $1.27 | 20d | 1 | 1.08mi |
| 1004 Scott St Unit 1 Little Rock, AR | 2.0 | 1.0 | 1398 | $1,395 | $1.00 | 25d | 1 | 1.09mi |
| 1822 Booker St Little Rock, AR | 3.0 | 2.0 | 1076 | $1,195 | $1.11 | 25d | 1 | 1.12mi |
| 2900 W 15th St Little Rock, AR | 3.0 | 1.0 | 1337 | $950 | $0.71 | 45d | 1 | 1.12mi |
| 3015 Main St Little Rock, AR | 4.0 | 2.0 | 1658 | $2,350 | $1.42 | 45d | 1 | 1.13mi |
| 3333 Broadway St Little Rock, AR | 3.0 | 1.0 | 918 | $925 | $1.01 | 20d | 1 | 1.14mi |
| 2708 Rock St Little Rock, AR | 3.0 | 1.0 | 1114 | $875 | $0.79 | 22d | 1 | 1.16mi |
| 1820 Johnson St Little Rock, AR | 4.0 | 2.0 | 1223 | $1,550 | $1.27 | 20d | 1 | 1.18mi |
| 606 E 21st St Little Rock, AR | 3.0 | 2.0 | 1652 | $1,600 | $0.97 | 20d | 1 | 1.21mi |
| 324 S Schiller St Little Rock, AR | 3.0 | 2.0 | 1352 | $1,995 | $1.48 | 25d | 1 | 1.25mi |
| 306 S Schiller St Little Rock, AR | 3.0 | 2.0 | 1037 | $1,795 | $1.73 | 45d | 1 | 1.26mi |
Listing history 50 events
-
2026-06-21days on market $90,000 Active 67 DOM
-
2026-06-18days on market $90,000 Active 64 DOM
-
2026-06-17days on market $90,000 Active 63 DOM
-
2026-06-16days on market $90,000 Active 62 DOM
-
2026-06-15days on market $90,000 Active 61 DOM
-
2026-06-14days on market $90,000 Active 59 DOM
-
2026-06-13days on market $90,000 Active 58 DOM
-
2026-06-10days on market $90,000 Active 56 DOM
-
2026-06-09days on market $90,000 Active 55 DOM
-
2026-06-08days on market $90,000 Active 54 DOM
-
2026-06-05days on market $90,000 Active 50 DOM
-
2026-06-03days on market $90,000 Active 49 DOM
-
2026-06-02days on market $90,000 Active 48 DOM
-
2026-06-01days on market $90,000 Active 47 DOM
-
2026-05-31days on market $90,000 Active 46 DOM
-
2026-05-31days on market $90,000 Active 45 DOM
-
2026-04-15$90,000 New Listing 298-char remark
Show marketing remark (298 chars)
Check out this 3BD/1.5BA house in Little Rock. Granite countertops in the kitchen. Fully fenced yard perfect for anyone with kids or pets. A large back deck ready for all the cookouts. No SPD. Showing are appointment only, only Monday- Friday 8:30 to 4:30. 24-hour notice required. Tenant occupied.
-
2025-09-30historical
-
2025-08-29price $100,000
-
2025-08-20price $105,000
-
2025-03-06$120,000 New Listing
-
2024-11-21historical
-
2024-10-08historical $975
-
2024-08-31$975
-
2024-08-15price $120,000
-
2024-07-17price $130,000
-
2024-05-20$140,000 New Listing
-
2024-05-01historical $1,100
-
2024-04-12price $1,100
-
2024-03-08price $1,150
-
2024-02-17$1,200
-
2023-05-16soldstatus $149,500 Sold
-
2023-03-23historical
-
2023-03-23$149,500
-
2022-07-08soldstatus $85,000
-
2022-06-30soldstatus $68,000
-
2020-11-26historical
-
2020-11-23soldstatus $31,700 Sold
-
2020-11-06historical Take Backups
-
2020-10-22status Back on Market
-
2020-10-07historical
-
2020-10-06$31,500 New Listing
-
2020-07-14historical
-
2020-07-06price $45,000
-
2020-06-05$51,300 New Listing
-
2019-04-29historical
-
2019-04-10historical Take Backups
-
2019-02-12price $82,500
-
2019-01-11$83,000 New Listing
-
2018-01-23status Under Contract
ⓘ Source: listings_history table (triggers on properties + properties_extension) + one-shot
backfill from property_details.listing_events for pre-trigger history.
Tax reassessment forecast AR · Resets to sale price
- Current annual tax
- $1,250 · $104/mo
- Projected year-2 tax
- $1,250 · $104/mo
- Expected delta
- $0/yr ($0/mo · 0.0%)
ⓘ Screening estimate from a state-policy table — verify with the county assessor before closing.
Climate risk First Street
- Flood 1/10 Low FEMA zone X (unshaded) · 0% chance over 30 yrs
- Wildfire 1/10 Low
- Heat 7/10 Severe 7 d/yr ≥110°F today · 19 d/yr by 30 yrs out
- Wind 4/10 Moderate 9% chance of damaging wind over 30 yrs
- Air quality 2/10 Low 1 unhealthy d/yr today · 1 by 30 yrs out
Nearby sold comps map
Loading sold comps map…
Walkable amenities ~0.75 mi
Loading nearby amenities…
Taxation est. · year 1
- Rental income
- $16,696
- − Mortgage interest
- −$5,041
- − Property taxes
- −$1,250
- − Insurance
- −$450
- − Repairs & maintenance
- −$1,336
- − Management
- −$1,336
- − Depreciation
- −$2,618
- Taxable income
- $4,665
- Est. tax owed @ 24.0%
- −$1,120
- After-tax cash flow
- $4,707/yr
For passive investors: Depreciation is non-cash, so a rental often shows a tax loss while cash-flowing — sheltering income. Rental losses are passive: they offset passive income freely, and up to $25,000/yr can offset ordinary (W-2) income if you actively participate and your MAGI is under $100k (phasing out to $0 by $150k); unused losses carry forward. On sale, claimed depreciation is recaptured at up to 25%, and gains may owe capital-gains tax (a 1031 exchange can defer both). Figures are a year-1 estimate at your 24.0% rate — not tax advice; consult a CPA.
Schools (NCES district)
- District
- Little Rock School District
- NCES district ID
- 0509000
- Math proficiency
- 23% ▼ -12.00%
- Reading proficiency
- 26% ▼ -8.00%
- Median HH income
- $43,346
- Composite
- 21.0/100
- National rank
- #8457
- State rank
- #183 of 238 in AR
Livability — Little Rock
- Score
- 73/100
- State rank
- #22
- US rank
- #5295
Category grades
Schools grade is shown separately in the Schools card above.
Census & demographics
- Census place
- Little Rock, AR
- County
- Pulaski County · 372,764 people
- City population
- 218,896
- Metro
- Little Rock-North Little Rock-Conway, AR
- Population (ZIP)
- 22,667
- Household income
- $52,132
- Rent vs Own
- Severe rent burden
- 623.0
Population outlook (Pulaski County) Hauer SSP2
- Today (2025)
- 415,378 people
- By 2030
- 423,720 · +2.0%
- By 2040
- 435,182 · +4.8%
- By 2050
- 440,904 · +6.1%
- By 2075
- 445,521 · +7.3%
- By 2100
- 419,173 · +0.9%
Race, ethnicity, and origin ACS 2023
- Neighborhood character
- Diverse neighborhood (Simpson 0.59)
- Race & ethnicity
- Black 48% White 43% Two or more races 6% Hispanic / Latino 5%
- Hispanic origin (detail)
- Mexican 4%
- Common ancestry
- Iranian 1% Italian 1% Lithuanian 1%
- Foreign-born
- 1% · Canada
- Languages at home
- 94% English-only · Spanish 5%
Political lean MEDSL · Pulaski
- 2024 margin
- Strong D (+22.1) · D 59.8% · R 37.7% · Other 2.5%
- 2008→2024 swing
- +10.6pp toward D · 2008: 11.6pp · 2024: 22.1pp
- All cycles
- 2024: D+22.1 2020: D+22.5 2016: D+17.9 2012: D+11.4 2008: D+11.6
Not yet ingested
- Civics
- —
Market trends
- HPI YoY
- ▼ -88.64%
- Current HPI
- 158.3601
- Rent YoY
- ▲ 3.36%
- Metro
- Little Rock-North Little Rock-Conway, AR
- State GDP YoY
- ▲ 3.80%
- F500 in state
- 10
Industry mix (Fortune 500 HQ in AR)
| Industry | F500 HQs | Revenue |
|---|---|---|
| Retail | 1 | $681B |
|
||
| Food / Agriculture | 1 | $53B |
|
||
| Retail / Energy | 1 | $22B |
|
||
| Transportation / Logistics | 1 | $12B |
|
||
| Energy | 1 | $4B |
|
||
Price history
+233.3% since first listed41 events — show timeline
- 2026-04-15 Listed $90,000 CARMLS
- 2025-09-30 Listing Removed — CARMLS
- 2025-08-29 Price Changed $100,000 CARMLS
- 2025-08-20 Price Changed $105,000 CARMLS
- 2025-03-06 Listed $120,000 CARMLS
- 2024-11-21 Listing Removed — CARMLS
- 2024-10-08 Rental Removed $975 CARMLS
- 2024-08-31 Listed for Rent $975 CARMLS
- 2024-08-15 Price Changed $120,000 CARMLS
- 2024-07-17 Price Changed $130,000 CARMLS
- 2024-05-20 Listed $140,000 CARMLS
- 2024-05-01 Rental Removed $1,100 CARMLS
- 2024-04-12 Price Changed $1,100 CARMLS
- 2024-03-08 Price Changed $1,150 CARMLS
- 2024-02-17 Listed for Rent $1,200 CARMLS
- 2023-05-16 Sold (MLS) $149,500 CARMLS
- 2023-03-23 Listed $149,500 CARMLS
- 2023-03-23 Listing Removed — CARMLS
- 2022-07-08 Sold (Public Records) $85,000 Public Records
- 2022-06-30 Sold (Public Records) $68,000 Public Records
- 2020-11-26 Listing Removed — CARMLS
- 2020-11-23 Sold (MLS) $31,700 CARMLS
- 2020-11-06 Contingent — CARMLS
- 2020-10-22 Relisted — CARMLS
- 2020-10-07 Listing Removed — CARMLS
- 2020-10-06 Listed $31,500 CARMLS
- 2020-07-14 Listing Removed — CARMLS
- 2020-07-06 Price Changed $45,000 CARMLS
- 2020-06-05 Listed $51,300 CARMLS
- 2019-04-29 Listing Removed — CARMLS
- 2019-04-10 Contingent — CARMLS
- 2019-02-12 Price Changed $82,500 CARMLS
- 2019-01-11 Listed $83,000 CARMLS
- 2018-01-23 Pending — CARMLS
- 2018-01-18 Sold (MLS) $87,000 CARMLS
- 2017-11-09 Contingent — CARMLS
- 2017-10-18 Listed $89,900 CARMLS
- 2017-05-02 Sold (MLS) $16,000 CARMLS
- 2017-04-12 Pending — CARMLS
- 2017-03-12 Price Changed $24,300 CARMLS
- 2017-01-25 Listed $27,000 CARMLS
Property tax history
+12.8%/yrLatest (2025): $1,250 · +0.0% YoY. Source: county tax records.
Cash-flow waterfall
monthlySold comps — $/sqft
last 12 mo · ≤1 miLoading sold comps…