5603 Newcastle Ct #5612 · Ave Maria, FL
Flood risk No data
- FEMA flood zone
- —
- Chance of flooding over 30 yrs
- —
- Est. flood insurance / yr
- —
Fire risk No data
- Est. fire insurance / yr
- —
Heat risk No data
- Hot days now (above threshold)
- —
- Hot days in 30 yrs
- —
Wind risk No data
- Chance of severe wind over 30 yrs
- —
Air-quality risk No data
- Unhealthy air days now
- —
- Unhealthy air days in 30 yrs
- —
Risk factors via First Street. Map © Google.
Why this score? — see what drove the B- grade
The composite is a weighted blend of 9 inputs, each scored 0–100. Each bar is that input's sub-score; the figure is the points it added to the 100-point composite (weight × sub-score).
- Cash flow +24.2/30.0
- 1% rule +10.0/10.0
- DSCR +7.8/10.0
- ARV discount +7.5/15.0
- Schools +5.0/10.0
- Condition / age +5.0/5.0
- Appreciation +4.5/10.0
- Rent growth +3.2/5.0
- Livability +2.5/5.0
$289,997
🖨 Deal sheet 📄 Offer letter ✓ Due diligence
Listing remarks
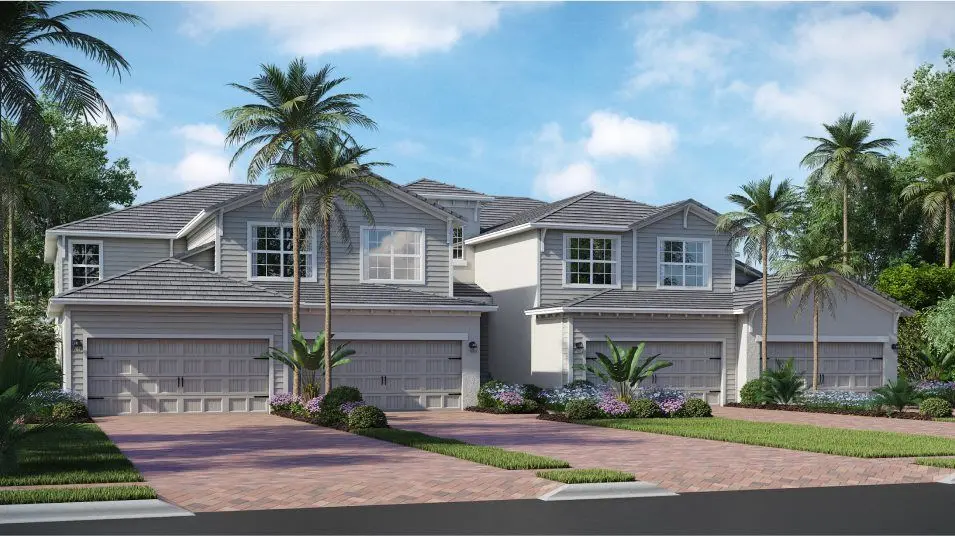
This home comes with a bundled social membership to the club - an exceptional value woven right into your purchase. From the moment you arrive, you're not just a resident; you're a member. Step inside this beautifully designed 1,741 square foot single-story home and discover an open-concept layout that seamlessly connects the dining room, kitchen and living room-perfect for entertaining or relaxing. The kitchen shines with all-new stainless steel appliances, quartz countertops and designer cabinetry, while the spacious Great Room opens to a private lanai through sliding glass doors, inviting you to enjoy indoor-outdoor living. The owner's suite is thoughtfully tucked away for added privacy,
Key facts
- Gated community
- Open layout
- Sliding doors
Tags
Property features AI
Finance
- Other: Address: 5603 Newcastle Ct #5612, Ave Maria, FL 34142; List price: $289,997; Status: Active
Exterior
- Parking: 2 total parking spaces; 2-car garage
- Home design: Spec home, Plan: Arrowhead
Interior
- Bedrooms: 3 bedrooms
- Bathrooms: 2 full bathrooms
- Interior features: Open living area (1,741 total living area)
Neighborhood map
What this means for you Summary
Snapshot
- This is a 3-bed/2.0-bath condo listed at $290k. Condition is rated excellent.
Deal economics
- At list price, monthly cash flow is $578 ($7k/yr) — positive.
- The deal already cash-flows at list — no discount required.
- Meets the 1% rule at list price ($4k rent vs $290k).
Location & tenants
- Location reads: area grade B — affects rentability + tenant quality, not the cash-flow math above.
- Collier (suburban): math 60% / reading 56% proficiency, ranked #16 of 73 in FL (top 22%) — acceptable for families but not a draw, mixed tenant base, ~2y average lease.
- Market conditions: Rents rising (+3.0%/yr); 449 active listings in the ZIP; 40 comparable units currently listed for rent nearby; rentals at typical pace (median 23d on market — plan ~3-4 weeks tenant-placement turnaround); 3,520 units permitted in Collier County in 2024 (959 in 5+ unit buildings).
- At $4,340/mo this rent would consume 84% of the median local household income ($62k/yr) (locally 1093% of renters already pay >50% of income on rent) — very limited rent-growth headroom before tenants either downsize or default.
Forward outlook
- Local home prices are declining (-1.1%/yr); year-one equity from $2k of loan paydown is wiped out by about $3k of value loss. Plan a longer hold.
- Collier County population projected at +30% by 2050 — long-run rental-demand tailwind backs the buy-and-hold thesis.
- At projected returns (-1.1% appreciation + 3.0% rent growth), your $81k cash investment doubles in ~9 years — after that, you're playing with house money.
Negotiation context
- Only 1 days on market — expect competitive offers; lowballing is unlikely to land.
Questions for the listing agent
- What does the HOA fee cover, when was the last increase, and are there any pending special assessments or reserve-fund shortfalls?
- Any open or pending special assessments — roof, HVAC, plumbing, elevator, façade? What's the per-unit balance and payoff schedule, and is the seller paying it off at close or rolling it to the buyer?
- Is there a deadline driving the sale (1031 exchange, divorce, estate, relocation)? That informs how much negotiation room exists.
- What's the average days-on-market for RENTAL listings here right now (not sales)? A rising rental-DOM trend means longer vacancies and softer asking-rent achievability than the comps imply.
- What's the recent tenant-quality profile in this submarket — average credit score on applications, eviction rate, late-payment / NSF rate, and stable-employment percentage? A property-management company in the area should have these aggregated.
- How much new apartment / multifamily construction is in the pipeline within 1–3 miles? Heavy new supply (>2% of stock underway) typically softens rents 12–24 months out; light construction supports rent growth.
Investment metrics
- 1% rule
- 1.50% ✓
- Cap rate
- 8.69%
- Cash-on-cash
- 8.55%
- DSCR
- 1.38
- GRM
- 5.6
CMA / ARV
No comps found within radius.
Projected returns pro-forma
-1.05% appreciation · 2.95% rent growth · sell at horizon
- IRR
- 4.1%
- Equity multiple
- 1.18×
- Total profit
- $14,739
- Equity at exit
- $69,331
- IRR
- 10.7%
- Equity multiple
- 2.04×
- Total profit
- $84,725
- Equity at exit
- $72,233
Cash invested: $81,199 (down + closing). Projections, not guarantees.
Landlord ↔ Tenant lean methodology
- Overall (STATE)
- 87 Strongly Landlord-Friendly
- State Florida
- 87 Strongly Landlord-Friendly · R+3
- County
- — inherits STATE
- City
- — inherits STATE
ZIP-level market 34142
- Home prices YoY
- -0.5%
- Rents YoY
- 3.0%
- Active inventory
- 449
- Price-to-rent
- 5.6×
Monthly cashflow live
- Estimated rent
- $4,340 high interval (Pro) →
- Mortgage (P&I)
- −$1,521
- Tax est. 1.5%
- −$362 /mo · $4,350/yr
- Insurance
- −$121
- HOA
- −$846
- Vacancy / Maint / Mgmt
- −$911
- Net cashflow
- $578
Break-even live
UW: 25.0% down · 7.5% · 30yr · 1.5% tax · 5.0% vac · 8.0% maint · 8.0% mgmt
Financing live
Cash to close
- Down payment
- $72,499
- Closing costs
- $8,700
- Reserves months
- —
- Total cash needed
- —
Loan-product check · same deal, 3 products live
Conventional
25% down · 7.5% · 30yr
- Down + closing
- —
- Monthly P&I
- —
- Monthly cashflow
- —
- DSCR
- —
- Eligible?
- —
Personal DTI + credit; lowest rate.
DSCR
20% down · 8.5% · 30yr
- Down + closing
- —
- Monthly P&I
- —
- Monthly cashflow
- —
- DSCR
- —
- Eligible?
- —
No personal income docs; deal must DSCR.
Hard money
10% down · 12.0% · 12mo
- Down + closing
- —
- Monthly P&I
- —
- Monthly cashflow
- —
- DSCR
- —
- Eligible?
- —
Short-term bridge; refi at stabilization.
Rent comps 40 comps
| Address | Beds | Baths | Sqft | Rent | $/sqft | DOM | Units | Dist |
|---|---|---|---|---|---|---|---|---|
| 5583 Double Eagle Cir Unit 4118 Ave Maria, FL | 3.0 | 2.0 | 1301 | $4,700 | $3.61 | 23d | 1 | 0.10mi |
| 5583 Double Eagle Cir #4135 Ave Maria, FL | 2.0 | 2.0 | 1120 | $2,195 | $1.96 | 23d | 1 | 0.10mi |
| 5583 Double Eagle Cir Unit 4143 Ave Maria, FL | 2.0 | 2.0 | 1120 | $5,795 | $5.17 | 23d | 1 | 0.10mi |
| 5583 Double Eagle Cir #4137 Ave Maria, FL | 2.0 | 2.0 | 1154 | $5,795 | $5.02 | 21d | 1 | 0.10mi |
| 5538 Hampton Links Ct Ave Maria, FL | 3.0 | 3.0 | 2247 | $6,295 | $2.80 | 21d | 1 | 0.10mi |
| 5629 Double Eagle Cir Ave Maria, FL | 2.0 | 2.0 | 1120 | $5,495 | $4.91 | 23d | 1 | 0.10mi |
| 5522 Hampton Links Ct Ave Maria, FL | 2.0 | 2.5 | 1850 | $3,995 | $2.16 | 23d | 1 | 0.10mi |
| 5583 Double Eagle Cir Ave Maria, FL | 2.0 | 2.0 | 1239 | $2,495 | $2.01 | 23d | 1 | 0.11mi |
| 5445 Double Eagle Cir #3013 Ave Maria, FL | 2.0 | 2.0 | 1366 | $2,595 | $1.90 | 21d | 1 | 0.11mi |
| 5445 Double Eagle Cir #3026 Ave Maria, FL | 2.0 | 2.0 | 1569 | $2,350 | $1.50 | 21d | 1 | 0.11mi |
| 5427 Double Eagle Cir #2826 Ave Maria, FL | 2.0 | 2.0 | 1569 | $6,495 | $4.14 | 23d | 1 | 0.12mi |
| 5445 Double Eagle Cir Ave Maria, FL | 2.0 | 2.0 | 1355 | $2,995 | $2.21 | 23d | 1 | 0.12mi |
| 5427 Double Eagle Cir #2825 Ave Maria, FL | 2.0 | 2.0 | 1355 | $6,295 | $4.65 | 23d | 1 | 0.12mi |
| 5427 Double Eagle Cir #2822 Ave Maria, FL | 2.0 | 2.0 | 1355 | $5,795 | $4.28 | 23d | 1 | 0.12mi |
| 5427 Double Eagle Cir #2815 Ave Maria, FL | 2.0 | 2.0 | 1400 | $2,700 | $1.93 | 23d | 1 | 0.12mi |
| 5545 Hampton Links Ct Ave Maria, FL | 4.0 | 3.0 | 2247 | $8,500 | $3.78 | 23d | 1 | 0.13mi |
| 5667 Melbourne Ct #7812 Ave Maria, FL | 3.0 | 2.0 | 1741 | $6,250 | $3.59 | 11d | 1 | 0.13mi |
| 5661 Melbourne Ct #8011 Ave Maria, FL | 3.0 | 2.0 | 1741 | $7,295 | $4.19 | 11d | 1 | 0.14mi |
| 5651 Double Eagle Cir #4318 Ave Maria, FL | 3.0 | 2.0 | 1301 | $2,200 | $1.69 | 21d | 1 | 0.15mi |
| 5651 Double Eagle Cir Unit 1545996P Ave Maria, FL | 2.0 | 2.0 | 1280 | $2,581 | $2.02 | 13d | 1 | 0.15mi |
| 5651 Double Eagle Cir #4323 Ave Maria, FL | 2.0 | 2.0 | 1154 | $5,795 | $5.02 | 21d | 1 | 0.15mi |
| 5715 Double Eagle Cir Unit 4416 1 Ave Maria, FL | 2.0 | 2.0 | 1154 | $2,300 | $1.99 | 23d | 1 | 0.15mi |
| 5715 Double Eagle Cir Unit 4432AVE Ave Maria, FL | 2.0 | 2.0 | 1283 | $2,495 | $1.94 | 23d | 1 | 0.15mi |
| 5651 Double Eagle Cir Ave Maria, FL | 2.0 | 2.0 | 1154 | $2,495 | $2.16 | 23d | 1 | 0.16mi |
| 5555 Double Eagle Cir #3914 Ave Maria, FL | 2.0 | 2.0 | 1120 | $5,795 | $5.17 | 23d | 1 | 0.17mi |
| 5555 Double Eagle Cir #3936 Ave Maria, FL | 2.0 | 2.0 | 1154 | $2,100 | $1.82 | 13d | 1 | 0.17mi |
| 5555 Double Eagle Cir #3918 Ave Maria, FL | 3.0 | 2.0 | 1301 | $5,995 | $4.61 | 23d | 1 | 0.17mi |
| 5555 Double Eagle Cir Unit 3916 Ave Maria, FL | 2.0 | 2.0 | 1154 | $5,950 | $5.16 | 23d | 1 | 0.17mi |
| 5555 Double Eagle Cir #3913 Ave Maria, FL | 2.0 | 2.0 | 1154 | $2,100 | $1.82 | 23d | 1 | 0.17mi |
| 5674 Melbourne Ct Unit 7721 Ave Maria, FL | 3.0 | 2.0 | 2110 | $7,295 | $3.46 | 11d | 1 | 0.17mi |
| 5680 Melbourne Ct #7521 Ave Maria, FL | 3.0 | 2.0 | 2110 | $2,650 | $1.26 | 3d | 1 | 0.17mi |
| 5704 Melbourne Ct Ave Maria, FL | 3.0 | 2.0 | 1741 | $3,995 | $2.29 | 23d | 1 | 0.18mi |
| 5187 Nevola Ave Ave Maria, FL | 3.0 | 2.5 | 1680 | $2,700 | $1.61 | 21d | 1 | 0.20mi |
| 5527 Double Eagle Cir Unit 3838 Ave Maria, FL | 3.0 | 2.0 | 1301 | $2,295 | $1.76 | 23d | 1 | 0.21mi |
| 5527 Double Eagle Cir Unit 3815 Ave Maria, FL | 2.0 | 2.0 | 1120 | $5,795 | $5.17 | 23d | 1 | 0.21mi |
| 5739 Oakmont Ct Ave Maria, FL | 3.0 | 2.0 | 1710 | $3,700 | $2.16 | 23d | 1 | 0.23mi |
| 5739 Oakmont Ct #8412 Ave Maria, FL | 3.0 | 2.0 | 1741 | $7,295 | $4.19 | 23d | 1 | 0.23mi |
| 5376 Fancourt Links Way Ave Maria, FL | 2.0 | 2.5 | 1850 | $6,850 | $3.70 | 21d | 1 | 0.23mi |
| 5412 Fancourt Links Way Ave Maria, FL | 4.0 | 3.0 | 2247 | $8,000 | $3.56 | 21d | 1 | 0.23mi |
| 5715 Double Eagle Cir Ave Maria, FL | 2.0 | 2.0 | 1120 | $3,295 | $2.94 | 23d | 1 | 0.23mi |
HOA detail condo
- Monthly dues
- $846 · $10,152/yr
- Assessments
- None detected in remarks — confirm with the listing agent.
Listing history 7 events
-
2026-06-18days on market $289,997 Active 1 DOM
-
2026-06-18days on market $289,997 Active 5 DOM
-
2026-06-18remarks 699-char remark
-
2026-06-17days on market $289,997 Active 4 DOM
-
2026-06-16days on market $289,997 Active 3 DOM
-
2026-06-15remarks 563-char remark
-
2026-06-15$289,997 Active 2 DOM
ⓘ Source: listings_history table (triggers on properties + properties_extension) + one-shot
backfill from property_details.listing_events for pre-trigger history.
Nearby sold comps map
Loading sold comps map…
Walkable amenities ~0.75 mi
Loading nearby amenities…
Taxation est. · year 1
- Rental income
- $52,078
- − Mortgage interest
- −$16,244
- − Property taxes
- −$4,350
- − Insurance
- −$1,450
- − Repairs & maintenance
- −$4,166
- − Management
- −$4,166
- − HOA
- −$10,152
- − Depreciation
- −$8,436
- Taxable income
- $3,113
- Est. tax owed @ 24.0%
- −$747
- After-tax cash flow
- $6,193/yr
For passive investors: Depreciation is non-cash, so a rental often shows a tax loss while cash-flowing — sheltering income. Rental losses are passive: they offset passive income freely, and up to $25,000/yr can offset ordinary (W-2) income if you actively participate and your MAGI is under $100k (phasing out to $0 by $150k); unused losses carry forward. On sale, claimed depreciation is recaptured at up to 25%, and gains may owe capital-gains tax (a 1031 exchange can defer both). Figures are a year-1 estimate at your 24.0% rate — not tax advice; consult a CPA.
Condition & rehab AI · 6 photos
This beautifully designed single-story townhouse is move-in ready with a stunning kitchen, well-maintained exterior, and a great location. Potential buyers and renters will appreciate the open-concept layout and modern amenities.
Value-add opportunities
- Both Landscaping and curb appeal improvements — Enhances the home's curb appeal and can attract more buyers or renters.
- Both Add a smart home system — Improves convenience and energy efficiency, appealing to modern buyers and renters.
Renovation cost estimate screening
Value-add ROI direction
- Both Landscaping and curb appeal improvements — Enhances the home's curb appeal and can attract more buyers or renters. ↑
- Both Add a smart home system — Improves convenience and energy efficiency, appealing to modern buyers and renters. ↑
ⓘ Cost ranges are severity-bucket heuristics (US national rule-of-thumb). Get contractor quotes + a written scope before underwriting a rehab budget.
Schools (NCES district)
- District
- Collier
- NCES district ID
- 1200330
- Math proficiency
- 60% ▼ -4.00%
- Reading proficiency
- 56% ▼ -2.00%
- Median HH income
- $58,275
- Composite
- 50.23/100
- National rank
- #1892
- State rank
- #16 of 73 in FL
Livability — Ave Maria
No livability data for this city. (Only ~50 U.S. cities are tracked.)
Census & demographics
- Census place
- Ave Maria, FL
- County
- Collier County · 396,295 people
- Metro
- Naples-Marco Island, FL
- Population (ZIP)
- 35,149
- Household income
- $62,333
- Rent vs Own
- Severe rent burden
- 1093.0
Population outlook (Collier County) Hauer SSP2
- Today (2025)
- 420,858 people
- By 2030
- 450,054 · +6.9%
- By 2040
- 502,232 · +19.3%
- By 2050
- 544,932 · +29.5%
- By 2075
- 627,203 · +49.0%
- By 2100
- 659,015 · +56.6%
Race, ethnicity, and origin ACS 2023
- Neighborhood character
- Majority Hispanic (63%)
- Race & ethnicity
- Hispanic / Latino 63% Two or more races 39% Black 19% White 16% Native American 7%
- Hispanic origin (detail)
- Mexican 43% Puerto Rican 3% Cuban 2% Dominican 1%
- Common ancestry
- Hispanic 8% Slovak 1% Serbian 1%
- Foreign-born
- 32% · Canada, Jamaica
- Languages at home
- 34% English-only · Spanish 53% French/Haitian/Cajun 12%
Political lean MEDSL · Collier
- 2024 margin
- Solid R (+33.1) · D 33.1% · R 66.2%
- 2008→2024 swing
- -10.6pp toward R · 2008: -22.5pp · 2024: -33.1pp
- All cycles
- 2024: R+33.1 2020: R+24.7 2016: R+26.0 2012: R+30.1 2008: R+22.5
Not yet ingested
- Civics
- —
Market trends
- HPI YoY
- ▼ -1.05%
- Current HPI
- 226.9105
- Rent YoY
- ▲ 2.95%
- Metro
- Naples-Marco Island, FL
- State GDP YoY
- ▲ 3.28%
- F500 in state
- 36
Industry mix (Fortune 500 HQ in FL)
| Industry | F500 HQs | Revenue |
|---|---|---|
| Industrial Technology | 2 | $29B |
|
||
| Insurance | 2 | $17B |
|
||
| Retail | 1 | $60B |
|
||
| Technology Distribution | 1 | $58B |
|
||
| Homebuilding | 1 | $35B |
|
||
| Technology Manufacturing | 1 | $35B |
|
||
Cash-flow waterfall
monthlySold comps — $/sqft
last 12 mo · ≤1 miLoading sold comps…