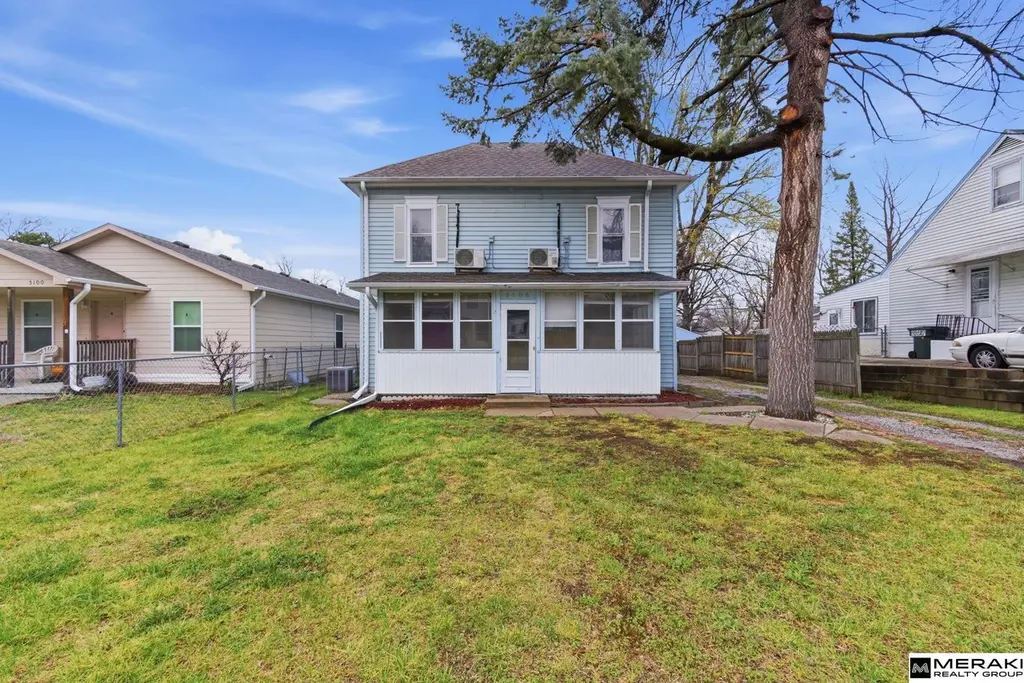
5106 Adams St · Lincoln, NE
Flood risk 1/10 · Minimal
- FEMA flood zone
- X (unshaded)
- Chance of flooding over 30 yrs
- 0.0%
- Est. flood insurance / yr
- $507 – $1,088
Fire risk 2/10 · Minimal
- Est. fire insurance / yr
- $1,161 – $2,155
Heat risk 3/10 · Minor
- Hot days now (above 104°F)
- 7 days/yr
- Hot days in 30 yrs
- 16 days/yr
Wind risk 2/10 · Minimal
- Chance of severe wind over 30 yrs
- —
Air-quality risk 1/10 · Minimal
- Unhealthy air days now
- 0 days/yr
- Unhealthy air days in 30 yrs
- 0 days/yr
Risk factors via First Street. Map © Google.
Why this score? — see what drove the D grade
The composite is a weighted blend of 9 inputs, each scored 0–100. Each bar is that input's sub-score; the figure is the points it added to the 100-point composite (weight × sub-score).
- Cash flow +14.7/30.0
- ARV discount +5.4/15.0
- DSCR +4.5/10.0
- Schools +4.4/10.0
- Livability +4.2/5.0
- 1% rule +3.7/10.0
- Rent growth +2.6/5.0
- Condition / age +2.5/5.0
- Appreciation +0.0/10.0
$215,000
🖨 Deal sheet 📄 Offer letter ✓ Due diligence
Listing remarks MLS
Fall in love with this newly updated 2 story home in University Place. Close to UNL Campus, schools, parks, and more! Enter through the screened in porch to a large foyer/living room with sleek LVP flooring. The kitchen offers plenty of cabinets, brand new countertops, and all new stainless steel appliances! Rounding out the main floor you'll find a large dining area, and an updated full bathroom. New flooring in the kitchen, and bathrooms as well! On the 2nd level you'll find a convenient laundry area, a spacious primary bedroom, and 3 additional bedrooms! Enjoy the back deck with a new railing, large back yard and massive detached 2 car garage backing to the alley make this a steal of a deal at the price! Schedule your showing today!
Key facts
- Screened in porch
- Large foyer
- Sleek lvp flooring
Tags
Neighborhood map
What this means for you Summary
Snapshot
- This is a 4-bed/2.0-bath single-family listed at $215k.
Deal economics
- At list price, monthly cash flow is $54 ($645/yr) — positive.
- The deal already cash-flows at list — no discount required.
- To meet the 1% rule (rent ≥ 1% of price), the offer needs to be $188k (12.7% below list).
- Recommended offer: $188k (12.7% below list) — sets the bar for 1% rule.
- Cap rate 6.6% vs local median 3.0% in Lincoln — top-decile yield for the area; either an underpriced asset or a hidden risk that comps aren't pricing in. Stress-test before assuming the spread holds.
Location & tenants
- Location reads 85/100 on livability (#5 in NE, #545 nationally) — a professional / high-income tenant draw. Strengths: amenities A+, cost of living A+, housing A+; Watch: crime D+.
- Lincoln Public Schools (urban): math 50% / reading 53% proficiency, ranked #59 of 111 in NE (top 53%) — acceptable for families but not a draw, mixed tenant base, ~2y average lease.
- Market conditions: Rents flat; 60 active listings in the ZIP; 8 comparable units currently listed for rent nearby; rentals lingering (median 44d on market — plan ~5-8 weeks vacancy on turnover, expect pricing pressure); 50% of comp listings sitting > 30 days — soft ceiling on asking rent; 1,940 units permitted in Lancaster County in 2024 (895 in 5+ unit buildings).
- This rent runs 40% of the median local income ($56k/yr) — at the standard rent-burdened threshold; future hikes will face affordability resistance.
Forward outlook
- Local home prices are declining (-3.0%/yr); year-one equity from $1k of loan paydown is wiped out by about $6k of value loss. Plan a longer hold.
- Lancaster County population projected at +37% by 2050 — long-run rental-demand tailwind backs the buy-and-hold thesis.
Negotiation context
- It's been on market 36 days — a 3% lower offer ($209k) is reasonable based on typical stale-listing flexibility.
- 5 sale attempts since 29y ago with the ask held roughly flat each time — persistent listings suggest the price (not the market) is what's stuck; bring a comps-based counter.
- Current owner paid $110k; list at $215k implies a 95% gain — meaningful room to come down on a strong offer.
Risks & watch-outs
- Watch-outs: built in 1910 — expect roof / HVAC / electrical / plumbing capex.
Questions for the listing agent
- It's been on market 36 days. Have you received any prior offers? Is the seller open to a 13% concession, seller financing, or rate buy-down credit?
- Built in 1910 — when were the roof, HVAC, electrical panel, plumbing, and water heater last replaced?
- Is there a deadline driving the sale (1031 exchange, divorce, estate, relocation)? That informs how much negotiation room exists.
- Schools are A-rated — typically a magnet for longer-tenancy family renters. What's the average tenant stay here, and is there a school-zone premium baked into asking?
- Crime grade is D in this area — have there been break-ins, vandalism, or insurance claims at this property in the last 3 years? What carrier currently insures it and at what premium?
- The area grade is low — what's the realistic commute time and amenity access for the typical tenant pool here? Any planned neighborhood developments (good or bad) we should know about?
- What's the average days-on-market for RENTAL listings here right now (not sales)? A rising rental-DOM trend means longer vacancies and softer asking-rent achievability than the comps imply.
- What's the recent tenant-quality profile in this submarket — average credit score on applications, eviction rate, late-payment / NSF rate, and stable-employment percentage? A property-management company in the area should have these aggregated.
- How much new for-sale + rental construction is in the pipeline within 1–3 miles? Heavy new supply typically softens prices + rents 12–24 months out; constrained supply supports both.
Investment metrics
- 1% rule
- 0.87% ✗
- Cap rate
- 6.59%
- Cash-on-cash
- 1.07%
- DSCR
- 1.05
- GRM
- 9.5
CMA / ARV
- ARV (median comp)
- $205,600
- List price
- $215,000
- Delta
- 4.57%
- Verdict
- FAIR
- Comps
- 20 within 1.0 mi
Show comp detail 12 sales within ~0.75 mi
| Address | Dist | Beds/Ba | Sqft | Sold | Price | $/sf | Match |
|---|---|---|---|---|---|---|---|
| 5402 Greenwood St | 0.21mi | 4/2.0 | 2,066 (+5%) | 12mo | $265,000 | $128 | 73 |
| 4935 Fremont St | 0.40mi | 3/2.0 (-1) | 1,928 (-2%) | 1mo | $235,000 | $122 | 72 |
| 4915 Fremont St | 0.40mi | 4/2.0 | 1,996 (+1%) | 11mo | $248,700 | $125 | 70 |
| 4604 Madison Ave | 0.38mi | 4/2.5 | 1,817 (-8%) | 0mo | $250,000 | $138 | 67 |
| 5710 Walker Ave | 0.57mi | 4/2.0 | 1,890 (-4%) | 11mo | $238,000 | $126 | 57 |
| 6019 Baldwin Ave | 0.66mi | 3/2.0 (-1) | 1,902 (-4%) | 4mo | $203,500 | $107 | 54 |
| 5442 Greenwood St | 0.25mi | 3/2.0 (-1) | 1,772 (-10%) | 15mo | $223,500 | $126 | 54 |
| 4242 Madison Ave | 0.60mi | 4/2.5 | 1,792 (-9%) | 2mo | $250,000 | $140 | 53 |
| 4630 Colfax Cir | 0.72mi | 3/2.0 (-1) | 1,928 (-2%) | 12mo | $265,000 | $137 | 48 |
| 6034 Baldwin Ave | 0.67mi | 3/2.0 (-1) | 1,901 (-4%) | 15mo | $270,000 | $142 | 46 |
| 4612 Colfax Cir | 0.73mi | 5/3.0 (+1) | 1,819 (-8%) | 11mo | $280,000 | $154 | 35 |
| 6031 Saint Paul Ave | 0.64mi | 3/2.0 (-1) | 2,228 (+13%) | 13mo | $259,900 | $117 | 33 |
Match score weights: distance 35% · size 25% · config 20% · recency 20%. Top-matched comps best support the ARV.
Projected returns pro-forma
-3.0% appreciation · 0.56% rent growth · sell at horizon
- IRR
- -17.3%
- Equity multiple
- 0.40×
- Total profit
- $-35,922
- Equity at exit
- $32,057
- IRR
- -14.4%
- Equity multiple
- 0.26×
- Total profit
- $-44,478
- Equity at exit
- $18,589
Cash invested: $60,200 (down + closing). Projections, not guarantees.
Landlord ↔ Tenant lean methodology
- Overall (STATE)
- 83 Strongly Landlord-Friendly
- State Nebraska
- 83 Strongly Landlord-Friendly · R+13
- County
- — inherits STATE
- City
- — inherits STATE
ZIP-level market 68504
- Rents YoY
- 0.6%
- Active inventory
- 60
- Price-to-rent
- 9.5×
Monthly cashflow live
- Estimated rent
- $1,877 high interval (Pro) →
- Mortgage (P&I)
- −$1,127
- Tax from tax record
- −$212 /mo · $2,542/yr
- Insurance
- −$90
- HOA
- −$0
- Vacancy / Maint / Mgmt
- −$394
- Net cashflow
- $54
Break-even live
UW: 25.0% down · 7.5% · 30yr · 1.5% tax · 5.0% vac · 8.0% maint · 8.0% mgmt
Financing live
Cash to close
- Down payment
- $53,750
- Closing costs
- $6,450
- Reserves months
- —
- Total cash needed
- —
Loan-product check · same deal, 3 products live
Conventional
25% down · 7.5% · 30yr
- Down + closing
- —
- Monthly P&I
- —
- Monthly cashflow
- —
- DSCR
- —
- Eligible?
- —
Personal DTI + credit; lowest rate.
DSCR
20% down · 8.5% · 30yr
- Down + closing
- —
- Monthly P&I
- —
- Monthly cashflow
- —
- DSCR
- —
- Eligible?
- —
No personal income docs; deal must DSCR.
Hard money
10% down · 12.0% · 12mo
- Down + closing
- —
- Monthly P&I
- —
- Monthly cashflow
- —
- DSCR
- —
- Eligible?
- —
Short-term bridge; refi at stabilization.
Rent comps 8 comps
| Address | Beds | Baths | Sqft | Rent | $/sqft | DOM | Units | Dist |
|---|---|---|---|---|---|---|---|---|
| 4842 Adams St Unit 2 Lincoln, NE | 4.0 | 2.5 | 1764 | $2,095 | $1.19 | 43d | 1 | 0.19mi |
| 4602 Saint Paul Ave Unit 3 Lincoln, NE | 4.0 | 1.0 | 1344 | $1,550 | $1.15 | 13d | 1 | 0.44mi |
| 2228 Mirwyn Ct Lincoln, NE | 3.0 | 3.0 | 1748 | $2,200 | $1.26 | 43d | 1 | 0.92mi |
| 2210 Mirwyn Ct Lincoln, NE | 3.0 | 3.0 | 1748 | $2,000 | $1.14 | 13d | 1 | 0.93mi |
| 3811 Baldwin Ave Lincoln, NE | 1.0–3.0 | 1.0–2.0 | 1015 | $1,489 | $1.47 | 13d | 14 | 0.97mi |
| 2840 N Cotner Blvd Unit 1 Lincoln, NE | 3.0 | 1.0 | 1450 | $1,425 | $0.98 | 43d | 1 | 1.00mi |
| 4630 Starr St Unit 4630 Lincoln, NE | 3.0 | 1.0 | 1460 | $1,250 | $0.86 | 43d | 1 | 1.14mi |
| 1025 N 63rd St Lincoln, NE | 1.0–3.0 | 1.0–2.0 | 1157 | $1,590 | $1.37 | 13d | 7 | 1.36mi |
Listing history 14 events
-
2026-05-10status Pending 745-char remark
Show marketing remark (745 chars)
Fall in love with this newly updated 2 story home in University Place. Close to UNL Campus, schools, parks, and more! Enter through the screened in porch to a large foyer/living room with sleek LVP flooring. The kitchen offers plenty of cabinets, brand new countertops, and all new stainless steel appliances! Rounding out the main floor you'll find a large dining area, and an updated full bathroom. New flooring in the kitchen, and bathrooms as well! On the 2nd level you'll find a convenient laundry area, a spacious primary bedroom, and 3 additional bedrooms! Enjoy the back deck with a new railing, large back yard and massive detached 2 car garage backing to the alley make this a steal of a deal at the price! Schedule your showing today!
-
2026-04-30price $215,000 745-char remark
Show marketing remark (745 chars)
Fall in love with this newly updated 2 story home in University Place. Close to UNL Campus, schools, parks, and more! Enter through the screened in porch to a large foyer/living room with sleek LVP flooring. The kitchen offers plenty of cabinets, brand new countertops, and all new stainless steel appliances! Rounding out the main floor you'll find a large dining area, and an updated full bathroom. New flooring in the kitchen, and bathrooms as well! On the 2nd level you'll find a convenient laundry area, a spacious primary bedroom, and 3 additional bedrooms! Enjoy the back deck with a new railing, large back yard and massive detached 2 car garage backing to the alley make this a steal of a deal at the price! Schedule your showing today!
-
2026-04-03$225,000 New 745-char remark
Show marketing remark (745 chars)
Fall in love with this newly updated 2 story home in University Place. Close to UNL Campus, schools, parks, and more! Enter through the screened in porch to a large foyer/living room with sleek LVP flooring. The kitchen offers plenty of cabinets, brand new countertops, and all new stainless steel appliances! Rounding out the main floor you'll find a large dining area, and an updated full bathroom. New flooring in the kitchen, and bathrooms as well! On the 2nd level you'll find a convenient laundry area, a spacious primary bedroom, and 3 additional bedrooms! Enjoy the back deck with a new railing, large back yard and massive detached 2 car garage backing to the alley make this a steal of a deal at the price! Schedule your showing today!
-
2020-03-06soldstatus $110,000 26-char remark
Show marketing remark (26 chars)
Sold. Input for stats only
-
2020-03-06soldstatus $110,000
Show marketing remark (26 chars)
Sold. Input for stats only
-
2020-02-03$115,000 26-char remark
Show marketing remark (26 chars)
Sold. Input for stats only
-
2017-12-21soldstatus $90,000
-
2017-11-21historical
-
2017-08-25$105,000
-
2017-08-23historical
-
2017-06-23$114,900
-
2003-05-19soldstatus $80,000
-
1997-11-27historical
-
1997-07-18$70,000
ⓘ Source: listings_history table (triggers on properties + properties_extension) + one-shot
backfill from property_details.listing_events for pre-trigger history.
Tax reassessment forecast NE · Resets to sale price
- Current annual tax
- $2,542 · $212/mo
- Projected year-2 tax
- $3,720 · $310/mo
- Expected delta
- +$1,178/yr (+$98/mo · 46.3%)
ⓘ Screening estimate from a state-policy table — verify with the county assessor before closing.
Climate risk First Street
- Flood 1/10 Low FEMA zone X (unshaded) · 0% chance over 30 yrs
- Wildfire 2/10 Low
- Heat 3/10 Moderate 7 d/yr ≥104°F today · 16 d/yr by 30 yrs out
- Wind 2/10 Low
- Air quality 1/10 Low 0 unhealthy d/yr today · 0 by 30 yrs out
Nearby sold comps map
Loading sold comps map…
Walkable amenities ~0.75 mi
Loading nearby amenities…
Taxation est. · year 1
- Rental income
- $22,520
- − Mortgage interest
- −$12,043
- − Property taxes
- −$2,542
- − Insurance
- −$1,075
- − Repairs & maintenance
- −$1,802
- − Management
- −$1,802
- − Depreciation
- −$6,255
- Taxable loss
- −$2,997
- Est. tax savings @ 24.0%
- +$719
- After-tax cash flow
- $1,364/yr
For passive investors: Depreciation is non-cash, so a rental often shows a tax loss while cash-flowing — sheltering income. Rental losses are passive: they offset passive income freely, and up to $25,000/yr can offset ordinary (W-2) income if you actively participate and your MAGI is under $100k (phasing out to $0 by $150k); unused losses carry forward. On sale, claimed depreciation is recaptured at up to 25%, and gains may owe capital-gains tax (a 1031 exchange can defer both). Figures are a year-1 estimate at your 24.0% rate — not tax advice; consult a CPA.
Schools (NCES district)
- District
- Lincoln Public Schools
- NCES district ID
- 3172840
- Math proficiency
- 50% ▼ -6.00%
- Reading proficiency
- 53% ▼ -3.00%
- Median HH income
- $50,273
- Composite
- 44.05/100
- National rank
- #2880
- State rank
- #59 of 111 in NE
Livability — Lincoln
- Score
- 85/100
- State rank
- #5
- US rank
- #545
Category grades
Schools grade is shown separately in the Schools card above.
Census & demographics
- Census place
- Lincoln, NE
- County
- Lancaster County · 291,509 people
- City population
- 291,509
- Metro
- Lincoln, NE
- Population (ZIP)
- 17,278
- Household income
- $56,213
- Rent vs Own
- Severe rent burden
- 1076.0
Population outlook (Lancaster County) Hauer SSP2
- Today (2025)
- 352,806 people
- By 2030
- 377,899 · +7.1%
- By 2040
- 428,582 · +21.5%
- By 2050
- 483,103 · +36.9%
- By 2075
- 632,390 · +79.2%
- By 2100
- 759,513 · +115.3%
Race, ethnicity, and origin ACS 2023
- Neighborhood character
- Predominantly White (71%)
- Race & ethnicity
- White 71% Hispanic / Latino 9% Two or more races 9% Black 7% Asian 5% Native American 1%
- Hispanic origin (detail)
- Mexican 7%
- Common ancestry
- Romanian 4% Lithuanian 2% Portuguese 2%
- Foreign-born
- 10% · Canada, South Korea, Vietnam
- Languages at home
- 86% English-only · Spanish 4% Other Indo-European 4% Arabic 2%
Political lean MEDSL · Lancaster
- 2024 margin
- Toss-up / Even · D 51.4% · R 47.1% · Other 1.5%
- 2008→2024 swing
- -0.7pp no change · 2008: 5.0pp · 2024: 4.3pp
- All cycles
- 2024: D+4.3 2020: D+7.8 2016: D+0.1 2012: R+1.0 2008: D+5.0
Not yet ingested
- Civics
- —
Market trends
- HPI YoY
- ▼ -157.10%
- Current HPI
- 246.8013
- Rent YoY
- ▲ 0.56%
- Metro
- Lincoln, NE
- State GDP YoY
- ▲ 0.68%
- F500 in state
- 2
Industry mix (Fortune 500 HQ in NE)
| Industry | F500 HQs | Revenue |
|---|---|---|
| Conglomerate | 1 | $371B |
|
||
Price history
+207.1% since first listed14 events — show timeline
- 2026-05-10 Pending — GPRMLS
- 2026-04-30 Price Changed $215,000 GPRMLS
- 2026-04-03 Listed $225,000 GPRMLS
- 2020-03-06 Sold (Public Records) $110,000 Public Records
- 2020-03-06 Sold (MLS) $110,000 GPRMLS
- 2020-02-03 Listed $115,000 GPRMLS
- 2017-12-21 Sold (MLS) $90,000 GPRMLS
- 2017-11-21 Listing Removed — GPRMLS
- 2017-08-25 Listed $105,000 GPRMLS
- 2017-08-23 Listing Removed — GPRMLS
- 2017-06-23 Listed $114,900 GPRMLS
- 2003-05-19 Sold (Public Records) $80,000 Public Records
- 1997-11-27 Listing Removed — GPRMLS
- 1997-07-18 Listed $70,000 GPRMLS
Property tax history
+9.9%/yrLatest (2025): $2,542 · +2.2% YoY. Source: county tax records.
Cash-flow waterfall
monthlySold comps — $/sqft
last 12 mo · ≤1 miLoading sold comps…