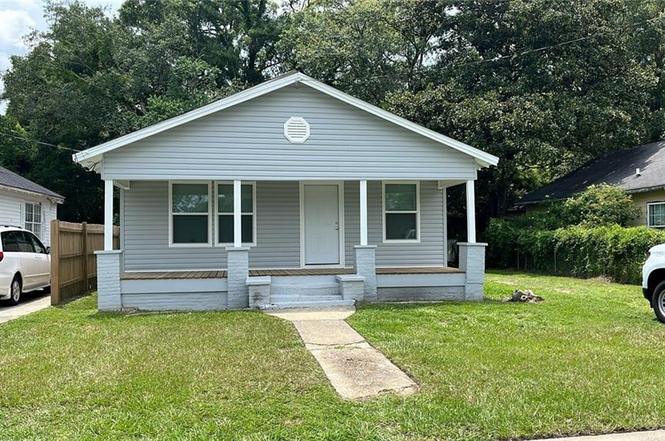
554 Cherokee St · Mobile, AL
Flood risk 1/10 · Minimal
- FEMA flood zone
- X (unshaded)
- Chance of flooding over 30 yrs
- 0.0%
- Est. flood insurance / yr
- $507 – $1,088
Fire risk 1/10 · Minimal
- Est. fire insurance / yr
- $916 – $1,700
Heat risk 9/10 · Severe
- Hot days now (above 105°F)
- 7 days/yr
- Hot days in 30 yrs
- 21 days/yr
Wind risk 9/10 · Severe
- Chance of severe wind over 30 yrs
- 99.0%
Air-quality risk 2/10 · Minimal
- Unhealthy air days now
- 1 days/yr
- Unhealthy air days in 30 yrs
- 1 days/yr
Risk factors via First Street. Map © Google.
Why this score? — see what drove the B- grade
The composite is a weighted blend of 9 inputs, each scored 0–100. Each bar is that input's sub-score; the figure is the points it added to the 100-point composite (weight × sub-score).
- Cash flow +30.0/30.0
- DSCR +10.0/10.0
- 1% rule +8.5/10.0
- ARV discount +7.5/15.0
- Rent growth +3.8/5.0
- Livability +3.8/5.0
- Condition / age +2.5/5.0
- Schools +2.3/10.0
- Appreciation +0.0/10.0
$99,900
🖨 Deal sheet 📄 Offer letter ✓ Due diligence
Listing remarks
Fully renovated rental home, turn key For Sale! This property has been fully renovated for piece of mind in the future. This newly remodeled rental property includes updates such as; new architectural roof, new vinyl siding, new luxury vinyl plank flooring, new central heat and air system, new water heater, new windows, new doors throughout, new kitchen cabinets, countertops and appliances, new bathroom vanity, new plumbing/electrical finishings and new paint/trim. Right now the home is rented under the affordable housing program at $1,027, which is almost all paid by HUD. Fair market rent is $1,250+ with no additional property renovations to achieve fair market rent. Call your Realtor to s
Key facts
- Fully renovated
- New doors
- New water heater
Tags
Neighborhood map
What this means for you Summary
Snapshot
- This is a 3-bed/2.0-bath single-family listed at $100k.
Deal economics
- At list price, monthly cash flow is $453 ($5k/yr) — positive.
- The deal already cash-flows at list — no discount required.
- Meets the 1% rule at list price ($1k rent vs $100k).
- Recommended offer: $98k (1.5% below list) — sets the bar for market timing.
- Cap rate 11.7% vs local median 4.9% in Mobile — top-decile yield for the area; either an underpriced asset or a hidden risk that comps aren't pricing in. Stress-test before assuming the spread holds.
Location & tenants
- Location reads 75/100 on livability (#20 in AL, #4,262 nationally) — a middle-class / working-renter tenant base. Strengths: commute A+, cost of living A+, housing A+; Watch: schools D-, crime F, employment D-.
- Mobile County (urban): math 15% / reading 39% proficiency, ranked #81 of 129 in AL (top 63%) — low school quality limits family demand, transient renter base, plan for 1-2y turnover; 67% free/reduced lunch — lower-income household profile, screen leases tightly.
- Market conditions: Rents rising fast (+5.1%/yr); 174 active listings in the ZIP; 33 comparable units currently listed for rent nearby; rentals lingering (median 44d on market — plan ~5-8 weeks vacancy on turnover, expect pricing pressure); 61% of comp listings sitting > 30 days — soft ceiling on asking rent; 1,678 units permitted in Mobile County in 2024 (264 in 5+ unit buildings).
- This rent runs 32% of the median local income ($51k/yr) — at the standard rent-burdened threshold; future hikes will face affordability resistance.
Forward outlook
- Local home prices are declining (-3.0%/yr); year-one equity from $691 of loan paydown is wiped out by about $3k of value loss. Plan a longer hold.
- Mobile County population projected to shrink 8% by 2050 — rents likely to lag national; underwrite the cash flow, not the appreciation.
- At projected returns (-3.0% appreciation + 5.1% rent growth), your $28k cash investment doubles in ~6 years — after that, you're playing with house money.
Negotiation context
- It's been on market 29 days — a 2% lower offer ($98k) is reasonable based on typical stale-listing flexibility.
- 2 sale attempts since 2y ago; this cycle's ask is 7892% above the opening price — seller raised mid-cycle; expect resistance to lowballs.
Risks & watch-outs
- Climate carrying-cost: severe wind risk, 99% chance of damaging wind over 30y; extreme-heat days projected 7→21/yr by 2055 (HVAC capex compounding) — expect insurance premiums to compound above CPI over the hold.
Questions for the listing agent
- Is there a deadline driving the sale (1031 exchange, divorce, estate, relocation)? That informs how much negotiation room exists.
- Schools are D-rated, which usually means shorter tenancies and higher turnover. Who's the typical renter profile here, and what's been the actual vacancy rate?
- Crime grade is F in this area — have there been break-ins, vandalism, or insurance claims at this property in the last 3 years? What carrier currently insures it and at what premium?
- What's the average days-on-market for RENTAL listings here right now (not sales)? A rising rental-DOM trend means longer vacancies and softer asking-rent achievability than the comps imply.
- What's the recent tenant-quality profile in this submarket — average credit score on applications, eviction rate, late-payment / NSF rate, and stable-employment percentage? A property-management company in the area should have these aggregated.
- How much new for-sale + rental construction is in the pipeline within 1–3 miles? Heavy new supply typically softens prices + rents 12–24 months out; constrained supply supports both.
Investment metrics
- 1% rule
- 1.35% ✓
- Cap rate
- 11.74%
- Cash-on-cash
- 19.44%
- DSCR
- 1.87
- GRM
- 6.2
CMA / ARV
- ARV (median comp)
- $60,187
- List price
- $99,900
- Delta
- 65.98%
- Verdict
- OVERPRICED
- Comps
- 20 within 1.0 mi
Show comp detail 12 sales within ~0.75 mi
| Address | Dist | Beds/Ba | Sqft | Sold | Price | $/sf | Match |
|---|---|---|---|---|---|---|---|
| 1805 Woodcock Pl | 0.34mi | 3/2.0 | 1,233 (-1%) | 4mo | $195,000 | $158 | 79 |
| 1809 Woodcock Pl | 0.34mi | 3/2.0 | 1,210 (-3%) | 4mo | $195,000 | $161 | 76 |
| 503 Dauphin Island Pkwy | 0.14mi | 2/1.0 (-1) | 1,159 (-7%) | 3mo | $40,500 | $35 | 70 |
| 710 Euclid Ave | 0.54mi | 3/2.0 | 1,222 (-2%) | 4mo | $139,000 | $114 | 68 |
| 1809 Calmes St | 0.18mi | 4/2.0 (+1) | 1,420 (+14%) | 0mo | $45,000 | $32 | 63 |
| 603 Glenwood St | 0.33mi | 3/1.0 | 1,400 (+12%) | 4mo | $137,000 | $98 | 57 |
| 1017 Houston St | 0.35mi | 3/2.0 | 1,435 (+15%) | 3mo | $24,900 | $17 | 56 |
| 210 Houston St | 0.53mi | 2/1.0 (-1) | 1,182 (-5%) | 2mo | $155,000 | $131 | 56 |
| 616 Morgan Ave | 0.66mi | 3/2.0 | 1,150 (-8%) | 3mo | $42,000 | $37 | 54 |
| 1709 Belfast St | 0.44mi | 3/2.0 | 1,078 (-14%) | 4mo | $31,250 | $29 | 54 |
| 417 Crenshaw St | 0.43mi | 4/1.0 (+1) | 1,426 (+14%) | 3mo | $48,000 | $34 | 45 |
| 165 S Fulton St | 0.68mi | 2/1.0 (-1) | 1,085 (-13%) | 1mo | $261,000 | $241 | 37 |
Match score weights: distance 35% · size 25% · config 20% · recency 20%. Top-matched comps best support the ARV.
Projected returns pro-forma
-3.0% appreciation · 5.06% rent growth · sell at horizon
- IRR
- 13.6%
- Equity multiple
- 1.55×
- Total profit
- $15,508
- Equity at exit
- $14,895
- IRR
- 23.8%
- Equity multiple
- 3.25×
- Total profit
- $62,804
- Equity at exit
- $8,638
Cash invested: $27,972 (down + closing). Projections, not guarantees.
Landlord ↔ Tenant lean methodology
- Overall (STATE)
- 90 Strongly Landlord-Friendly
- State Alabama
- 90 Strongly Landlord-Friendly · R+15
- County
- — inherits STATE
- City
- — inherits STATE
ZIP-level market 36606
- Rents YoY
- 5.1%
- Active inventory
- 174
- Price-to-rent
- 6.2×
Monthly cashflow live
- Estimated rent
- $1,352 high interval (Pro) →
- Mortgage (P&I)
- −$524
- Tax from tax record
- −$49 /mo · $593/yr
- Insurance
- −$42
- HOA
- −$0
- Vacancy / Maint / Mgmt
- −$284
- Net cashflow
- $453
Break-even live
UW: 25.0% down · 7.5% · 30yr · 1.5% tax · 5.0% vac · 8.0% maint · 8.0% mgmt
Financing live
Cash to close
- Down payment
- $24,975
- Closing costs
- $2,997
- Reserves months
- —
- Total cash needed
- —
Loan-product check · same deal, 3 products live
Conventional
25% down · 7.5% · 30yr
- Down + closing
- —
- Monthly P&I
- —
- Monthly cashflow
- —
- DSCR
- —
- Eligible?
- —
Personal DTI + credit; lowest rate.
DSCR
20% down · 8.5% · 30yr
- Down + closing
- —
- Monthly P&I
- —
- Monthly cashflow
- —
- DSCR
- —
- Eligible?
- —
No personal income docs; deal must DSCR.
Hard money
10% down · 12.0% · 12mo
- Down + closing
- —
- Monthly P&I
- —
- Monthly cashflow
- —
- DSCR
- —
- Eligible?
- —
Short-term bridge; refi at stabilization.
Rent comps 33 comps
| Address | Beds | Baths | Sqft | Rent | $/sqft | DOM | Units | Dist |
|---|---|---|---|---|---|---|---|---|
| 561 Dauphin Island Pkwy Mobile, AL | 4.0 | 2.0 | 1389 | $1,050 | $0.76 | 43d | 1 | 0.11mi |
| 611 Dauphin Island Pkwy Mobile, AL | 3.0 | 2.0 | 1450 | $1,300 | $0.90 | 43d | 1 | 0.14mi |
| 706 Cherokee St Mobile, AL | 3.0 | 1.0 | 1260 | $1,375 | $1.09 | 21d | 1 | 0.30mi |
| 562 Clarke St Mobile, AL | 2.0 | 1.0 | 1061 | $1,025 | $0.97 | 43d | 1 | 0.39mi |
| 618 Clarke St Mobile, AL | 3.0 | 1.0 | 1427 | $1,200 | $0.84 | 43d | 1 | 0.49mi |
| 615 Mohawk St Mobile, AL | 3.0 | 1.0 | 1172 | $1,500 | $1.28 | 43d | 1 | 0.49mi |
| 400 Westwood St Mobile, AL | 1.0–2.0 | 1.0 | 750 | $1,005 | $1.34 | 43d | 1 | 0.56mi |
| 728 Bankhead Pl Mobile, AL | 2.0 | 1.0 | 810 | $675 | $0.83 | 43d | 1 | 0.59mi |
| 2008 W Victory Dr Mobile, AL | 3.0 | 1.0 | 1011 | $1,200 | $1.19 | 43d | 1 | 0.61mi |
| 209 S Fulton St Mobile, AL | 2.0 | 1.5 | 1255 | $1,750 | $1.39 | 21d | 1 | 0.64mi |
| 182 Williams St Unit 1043570P Mobile, AL | 3.0 | 1.0 | 1399 | $2,476 | $1.77 | 13d | 1 | 0.65mi |
| 122 Demouy Ave Unit 1/2 Mobile, AL | 2.0 | 1.0 | 1300 | $1,530 | $1.18 | 43d | 1 | 0.69mi |
| 2068 Victory Ct Mobile, AL | 4.0 | 1.0 | 1259 | $1,225 | $0.97 | 43d | 1 | 0.76mi |
| 767 Jemison St Mobile, AL | 2.0 | 1.0 | 850 | $750 | $0.88 | 43d | 1 | 0.78mi |
| 817 Hawkins St Mobile, AL | 3.0 | 1.0 | 1217 | $1,200 | $0.99 | 43d | 1 | 0.93mi |
| 1704 McGill Ave Unit B Mobile, AL | 3.0 | 2.5 | 1500 | $1,750 | $1.17 | 43d | 1 | 1.00mi |
| 2503 Richard Ave Mobile, AL | 2.0 | 1.0 | 928 | $805 | $0.87 | 13d | 1 | 1.05mi |
| 104 Ellinor St Mobile, AL | 2.0 | 1.0 | 896 | $1,275 | $1.42 | 21d | 1 | 1.05mi |
| 1417 Monroe St Mobile, AL | 2.0 | 1.0 | 1064 | $1,350 | $1.27 | 43d | 1 | 1.06mi |
| 900 Courtney St Mobile, AL | 2.0 | 1.0 | 1020 | $1,200 | $1.18 | 43d | 1 | 1.08mi |
| 84 S Lafayette St Unit 1043577P Mobile, AL | 3.0 | 2.0 | 1496 | $3,116 | $2.08 | 13d | 1 | 1.08mi |
| 2500 Taylor Ave Mobile, AL | 2.0 | 1.0 | 840 | $1,195 | $1.42 | 43d | 1 | 1.09mi |
| 2507 Taylor Ave Mobile, AL | 3.0 | 1.0 | 1230 | $1,495 | $1.22 | 13d | 1 | 1.10mi |
| 111 S Catherine St Mobile, AL | 2.0 | 1.0 | 891 | $899 | $1.01 | 43d | 1 | 1.10mi |
| 2656 Pathway Pl Mobile, AL | 2.0–3.0 | 1.0 | 778 | $1,261 | $1.62 | 13d | 9 | 1.17mi |
| 200 S Florida St Unit 101 Mobile, AL | 2.0 | 2.0 | 1150 | $1,375 | $1.20 | 21d | 1 | 1.19mi |
| 1204 Seneca St Mobile, AL | 3.0 | 2.0 | 1425 | $1,345 | $0.94 | 13d | 1 | 1.21mi |
| 418 Durande Dr Mobile, AL | 3.0 | 2.0 | 1456 | $1,350 | $0.93 | 13d | 1 | 1.25mi |
| 1566 Dauphin St Unit Back Carriage House Mobile, AL | 3.0 | 1.0 | 1300 | $1,200 | $0.92 | 43d | 1 | 1.28mi |
| 129 Shell Road Pl Unit 1043713P Mobile, AL | 4.0 | 2.0 | 1496 | $3,389 | $2.27 | 21d | 1 | 1.32mi |
| 955 Cloverdale Dr Mobile, AL | 3.0 | 1.5 | 1128 | $1,125 | $1.00 | 43d | 1 | 1.38mi |
| 461 Magnolia Rd Unit A Mobile, AL | 2.0 | 1.0 | 989 | $825 | $0.83 | 43d | 1 | 1.49mi |
| 107 Grand Blvd Mobile, AL | 2.0 | 2.0 | 1200 | $1,295 | $1.08 | 21d | 1 | 1.50mi |
Listing history 5 events
-
2026-05-01price $99,900
-
2025-07-14historical $1,250
-
2025-07-04$1,250
-
2024-08-02historical $1,200
-
2024-07-19$1,200
ⓘ Source: listings_history table (triggers on properties + properties_extension) + one-shot
backfill from property_details.listing_events for pre-trigger history.
Tax reassessment forecast AL · Resets to sale price
- Current annual tax
- $593 · $49/mo
- Projected year-2 tax
- $593 · $49/mo
- Expected delta
- $0/yr ($0/mo · 0.0%)
ⓘ Screening estimate from a state-policy table — verify with the county assessor before closing.
Climate risk First Street
- Flood 1/10 Low FEMA zone X (unshaded) · 0% chance over 30 yrs
- Wildfire 1/10 Low
- Heat 9/10 Extreme 7 d/yr ≥105°F today · 21 d/yr by 30 yrs out
- Wind 9/10 Extreme 99% chance of damaging wind over 30 yrs
- Air quality 2/10 Low 1 unhealthy d/yr today · 1 by 30 yrs out
Nearby sold comps map
Loading sold comps map…
Walkable amenities ~0.75 mi
Loading nearby amenities…
Taxation est. · year 1
- Rental income
- $16,224
- − Mortgage interest
- −$5,596
- − Property taxes
- −$593
- − Insurance
- −$500
- − Repairs & maintenance
- −$1,298
- − Management
- −$1,298
- − Depreciation
- −$2,906
- Taxable income
- $4,034
- Est. tax owed @ 24.0%
- −$968
- After-tax cash flow
- $4,470/yr
For passive investors: Depreciation is non-cash, so a rental often shows a tax loss while cash-flowing — sheltering income. Rental losses are passive: they offset passive income freely, and up to $25,000/yr can offset ordinary (W-2) income if you actively participate and your MAGI is under $100k (phasing out to $0 by $150k); unused losses carry forward. On sale, claimed depreciation is recaptured at up to 25%, and gains may owe capital-gains tax (a 1031 exchange can defer both). Figures are a year-1 estimate at your 24.0% rate — not tax advice; consult a CPA.
Schools (NCES district)
- District
- Mobile County
- NCES district ID
- 0102370
- Math proficiency
- 15% ▼ -28.00%
- Reading proficiency
- 39% ▬ 0.00%
- Median HH income
- $42,455
- Composite
- 22.9/100
- National rank
- #8002
- State rank
- #81 of 129 in AL
Livability — Mobile
- Score
- 75/100
- State rank
- #20
- US rank
- #4262
Category grades
Schools grade is shown separately in the Schools card above.
Census & demographics
- Census place
- Mobile, AL
- County
- Mobile County · 246,577 people
- City population
- 205,729
- Metro
- Mobile, AL
- Population (ZIP)
- 18,728
- Household income
- $51,303
- Rent vs Own
- Severe rent burden
- 999.0
Population outlook (Mobile County) Hauer SSP2
- Today (2025)
- 415,303 people
- By 2030
- 411,755 · -0.9%
- By 2040
- 399,670 · -3.8%
- By 2050
- 382,616 · -7.9%
- By 2075
- 337,353 · -18.8%
- By 2100
- 283,391 · -31.8%
Race, ethnicity, and origin ACS 2023
- Neighborhood character
- Majority Black (56%)
- Race & ethnicity
- Black 56% White 37% Two or more races 5% Hispanic / Latino 4%
- Common ancestry
- Italian 2% Scottish 2% Lithuanian 1%
- Foreign-born
- 3% · Canada
- Languages at home
- 96% English-only · Spanish 3%
Political lean MEDSL · Mobile
- 2024 margin
- R (+16.4) · D 41.3% · R 57.7%
- 2008→2024 swing
- -7.7pp toward R · 2008: -8.7pp · 2024: -16.4pp
- All cycles
- 2024: R+16.4 2020: R+11.9 2016: R+13.9 2012: R+9.3 2008: R+8.7
Not yet ingested
- Civics
- —
Market trends
- HPI YoY
- ▼ -232.19%
- Current HPI
- 145.9025
- Rent YoY
- ▲ 5.06%
- Metro
- Mobile, AL
- State GDP YoY
- ▲ 2.94%
- F500 in state
- 4
Industry mix (Fortune 500 HQ in AL)
| Industry | F500 HQs | Revenue |
|---|---|---|
| Financial Services | 1 | $8B |
|
||
| Healthcare | 1 | $5B |
|
||
Price history
+8225.0% since first listed5 events — show timeline
- 2026-05-01 Price Changed $99,900 GCMLS AL
- 2025-07-14 Rental Removed $1,250 APPFOLIO
- 2025-07-04 Listed for Rent $1,250 APPFOLIO
- 2024-08-02 Rental Removed $1,200 APPFOLIO
- 2024-07-19 Listed for Rent $1,200 APPFOLIO
Property tax history
+1.4%/yrLatest (2025): $593 · +0.0% YoY. Source: county tax records.
Cash-flow waterfall
monthlySold comps — $/sqft
last 12 mo · ≤1 miLoading sold comps…