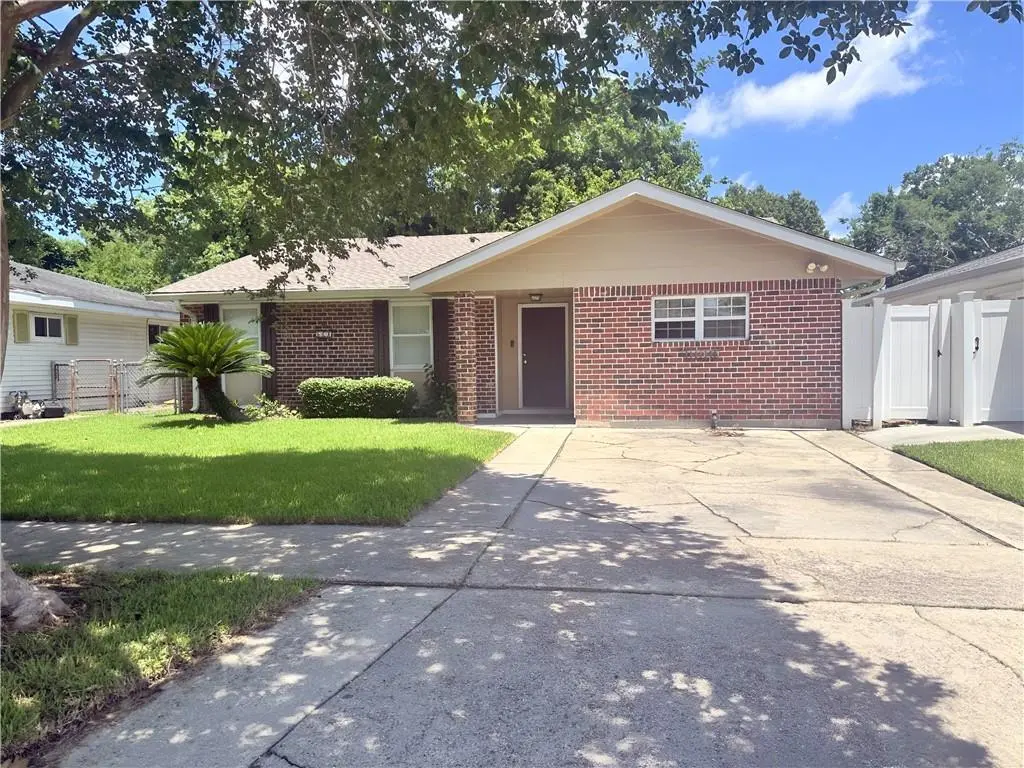
668 Cameron Ct · Kenner, LA
Flood risk No data
- FEMA flood zone
- —
- Chance of flooding over 30 yrs
- —
- Est. flood insurance / yr
- —
Fire risk No data
- Est. fire insurance / yr
- —
Heat risk No data
- Hot days now (above threshold)
- —
- Hot days in 30 yrs
- —
Wind risk No data
- Chance of severe wind over 30 yrs
- —
Air-quality risk No data
- Unhealthy air days now
- —
- Unhealthy air days in 30 yrs
- —
Risk factors via First Street. Map © Google.
Why this score? — see what drove the D- grade
The composite is a weighted blend of 9 inputs, each scored 0–100. Each bar is that input's sub-score; the figure is the points it added to the 100-point composite (weight × sub-score).
- Cash flow +16.4/30.0
- DSCR +5.1/10.0
- Livability +3.9/5.0
- 1% rule +3.4/10.0
- ARV discount +3.2/15.0
- Schools +2.5/10.0
- Condition / age +2.5/5.0
- Rent growth +1.5/5.0
- Appreciation +0.0/10.0
$230,000
🖨 Deal sheet (PDF) 📄 Offer letter ✓ Due diligence
Listing remarks MLS
This cozy 4-bedroom, 2-bath home in the Holly Heights Subdivision features a spacious open kitchen with an adjoining dining area that flows into a large living room. French doors lead to a covered patio, and the home includes convenient inside laundry. Located just minutes from shopping, schools, hospitals, and major interstates, this home provides easy access to everyday conveniences."
Key facts
- Easy access
- Dining area
- Covered patio
Tags
Property features AI
Exterior
- Parking: Driveway
- Utilities: Public water; Public sewer
- Home design: Single-story; Brick construction; Shingle roof; Slab foundation
- Construction: Built with brick
- Exterior features: Covered porch/patio; Shed(s); City lot; Rectangular lot (50 x 100)
Interior
- Kitchen: Dishwasher; Microwave; Oven; Range; Refrigerator
- Bathrooms: 2 full bathrooms
- Heating & cooling: Central heating; Central air conditioning
- Interior features: 6 total rooms; Average condition
- Laundry & utility: Washer; Dryer
Neighborhood map
What this means for you Summary
Snapshot
- This is a 4-bed/2.0-bath single-family listed at $230k.
Deal economics
- At list price, monthly cash flow is $130 ($2k/yr) — positive.
- The deal already cash-flows at list — no discount required.
- To meet the 1% rule (rent ≥ 1% of price), the offer needs to be $193k (16.0% below list).
- Recommended offer: $193k (16.0% below list) — sets the bar for 1% rule.
- Cap rate 7.0% vs local median 5.3% in Kenner — top-decile yield for the area; either an underpriced asset or a hidden risk that comps aren't pricing in. Stress-test before assuming the spread holds.
Location & tenants
- Location reads 78/100 on livability (#6 in LA, #2,414 nationally) — a middle-class / working-renter tenant base. Strengths: cost of living A+, housing A+, health & safety A+; Watch: amenities C-, employment C-, crime D.
- Jefferson Parish (suburban): math 24% / reading 34% proficiency, ranked #44 of 98 in LA (top 45%) — low school quality limits family demand, transient renter base, plan for 1-2y turnover; 70% free/reduced lunch — lower-income household profile, screen leases tightly.
- Zoned schools: A.C. Alexander School (math 26% / reading 39%, grade F, #300 of 646 statewide, top 47%, 680 students, 59% FRL); Tom Benson School (math 11% / reading 14%, grade F, #546 of 646 statewide, top 85%, 753 students, 60% FRL); Bonnabel Magnet Academy High School (math 12% / reading 21%, grade F, #214 of 265 statewide, top 81%, 1,478 students, 52% FRL).
- Market conditions: Rents falling (-4.2%/yr); 294 active listings in the ZIP; 36 comparable units currently listed for rent nearby; rentals at typical pace (median 23d on market — plan ~3-4 weeks tenant-placement turnaround); 518 units permitted in Jefferson Parish in 2024 (43 in 5+ unit buildings).
- This rent runs 34% of the median local income ($67k/yr) — at the standard rent-burdened threshold; future hikes will face affordability resistance.
Forward outlook
- Local home prices are declining (-3.0%/yr); year-one equity from $2k of loan paydown is wiped out by about $7k of value loss. Plan a longer hold.
Negotiation context
- It's been on market 24 days — a 2% lower offer ($227k) is reasonable based on typical stale-listing flexibility.
- 4 sale attempts since 27y ago with the ask held roughly flat each time — persistent listings suggest the price (not the market) is what's stuck; bring a comps-based counter.
- Current owner paid $115k; list at $230k implies a 100% gain — meaningful room to come down on a strong offer.
Questions for the listing agent
- Built in 1972 — when were the roof, HVAC, electrical panel, plumbing, and water heater last replaced?
- Is there a deadline driving the sale (1031 exchange, divorce, estate, relocation)? That informs how much negotiation room exists.
- Crime grade is D in this area — have there been break-ins, vandalism, or insurance claims at this property in the last 3 years? What carrier currently insures it and at what premium?
- The area grade is low — what's the realistic commute time and amenity access for the typical tenant pool here? Any planned neighborhood developments (good or bad) we should know about?
- What's the average days-on-market for RENTAL listings here right now (not sales)? A rising rental-DOM trend means longer vacancies and softer asking-rent achievability than the comps imply.
- What's the recent tenant-quality profile in this submarket — average credit score on applications, eviction rate, late-payment / NSF rate, and stable-employment percentage? A property-management company in the area should have these aggregated.
- How much new for-sale + rental construction is in the pipeline within 1–3 miles? Heavy new supply typically softens prices + rents 12–24 months out; constrained supply supports both.
Investment metrics
- 1% rule
- 0.84% ✗
- Cap rate
- 6.97%
- Cash-on-cash
- 2.41%
- DSCR
- 1.11
- GRM
- 9.9
CMA / ARV
- ARV (on-the-fly)
- $210,105
- Comps found
- 12
Show comp detail 12 sales within ~0.75 mi
| Address | Dist | Beds/Ba | Sqft | Sold | Price | $/sf | Match |
|---|---|---|---|---|---|---|---|
| 3244 Continental Dr | 0.17mi | 3/2.0 (-1) | 1,472 (+2%) | 1mo | $214,000 | $145 | 84 |
| 3287 Chateau Blvd | 0.17mi | 3/2.0 (-1) | 1,434 (-1%) | 3mo | $269,900 | $188 | 83 |
| 1215 31 Street St | 0.53mi | 4/2.0 | 1,415 (-2%) | 2mo | $120,000 | $85 | 70 |
| 3141 Ohio St | 0.56mi | 3/2.0 (-1) | 1,450 (+0%) | 2mo | $182,000 | $126 | 67 |
| 845 Dolphin Ct | 0.25mi | 4/2.0 | 1,616 (+12%) | 5mo | $287,000 | $178 | 65 |
| 2 Bradley Pl | 0.52mi | 3/2.0 (-1) | 1,378 (-5%) | 4mo | $275,900 | $200 | 59 |
| 648 Mayfair Ln | 0.42mi | 4/2.0 | 1,285 (-11%) | 3mo | $180,000 | $140 | 58 |
| 717 Mayfair Ln | 0.40mi | 3/2.0 (-1) | 1,303 (-10%) | 2mo | $265,000 | $203 | 58 |
| 25 Furman Cir | 0.72mi | 3/2.0 (-1) | 1,500 (+4%) | 5mo | $229,000 | $153 | 51 |
| 361 W Louisiana State St | 0.64mi | 3/1.5 (-1) | 1,350 (-7%) | 1mo | $196,000 | $145 | 51 |
| 822 Veterans Blvd | 0.55mi | 3/1.5 (-1) | 1,275 (-12%) | 2mo | $125,000 | $98 | 46 |
| 204 Johns Hopkins Dr | 0.70mi | 3/1.5 (-1) | 1,550 (+7%) | 4mo | $89,000 | $57 | 46 |
Match score weights: distance 35% · size 25% · config 20% · recency 20%. Top-matched comps best support the ARV.
Projected returns pro-forma
-3.0% appreciation · 0.0% rent growth · sell at horizon
- IRR
- -15.6%
- Equity multiple
- 0.46×
- Total profit
- $-34,773
- Equity at exit
- $34,294
- IRR
- -12.6%
- Equity multiple
- 0.35×
- Total profit
- $-41,908
- Equity at exit
- $19,886
Cash invested: $64,400 (down + closing). Projections, not guarantees.
Landlord ↔ Tenant lean methodology
- Overall (STATE)
- 90 Strongly Landlord-Friendly
- State Louisiana
- 90 Strongly Landlord-Friendly · R+12
- County
- — inherits STATE
- City
- — inherits STATE
ZIP-level market 70065
- Rents YoY
- -4.2%
- Active inventory
- 294
- Price-to-rent
- 9.9×
Monthly cashflow live
- Estimated rent
- $1,933 high interval (Pro) →
- Mortgage (P&I)
- −$1,206
- Tax from tax record
- −$95 /mo · $1,144/yr
- Insurance
- −$96
- HOA
- −$0
- Lot rent
- −$0
- Vacancy / Maint / Mgmt
- −$406
- Net cashflow
- $130
Break-even live
Sensitivity live
| Price | -10% $260 | -5% $195 | +0% $130 | +5% $64 | +10% $-1 |
|---|---|---|---|---|---|
| Rent | -10% $-23 | -5% $53 | +0% $130 | +5% $206 | +10% $282 |
| Rate | -1.0pp $245 | -0.5pp $188 | base $130 | +0.5pp $70 | +1.0pp $9 |
UW: 25.0% down · 7.5% · 30yr · 1.5% tax · 5.0% vac · 8.0% maint · 8.0% mgmt
Financing live
Cash to close
- Down payment
- $57,500
- Closing costs
- $6,900
- Reserves months
- —
- Total cash needed
- —
Loan-product check · same deal, 3 products live
Conventional
25% down · 7.5% · 30yr
- Down + closing
- —
- Monthly P&I
- —
- Monthly cashflow
- —
- DSCR
- —
- Eligible?
- —
Personal DTI + credit; lowest rate.
DSCR
20% down · 8.5% · 30yr
- Down + closing
- —
- Monthly P&I
- —
- Monthly cashflow
- —
- DSCR
- —
- Eligible?
- —
No personal income docs; deal must DSCR.
Hard money
10% down · 12.0% · 12mo
- Down + closing
- —
- Monthly P&I
- —
- Monthly cashflow
- —
- DSCR
- —
- Eligible?
- —
Short-term bridge; refi at stabilization.
Rent comps 36 comps
| Address | Beds | Baths | Sqft | Rent | $/sqft | DOM | Units | Dist |
|---|---|---|---|---|---|---|---|---|
| 3128 Huntsville St Kenner, LA | 3.0 | 1.5 | 1047 | $1,500 | $1.43 | 0d | 1 | 0.15mi |
| 3318 Cannes Pl Kenner, LA | 3.0 | 2.0 | 1700 | $2,100 | $1.24 | 46d | 1 | 0.40mi |
| 3127 Marietta St Kenner, LA | 3.0 | 1.0 | 1600 | $1,600 | $1.00 | 46d | 1 | 0.44mi |
| 3136 Lexington Ave Kenner, LA | 4.0 | 3.0 | 1722 | $2,300 | $1.34 | 26d | 1 | 0.51mi |
| 309 Emerson Dr Unit C Kenner, LA | 3.0 | 1.0 | 900 | $1,200 | $1.33 | 6d | 1 | 0.56mi |
| 2752 Jasper St Unit A Kenner, LA | 3.0 | 1.5 | 1400 | $1,450 | $1.04 | 46d | 1 | 0.58mi |
| 2755 Huntsville St Apt C Kenner, LA | 3.0 | 2.0 | 1216 | $1,475 | $1.21 | 0d | 1 | 0.58mi |
| 2755 Huntsville St Unit B Kenner, LA | 3.0 | 1.5 | 1500 | $1,650 | $1.10 | 46d | 1 | 0.58mi |
| 2759 Albany St Unit B Kenner, LA | 3.0 | 2.0 | 1250 | $1,500 | $1.20 | 46d | 1 | 0.59mi |
| 2755 Albany St Unit D Kenner, LA | 3.0 | 2.0 | 1250 | $1,500 | $1.20 | 46d | 1 | 0.60mi |
| 70 Furman Cir Kenner, LA | 4.0 | 2.5 | 1800 | $2,500 | $1.39 | 5d | 1 | 0.63mi |
| 2723 Tifton Ave Kenner, LA | 3.0 | 2.0 | 1200 | $1,800 | $1.50 | 26d | 1 | 0.73mi |
| 2710 Helena St Kenner, LA | 3.0 | 1.5 | 1400 | $1,200 | $0.86 | 16d | 1 | 0.75mi |
| 2714 Tifton St Kenner, LA | 3.0 | 2.0 | 1275 | $1,800 | $1.41 | 46d | 1 | 0.76mi |
| 511 27th St Kenner, LA | 3.0 | 2.0 | 1200 | $1,575 | $1.31 | 6d | 1 | 0.77mi |
| 2700 Helena St Kenner, LA | 3.0 | 1.5 | 1355 | $1,700 | $1.25 | 46d | 1 | 0.77mi |
| 2838 Kingston St Unit A Kenner, LA | 3.0 | 1.5 | 1500 | $1,600 | $1.07 | 6d | 1 | 0.77mi |
| 1516 Mayfield St Kenner, LA | 3.0 | 2.0 | 1407 | $1,900 | $1.35 | 46d | 1 | 0.78mi |
| 1516 Mayfield St Kenner, LA | 3.0 | 2.0 | 1407 | $1,900 | $1.35 | 46d | 1 | 0.78mi |
| 2617 Phoenix St Kenner, LA | 3.0 | 2.0 | 1350 | $1,800 | $1.33 | 46d | 1 | 0.79mi |
| 2603 Panama St Kenner, LA | 3.0 | 1.5 | 1400 | $1,475 | $1.05 | 0d | 1 | 0.81mi |
| 2603 Panama St Kenner, LA | 3.0 | 1.5 | 1400 | $1,400 | $1.00 | 26d | 1 | 0.81mi |
| 2609 Dawson Ave Kenner, LA | 3.0 | 2.0 | 1300 | $1,600 | $1.23 | 46d | 1 | 0.84mi |
| 2611 Augusta St Kenner, LA | 3.0 | 2.0 | 1300 | $1,900 | $1.46 | 46d | 1 | 0.85mi |
| 3608 E Louisiana State Dr Kenner, LA | 3.0 | 2.0 | 1800 | $2,275 | $1.26 | 4d | 1 | 0.88mi |
| 129 Auburn Pl Kenner, LA | 3.0 | 2.0 | 1200 | $1,800 | $1.50 | 4d | 1 | 0.88mi |
| 1500 W Esplanade Ave Kenner, LA | 3.0 | 2.0 | 1725 | $1,750 | $1.01 | 5d | 2 | 0.89mi |
| 1500 W Esplanade Ave Unit 29D Kenner, LA | 3.0 | 2.0 | 1725 | $1,900 | $1.10 | 4d | 1 | 0.89mi |
| 1500 W Esplanade Ave Kenner, LA | 2.0–3.0 | 2.0 | 1587 | $2,000 | $1.26 | 46d | 1 | 0.89mi |
| 135 27th St Kenner, LA | 3.0 | 2.0 | 1205 | $1,200 | $1.00 | 6d | 1 | 0.98mi |
| 2604 Richland St Unit 1 Kenner, LA | 3.0 | 2.0 | 1442 | $1,500 | $1.04 | 6d | 1 | 1.02mi |
| 2611 Richland St Kenner, LA | 3.0 | 2.5 | 1443 | $2,200 | $1.52 | 4d | 1 | 1.03mi |
| 3611 Arizona Ave Kenner, LA | 4.0 | 2.0 | 1287 | $1,900 | $1.48 | 6d | 1 | 1.03mi |
| 3423 Delaware Ave Kenner, LA | 4.0 | 2.0 | 1215 | $1,800 | $1.48 | 6d | 1 | 1.14mi |
| 3872 E Loyola Dr Kenner, LA | 3.0 | 2.0 | 1170 | $1,575 | $1.35 | 22d | 1 | 1.40mi |
| 4018 Arkansas Ave Kenner, LA | 3.0 | 2.0 | 1200 | $1,800 | $1.50 | 5d | 1 | 1.48mi |
Listing history 15 events
-
2026-06-22days on market $230,000 Active 24 DOM
-
2026-06-21days on market $230,000 Active 23 DOM
-
2026-06-18days on market $230,000 Active 20 DOM
-
2026-06-17days on market $230,000 Active 19 DOM
-
2026-06-16days on market $230,000 Active 18 DOM
-
2026-06-15days on market $230,000 Active 17 DOM
-
2026-06-13days on market $230,000 Active 15 DOM
-
2026-06-10days on market $230,000 Active 12 DOM
-
2026-06-09days on market $230,000 Active 11 DOM
-
2026-06-08days on market $230,000 Active 10 DOM
-
2026-06-07days on market $230,000 Active 9 DOM
-
2026-06-03days on market $230,000 Active 5 DOM
-
2026-06-02days on market $230,000 Active 4 DOM
-
2026-06-01days on market $230,000 Active 3 DOM
-
2026-05-31days on market $230,000 Active 2 DOM
ⓘ Source: listings_history table (triggers on properties + properties_extension) + one-shot
backfill from property_details.listing_events for pre-trigger history.
Tax reassessment forecast LA · Resets to sale price
- Current annual tax
- $1,144 · $95/mo
- Projected year-2 tax
- $1,265 · $105/mo
- Expected delta
- +$121/yr (+$10/mo · 10.5%)
ⓘ Screening estimate from a state-policy table — verify with the county assessor before closing.
Nearby sold comps map
Loading sold comps map…
Walkable amenities ~0.75 mi
Loading nearby amenities…
Taxation est. · year 1
- Rental income
- $23,193
- − Mortgage interest
- −$12,884
- − Property taxes
- −$1,144
- − Insurance
- −$1,150
- − Repairs & maintenance
- −$1,855
- − Management
- −$1,855
- − Depreciation
- −$6,691
- Taxable loss
- −$2,387
- Est. tax savings @ 24.0%
- +$573
- After-tax cash flow
- $2,127/yr
For passive investors: Depreciation is non-cash, so a rental often shows a tax loss while cash-flowing — sheltering income. Rental losses are passive: they offset passive income freely, and up to $25,000/yr can offset ordinary (W-2) income if you actively participate and your MAGI is under $100k (phasing out to $0 by $150k); unused losses carry forward. On sale, claimed depreciation is recaptured at up to 25%, and gains may owe capital-gains tax (a 1031 exchange can defer both). Figures are a year-1 estimate at your 24.0% rate — not tax advice; consult a CPA.
Schools (NCES district)
- District
- Jefferson Parish
- NCES district ID
- 2200840
- Math proficiency
- 24% ▼ -36.00%
- Reading proficiency
- 34% ▼ -30.00%
- Median HH income
- $48,421
- Composite
- 25.19/100
- National rank
- #7511
- State rank
- #44 of 98 in LA
Livability — Kenner
- Score
- 78/100
- State rank
- #6
- US rank
- #2414
Category grades
Schools grade is shown separately in the Schools card above.
Census & demographics
- Census place
- Kenner, LA
- County
- Jefferson Parish · 426,999 people
- City population
- 66,707
- Metro
- New Orleans-Metairie, LA
- Population (ZIP)
- 48,936
- Household income
- $67,285
- Rent vs Own
- Severe rent burden
- 1906.0
Population outlook (Jefferson County) Hauer SSP2
- Today (2025)
- 451,696 people
- By 2030
- 455,451 · +0.8%
- By 2040
- 458,308 · +1.5%
- By 2050
- 461,031 · +2.1%
- By 2075
- 476,351 · +5.5%
- By 2100
- 499,377 · +10.6%
Race, ethnicity, and origin ACS 2023
- Neighborhood character
- Diverse neighborhood (Simpson 0.69)
- Race & ethnicity
- White 47% Hispanic / Latino 27% Two or more races 15% Black 15% Asian 6%
- Hispanic origin (detail)
- Mexican 2% Puerto Rican 3% Cuban 2%
- Common ancestry
- Lithuanian 9% Slovak 1% Italian 1%
- Foreign-born
- 19% · Canada, China, Vietnam
- Languages at home
- 72% English-only · Spanish 21% Other Indo-European 3% Arabic 1%
Political lean MEDSL · Jefferson
- 2024 margin
- R (+12.9) · D 42.5% · R 55.5% · Other 2.1%
- 2008→2024 swing
- +13.6pp toward D · 2008: -26.6pp · 2024: -12.9pp
- All cycles
- 2024: R+12.9 2020: R+11.1 2016: R+14.8 2012: R+18.4 2008: R+26.6
Not yet ingested
- Civics
- —
Market trends
- HPI YoY
- ▼ -214.79%
- Current HPI
- 139.5115
- Rent YoY
- ▼ -4.19%
- Metro
- New Orleans-Metairie, LA
- State GDP YoY
- ▲ 3.29%
- F500 in state
- 10
Industry mix (Fortune 500 HQ in LA)
| Industry | F500 HQs | Revenue |
|---|---|---|
| Telecommunications | 2 | $23B |
|
||
| Utilities | 1 | $12B |
|
||
| Wholesale / Distribution | 1 | $5B |
|
||
| Advertising | 1 | $2B |
|
||
Price history
+119.0% since first listed6 events — show timeline
- 2026-05-29 Listed $230,000 AcadianaMLS
- 2026-05-29 Listed $230,000 GSREIN
- 2004-08-01 Sold (Public Records) $115,000 Public Records
- 2000-01-28 Sold (MLS) $97,000 GSREIN
- 1999-08-07 Listed $105,000 AcadianaMLS
- 1999-08-07 Listed $105,000 GSREIN
Property tax history
+1.3%/yrLatest (2025): $1,144 · -0.4% YoY. Source: county tax records.
Cash-flow waterfall
monthlySold comps — $/sqft
last 12 mo · ≤1 miLoading sold comps…