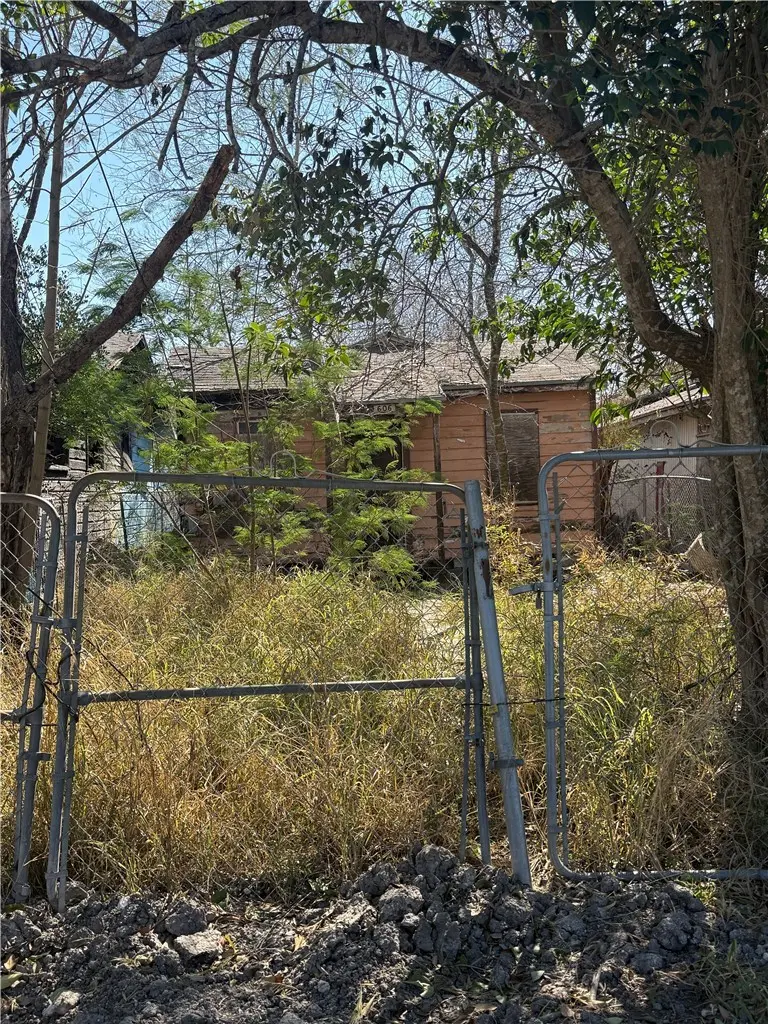
606 Nebraska · Robstown, TX
Flood risk 6/10 · Moderate
- FEMA flood zone
- AE
- Chance of flooding over 30 yrs
- 0.95%
- Est. flood insurance / yr
- $1,737 – $8,500
Fire risk 1/10 · Minimal
- Est. fire insurance / yr
- $1,222 – $2,270
Heat risk 9/10 · Severe
- Hot days now (above 110°F)
- 7 days/yr
- Hot days in 30 yrs
- 23 days/yr
Wind risk 9/10 · Severe
- Chance of severe wind over 30 yrs
- 99.0%
Air-quality risk 1/10 · Minimal
- Unhealthy air days now
- 0 days/yr
- Unhealthy air days in 30 yrs
- 0 days/yr
Risk factors via First Street. Map © Google.
Why this score? — see what drove the D+ grade
The composite is a weighted blend of 9 inputs, each scored 0–100. Each bar is that input's sub-score; the figure is the points it added to the 100-point composite (weight × sub-score).
- Cash flow +15.0/30.0
- ARV discount +7.5/15.0
- 1% rule +5.0/10.0
- DSCR +5.0/10.0
- Livability +4.0/5.0
- Rent growth +2.5/5.0
- Condition / age +2.5/5.0
- Appreciation +2.2/10.0
- Schools +1.9/10.0
$9,325
🖨 Deal sheet 📄 Offer letter ✓ Due diligence
Listing remarks MLS
Owner financing available! Affordable residential lot with utilities available in Robstown, Texas. Build a home, or hold for future development. Call your real estate agent for more info!
Key facts
- Residential lot
- Utilities available
- Future development
Tags
Neighborhood map
What this means for you Summary
Snapshot
- This is a 1-bed/1.0-bath single-family listed at $9k.
Deal economics
- At list price, monthly cash flow is $2 ($26/yr) — positive.
- The deal already cash-flows at list — no discount required.
- Meets the 1% rule at list price ($624 rent vs $9k).
- Cap rate 61.5% vs local median 4.0% in Robstown — top-decile yield for the area; either an underpriced asset or a hidden risk that comps aren't pricing in. Stress-test before assuming the spread holds.
Location & tenants
- Location reads 80/100 on livability (#47 in TX, #1,942 nationally) — a professional / high-income tenant draw. Strengths: commute A+, cost of living A+, housing A+; Watch: schools D-, crime D-, amenities F.
- Robstown ISD (town): math 18% / reading 28% proficiency, ranked #757 of 826 in TX (top 92%) — low school quality limits family demand, transient renter base, plan for 1-2y turnover; 71% free/reduced lunch — lower-income household profile, screen leases tightly.
- Market conditions: 182 active listings in the ZIP; 2 comparable units currently listed for rent nearby; 1,397 units permitted in Nueces County in 2024 (47 in 5+ unit buildings).
Forward outlook
- Local home prices are declining (-3.0%/yr); year-one equity from $65 of loan paydown is wiped out by about $280 of value loss. Plan a longer hold.
- Nueces County population projected at +36% by 2050 — long-run rental-demand tailwind backs the buy-and-hold thesis.
Negotiation context
- Only 14 days on market — expect competitive offers; lowballing is unlikely to land.
- 4 sale attempts since 2y ago; this cycle's ask has dropped $1k (11%) from the opening price — seller is motivated, your offer sets the floor, not the list.
Risks & watch-outs
- Watch-outs: flood insurance adds $427/mo.
- Climate carrying-cost: in FEMA flood zone AE (mandatory federal flood insurance); severe wind risk, 99% chance of damaging wind over 30y; extreme-heat days projected 7→23/yr by 2055 (HVAC capex compounding) — expect insurance premiums to compound above CPI over the hold.
Questions for the listing agent
- Built in 1970 — when were the roof, HVAC, electrical panel, plumbing, and water heater last replaced?
- What's the actual annual flood-insurance premium (NFIP or private), and is the property in a SFHA with mandatory coverage?
- Is there a deadline driving the sale (1031 exchange, divorce, estate, relocation)? That informs how much negotiation room exists.
- Schools are D-rated, which usually means shorter tenancies and higher turnover. Who's the typical renter profile here, and what's been the actual vacancy rate?
- Crime grade is D in this area — have there been break-ins, vandalism, or insurance claims at this property in the last 3 years? What carrier currently insures it and at what premium?
- The area grade is low — what's the realistic commute time and amenity access for the typical tenant pool here? Any planned neighborhood developments (good or bad) we should know about?
- What's the average days-on-market for RENTAL listings here right now (not sales)? A rising rental-DOM trend means longer vacancies and softer asking-rent achievability than the comps imply.
- What's the recent tenant-quality profile in this submarket — average credit score on applications, eviction rate, late-payment / NSF rate, and stable-employment percentage? A property-management company in the area should have these aggregated.
- How much new for-sale + rental construction is in the pipeline within 1–3 miles? Heavy new supply typically softens prices + rents 12–24 months out; constrained supply supports both.
Investment metrics
- 1% rule
- 6.69% ✓
- Cap rate
- 61.47%
- Cash-on-cash
- 197.05%
- DSCR
- 9.77
- GRM
- 1.2
CMA / ARV
- ARV (median comp)
- $55,263
- List price
- $9,325
- Delta
- -83.17%
- Verdict
- UNDERPRICED
- Comps
- 12 within 1.0 mi
Show comp detail 2 sales within ~0.75 mi
| Address | Dist | Beds/Ba | Sqft | Sold | Price | $/sf | Match |
|---|---|---|---|---|---|---|---|
| 217 Iowa St | 0.24mi | 2/1.0 (+1) | 825 (+11%) | 5mo | $115,000 | $139 | 62 |
| 1208 Kansas St | 0.45mi | 2/1.0 (+1) | 792 (+6%) | 5mo | $85,700 | $108 | 59 |
Match score weights: distance 35% · size 25% · config 20% · recency 20%. Top-matched comps best support the ARV.
Projected returns pro-forma
-3.0% appreciation · 3.0% rent growth · sell at horizon
- IRR
- -11.3%
- Equity multiple
- 0.58×
- Total profit
- $-1,099
- Equity at exit
- $1,390
- IRR
- 1.6%
- Equity multiple
- 1.13×
- Total profit
- $327
- Equity at exit
- $806
Cash invested: $2,611 (down + closing). Projections, not guarantees.
Landlord ↔ Tenant lean methodology
- Overall (STATE)
- 87 Strongly Landlord-Friendly
- State Texas
- 87 Strongly Landlord-Friendly · R+5
- County
- — inherits STATE
- City
- — inherits STATE
ZIP-level market 78380
- Home prices YoY
- -1.9%
- Active inventory
- 182
- Price-to-rent
- 1.2×
Monthly cashflow live
- Estimated rent
- $624 medium interval (Pro) →
- Mortgage (P&I)
- −$49
- Tax est. 1.5%
- −$12 /mo · $140/yr
- Insurance
- −$4
- Flood insurance flood zone
- −$427 /mo · $5,118/yr
- HOA
- −$0
- Vacancy / Maint / Mgmt
- −$131
- Net cashflow
- $2
Break-even live
UW: 25.0% down · 7.5% · 30yr · 1.5% tax · 5.0% vac · 8.0% maint · 8.0% mgmt
Financing live
Cash to close
- Down payment
- $2,331
- Closing costs
- $280
- Reserves months
- —
- Total cash needed
- —
Loan-product check · same deal, 3 products live
Conventional
25% down · 7.5% · 30yr
- Down + closing
- —
- Monthly P&I
- —
- Monthly cashflow
- —
- DSCR
- —
- Eligible?
- —
Personal DTI + credit; lowest rate.
DSCR
20% down · 8.5% · 30yr
- Down + closing
- —
- Monthly P&I
- —
- Monthly cashflow
- —
- DSCR
- —
- Eligible?
- —
No personal income docs; deal must DSCR.
Hard money
10% down · 12.0% · 12mo
- Down + closing
- —
- Monthly P&I
- —
- Monthly cashflow
- —
- DSCR
- —
- Eligible?
- —
Short-term bridge; refi at stabilization.
Rent comps 2 comps
| Address | Beds | Baths | Sqft | Rent | $/sqft | DOM | Units | Dist |
|---|---|---|---|---|---|---|---|---|
| 2 East Avenue A #2 Robstown, TX | 1.0 | 1.0 | 560 | $650 | $1.16 | 44d | 1 | 0.36mi |
| 630 Wright St Robstown, TX | 1.0–3.0 | 1.0–2.0 | 936 | $567 | $0.61 | 13d | 8 | 0.85mi |
Listing history 22 events
-
2026-06-18days on market $9,325 Active 14 DOM
-
2026-06-17days on market $9,325 Active 13 DOM
-
2026-06-16days on market $9,325 Active 12 DOM
-
2026-06-15days on market $9,325 Active 11 DOM
-
2026-06-15pricedays on market $9,325 Active 10 DOM
-
2026-06-13days on market $9,300 Active 9 DOM
-
2026-06-09days on market $9,300 Active 5 DOM
-
2026-06-08days on market $9,300 Active 4 DOM
-
2026-06-08days on market $9,300 Active 3 DOM
-
2026-06-07days on market $9,300 Active 2 DOM
-
2026-05-31days on market $9,300 Active 110 DOM
-
2026-03-30price $9,300 187-char remark
Show marketing remark (187 chars)
Owner financing available! Affordable residential lot with utilities available in Robstown, Texas. Build a home, or hold for future development. Call your real estate agent for more info!
-
2026-02-10$10,500 Active 187-char remark
Show marketing remark (187 chars)
Owner financing available! Affordable residential lot with utilities available in Robstown, Texas. Build a home, or hold for future development. Call your real estate agent for more info!
-
2026-02-09$10,500 Active
-
2026-01-20price $10,500
-
2025-07-24$15,000 Active
-
2025-04-02price $13,000
-
2025-01-07price $15,000
-
2024-10-14price $17,000
-
2024-10-09price $18,000
-
2024-09-10price $19,000
-
2024-07-15$20,000 Active
ⓘ Source: listings_history table (triggers on properties + properties_extension) + one-shot
backfill from property_details.listing_events for pre-trigger history.
Climate risk First Street
- Flood 6/10 Major FEMA zone AE · 95% chance over 30 yrs
- Wildfire 1/10 Low
- Heat 9/10 Extreme 7 d/yr ≥110°F today · 23 d/yr by 30 yrs out
- Wind 9/10 Extreme 99% chance of damaging wind over 30 yrs
- Air quality 1/10 Low 0 unhealthy d/yr today · 0 by 30 yrs out
Nearby sold comps map
Loading sold comps map…
Walkable amenities ~0.75 mi
Loading nearby amenities…
Taxation est. · year 1
- Rental income
- $7,491
- − Mortgage interest
- −$522
- − Property taxes
- −$140
- − Insurance
- −$5,165
- − Repairs & maintenance
- −$599
- − Management
- −$599
- − Depreciation
- −$271
- Taxable income
- $194
- Est. tax owed @ 24.0%
- −$47
- After-tax cash flow
- $-20/yr
For passive investors: Depreciation is non-cash, so a rental often shows a tax loss while cash-flowing — sheltering income. Rental losses are passive: they offset passive income freely, and up to $25,000/yr can offset ordinary (W-2) income if you actively participate and your MAGI is under $100k (phasing out to $0 by $150k); unused losses carry forward. On sale, claimed depreciation is recaptured at up to 25%, and gains may owe capital-gains tax (a 1031 exchange can defer both). Figures are a year-1 estimate at your 24.0% rate — not tax advice; consult a CPA.
Schools (NCES district)
- District
- Robstown ISD
- NCES district ID
- 4837440
- Math proficiency
- 18% ▼ -21.00%
- Reading proficiency
- 28% ▼ -5.00%
- Median HH income
- $33,362
- Composite
- 18.77/100
- National rank
- #8875
- State rank
- #757 of 826 in TX
Livability — Robstown
- Score
- 80/100
- State rank
- #47
- US rank
- #1942
Category grades
Schools grade is shown separately in the Schools card above.
Census & demographics
- Census place
- Robstown, TX
- Population (ZIP)
- 23,752
Population outlook (Nueces County) Hauer SSP2
- Today (2025)
- 418,037 people
- By 2030
- 447,123 · +7.0%
- By 2040
- 505,911 · +21.0%
- By 2050
- 567,522 · +35.8%
- By 2075
- 729,686 · +74.6%
- By 2100
- 847,087 · +102.6%
Race, ethnicity, and origin ACS 2023
- Neighborhood character
- Predominantly Hispanic (76%)
- Race & ethnicity
- Hispanic / Latino 76% Two or more races 38% White 23%
- Hispanic origin (detail)
- Mexican 71%
- Foreign-born
- 5% · Canada, Vietnam
- Languages at home
- 52% English-only · Spanish 47%
Political lean MEDSL · Nueces
- 2024 margin
- R (+11.5) · D 43.8% · R 55.3%
- 2008→2024 swing
- -7.1pp toward R · 2008: -4.4pp · 2024: -11.5pp
- All cycles
- 2024: R+11.5 2020: R+2.9 2016: R+1.5 2012: R+3.2 2008: R+4.4
Not yet ingested
- Civics
- —
Market trends
- HPI YoY
- ▼ -5.51%
- Current HPI
- 286.19
- Rent YoY
- —
- Metro
- —
- State GDP YoY
- ▲ 3.95%
- F500 in state
- 110
Industry mix (Fortune 500 HQ in TX)
| Industry | F500 HQs | Revenue |
|---|---|---|
| Energy | 16 | $1,198B |
|
||
| Technology | 5 | $198B |
|
||
| Engineering / Construction | 4 | $72B |
|
||
| Energy Services | 3 | $60B |
|
||
| Utilities | 3 | $41B |
|
||
| Healthcare | 2 | $330B |
|
||
Price history
-53.5% since first listed11 events — show timeline
- 2026-03-30 Price Changed $9,300 CBMLS
- 2026-02-10 Listed $10,500 CBMLS
- 2026-02-09 Listed $10,500 CBMLS
- 2026-01-20 Price Changed $10,500 CBMLS
- 2025-07-24 Listed $15,000 CBMLS
- 2025-04-02 Price Changed $13,000 CBMLS
- 2025-01-07 Price Changed $15,000 CBMLS
- 2024-10-14 Price Changed $17,000 CBMLS
- 2024-10-09 Price Changed $18,000 CBMLS
- 2024-09-10 Price Changed $19,000 CBMLS
- 2024-07-15 Listed $20,000 CBMLS
Property tax history
+17.5%/yrLatest (2025): $1,369 · -18.5% YoY. Source: county tax records.
Cash-flow waterfall
monthlySold comps — $/sqft
last 12 mo · ≤1 miLoading sold comps…