 Duplex
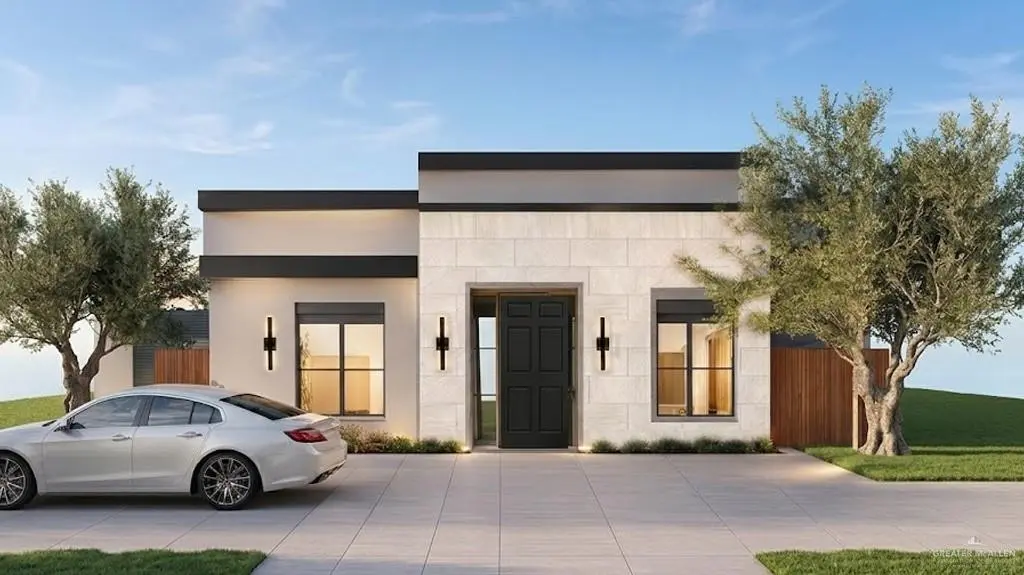
10914 N 27th St · McAllen, TX
Flood risk No data
- FEMA flood zone
- —
- Chance of flooding over 30 yrs
- —
- Est. flood insurance / yr
- —
Fire risk No data
- Est. fire insurance / yr
- —
Heat risk No data
- Hot days now (above threshold)
- —
- Hot days in 30 yrs
- —
Wind risk No data
- Chance of severe wind over 30 yrs
- —
Air-quality risk No data
- Unhealthy air days now
- —
- Unhealthy air days in 30 yrs
- —
Risk factors via First Street. Map © Google.
Why this score? — see what drove the D- grade
The composite is a weighted blend of 9 inputs, each scored 0–100. Each bar is that input's sub-score; the figure is the points it added to the 100-point composite (weight × sub-score).
- ARV discount +14.1/15.0
- Cash flow +7.9/30.0
- Livability +3.8/5.0
- Rent growth +3.1/5.0
- 1% rule +2.6/10.0
- Condition / age +2.5/5.0
- Schools +2.2/10.0
- DSCR +1.9/10.0
- Appreciation +0.0/10.0
$345,000
🖨 Deal sheet 📄 Offer letter ✓ Due diligence
Multi-family units
County records classify this as Multi-Family (2-4 Unit). Listing-text estimate: 2 units. confirmed
Listing remarks MLS
This duplex may qualify for $0 down through FHA/DPA programs or as low as 3.5% down for qualified buyers (580+ credit), making it ideal for owner-occupants and investors alike. No construction loan required. Professionally designed floorplan features 3 bedrooms, 2 baths, spacious living areas, and private patios. Enjoy desirable upgrades including pantry space, dishwasher connections, stainless steel appliances, added storage, and generously sized bedrooms with large closets. The primary suite offers a large walk-in shower, extended vanity, and spacious walk-in closet. While under construction, buyers may have the opportunity to select from builder-curated finishes. Completion July 2026. Located off Sprague and 29th St. in North McAllen, Close to Zinnia & Tres Lagos Park, H-E-B, Walmart, dining, and healthcare. Limited pre-construction pricing available 9 remaining. Seller may contribute toward title policy, survey, and select lender fees at current price.
Key facts
- 5,900 sq ft lot
- Garage
- Built 2026
Neighborhood map
What this means for you Summary
Snapshot
- This is a 1×3bd/2ba + 1×1bd/1ba units multifamily listed at $345k.
Deal economics
- At list price, monthly cash flow is $-374 ($-4k/yr) — negative. Per door: $-187/mo.
- To cash-flow at today's rent, offer at most $291k (15.7% below list).
- To meet the 1% rule (rent ≥ 1% of price), the offer needs to be $261k (24.3% below list).
- Recommended offer: $261k (24.3% below list) — sets the bar for 1% rule.
- Cap rate 5.0% vs local median 3.7% in McAllen — top-decile yield for the area; either an underpriced asset or a hidden risk that comps aren't pricing in. Stress-test before assuming the spread holds.
Location & tenants
- Location reads 76/100 on livability (#119 in TX, #3,771 nationally) — a middle-class / working-renter tenant base. Strengths: cost of living A+, housing A+, health & safety A+; Watch: employment D, amenities F, commute F.
- Edinburg CISD (urban): math 20% / reading 34% proficiency, ranked #699 of 826 in TX (top 85%) — low school quality limits family demand, transient renter base, plan for 1-2y turnover; 62% free/reduced lunch — lower-income household profile, screen leases tightly.
- Market conditions: Rents rising (+2.6%/yr); 888 active listings in the ZIP; 21 comparable units currently listed for rent nearby; rentals at typical pace (median 24d on market — plan ~3-4 weeks tenant-placement turnaround); solid renter incomes; 7,378 units permitted in Hidalgo County in 2024 (641 in 5+ unit buildings).
- This rent runs 38% of the median local income ($82k/yr) — at the standard rent-burdened threshold; future hikes will face affordability resistance.
Forward outlook
- Local home prices are declining (-3.0%/yr); year-one equity from $2k of loan paydown is wiped out by about $10k of value loss. Plan a longer hold.
- Hidalgo County population projected at +28% by 2050 — long-run rental-demand tailwind backs the buy-and-hold thesis.
Negotiation context
- It's been on market 239 days — a 12% lower offer ($304k) is reasonable based on typical stale-listing flexibility.
Questions for the listing agent
- What do current leases actually rent for vs. the listed asking? Can we see a recent rent roll and the last 12 months of T-12 income?
- It's been on market 239 days. Have you received any prior offers? Is the seller open to a 24% concession, seller financing, or rate buy-down credit?
- Can we see the unit-by-unit rent roll, current vacancy, and any below-market leases? What's the average tenancy length?
- What capital expenditures (roof, boiler, parking lot, exteriors) have been made in the last 5 years, and what's planned in the next 2?
- What does the HOA fee cover, when was the last increase, and are there any pending special assessments or reserve-fund shortfalls?
- Why hasn't it sold? Are there any deal-killer items the seller is aware of (foundation, flood, title, zoning, code violations)?
- Is there a deadline driving the sale (1031 exchange, divorce, estate, relocation)? That informs how much negotiation room exists.
- Schools are B-rated — typically a magnet for longer-tenancy family renters. What's the average tenant stay here, and is there a school-zone premium baked into asking?
- The area grade is low — what's the realistic commute time and amenity access for the typical tenant pool here? Any planned neighborhood developments (good or bad) we should know about?
- What's the average days-on-market for RENTAL listings here right now (not sales)? A rising rental-DOM trend means longer vacancies and softer asking-rent achievability than the comps imply.
- What's the recent tenant-quality profile in this submarket — average credit score on applications, eviction rate, late-payment / NSF rate, and stable-employment percentage? A property-management company in the area should have these aggregated.
- How much new apartment / multifamily construction is in the pipeline within 1–3 miles? Heavy new supply (>2% of stock underway) typically softens rents 12–24 months out; light construction supports rent growth.
Investment metrics
- 1% rule
- 0.76% ✗
- Cap rate
- 4.99%
- Cash-on-cash
- -4.65%
- DSCR
- 0.79
- GRM
- 11.0
CMA / ARV
- ARV (median comp)
- $403,808
- List price
- $345,000
- Delta
- -14.56%
- Verdict
- UNDERPRICED
- Comps
- 2 within 2.0 mi
Projected returns pro-forma
-3.0% appreciation · 2.57% rent growth · sell at horizon
- IRR
- -24.6%
- Equity multiple
- 0.16×
- Total profit
- $-80,775
- Equity at exit
- $51,441
- IRR
- -21.5%
- Equity multiple
- -0.09×
- Total profit
- $-105,290
- Equity at exit
- $29,829
Cash invested: $96,600 (down + closing). Projections, not guarantees.
Landlord ↔ Tenant lean methodology
- Overall (STATE)
- 87 Strongly Landlord-Friendly
- State Texas
- 87 Strongly Landlord-Friendly · R+5
- County
- — inherits STATE
- City
- — inherits STATE
ZIP-level market 78504
- Home prices YoY
- -29.4%
- Rents YoY
- 2.6%
- Active inventory
- 888
- Price-to-rent
- 20.4×
Monthly cashflow live
- Estimated rent
- $2,613 high interval (Pro) →
- Mortgage (P&I)
- −$1,809
- Tax est. 1.5%
- −$431 /mo · $5,175/yr
- Insurance
- −$144
- HOA
- −$54
- Vacancy / Maint / Mgmt
- −$549
- Net cashflow
- $-374
Break-even live
2-unit breakdown (identical units grouped — click to expand)
| Units | Beds | Baths | Est. rent |
|---|---|---|---|
| 1× unit | 3 | 2 | $1,407 |
| 1× unit | 1 | 1 | $1,206 |
| Total (2 units) | $2,613 | ||
UW: 25.0% down · 7.5% · 30yr · 1.5% tax · 5.0% vac · 8.0% maint · 8.0% mgmt
Financing live
Cash to close
- Down payment
- $86,250
- Closing costs
- $10,350
- Reserves months
- —
- Total cash needed
- —
Loan-product check · same deal, 3 products live
Conventional
25% down · 7.5% · 30yr
- Down + closing
- —
- Monthly P&I
- —
- Monthly cashflow
- —
- DSCR
- —
- Eligible?
- —
Personal DTI + credit; lowest rate.
DSCR
20% down · 8.5% · 30yr
- Down + closing
- —
- Monthly P&I
- —
- Monthly cashflow
- —
- DSCR
- —
- Eligible?
- —
No personal income docs; deal must DSCR.
Hard money
10% down · 12.0% · 12mo
- Down + closing
- —
- Monthly P&I
- —
- Monthly cashflow
- —
- DSCR
- —
- Eligible?
- —
Short-term bridge; refi at stabilization.
Rent comps 21 comps
| Address | Beds | Baths | Sqft | Rent | $/sqft | DOM | Units | Dist |
|---|---|---|---|---|---|---|---|---|
| 10315 N 26th Ln McAllen, TX | 3.0 | 2.5 | 2124 | $2,300 | $1.08 | 14d | 1 | 0.08mi |
| 3132 Zurich Ave McAllen, TX | 3.0 | 2.0 | 1400 | $1,900 | $1.36 | 19d | 1 | 0.44mi |
| 2909 Fuerte Ave McAllen, TX | 3.0 | 2.0 | 1440 | $1,600 | $1.11 | 43d | 1 | 0.49mi |
| 2908 Providence Ave McAllen, TX | 3.0 | 2.5 | 1646 | $1,750 | $1.06 | 43d | 1 | 0.67mi |
| 2920 Providence Ave McAllen, TX | 3.0 | 2.5 | 1848 | $1,600 | $0.87 | 23d | 1 | 0.68mi |
| 3213 Princeton Ave McAllen, TX | 3.0 | 2.5 | 1868 | $1,850 | $0.99 | 14d | 1 | 0.82mi |
| 9104 N 28th St McAllen, TX | 3.0 | 2.0 | 1747 | $1,900 | $1.09 | 14d | 1 | 0.89mi |
| 10333 N 15th St McAllen, TX | 3.0 | 2.0 | 1414 | $2,100 | $1.49 | 14d | 1 | 0.92mi |
| 10321 N 15th St McAllen, TX | 3.0 | 2.0 | 1502 | $2,000 | $1.33 | 14d | 1 | 0.92mi |
| 10321 N 15th St McAllen, TX | 3.0 | 2.0 | 1502 | $2,200 | $1.46 | 43d | 1 | 0.92mi |
| 10221 N 15th St McAllen, TX | 3.0 | 2.0 | 1418 | $2,200 | $1.55 | 43d | 1 | 0.92mi |
| 10218 N 15th St McAllen, TX | 3.0 | 2.5 | 1768 | $3,150 | $1.78 | 43d | 1 | 0.95mi |
| 10328 N 13th St McAllen, TX | 3.0 | 2.0 | 1963 | $2,100 | $1.07 | 19d | 1 | 1.08mi |
| 1800 Kingsborough Ave McAllen, TX | 3.0 | 2.0 | 2027 | $2,200 | $1.09 | 23d | 1 | 1.18mi |
| 1304 Providence Ave McAllen, TX | 3.0 | 2.5 | 2029 | $3,750 | $1.85 | 43d | 1 | 1.23mi |
| 4923 N 35th Ln McAllen, TX | 2.0–4.0 | 2.0–2.5 | 1373 | $1,690 | $1.23 | 14d | 11 | 1.26mi |
| 1205 Ozark Ave McAllen, TX | 3.0 | 3.0 | 1955 | $2,800 | $1.43 | 23d | 1 | 1.31mi |
| 2809 Grambling Ave McAllen, TX | 3.0 | 2.5 | 2152 | $2,500 | $1.16 | 43d | 1 | 1.32mi |
| 2613 Fairmont Ave McAllen, TX | 3.0 | 2.0 | 1735 | $2,000 | $1.15 | 43d | 1 | 1.36mi |
| 8406 N 33rd Ln McAllen, TX | 3.0 | 2.0 | 1448 | $2,000 | $1.38 | 14d | 1 | 1.40mi |
| 8330 N 34th Ln McAllen, TX | 2.0 | 3.0 | 1458 | $2,250 | $1.54 | 23d | 1 | 1.40mi |
HOA detail
- Monthly dues
- $54 · $648/yr
Listing history 15 events
-
2026-06-18days on market $345,000 Active 239 DOM
-
2026-06-17days on market $345,000 Active 238 DOM
-
2026-06-16days on market $345,000 Active 237 DOM
-
2026-06-15days on market $345,000 Active 236 DOM
-
2026-06-14days on market $345,000 Active 234 DOM
-
2026-06-13days on market $345,000 Active 233 DOM
-
2026-06-10days on market $345,000 Active 231 DOM
-
2026-06-08days on market $345,000 Active 229 DOM
-
2026-06-07days on market $345,000 Active 228 DOM
-
2026-06-03days on market $345,000 Active 224 DOM
-
2026-06-02days on market $345,000 Active 223 DOM
-
2026-06-01days on market $345,000 Active 222 DOM
-
2026-05-31days on market $345,000 Active 221 DOM
-
2026-05-31days on market $345,000 Active 220 DOM
-
2025-10-22$345,000 Active 974-char remark
Show marketing remark (974 chars)
This duplex may qualify for $0 down through FHA/DPA programs or as low as 3.5% down for qualified buyers (580+ credit), making it ideal for owner-occupants and investors alike. No construction loan required. Professionally designed floorplan features 3 bedrooms, 2 baths, spacious living areas, and private patios. Enjoy desirable upgrades including pantry space, dishwasher connections, stainless steel appliances, added storage, and generously sized bedrooms with large closets. The primary suite offers a large walk-in shower, extended vanity, and spacious walk-in closet. While under construction, buyers may have the opportunity to select from builder-curated finishes. Completion July 2026. Located off Sprague and 29th St. in North McAllen, Close to Zinnia & Tres Lagos Park, H-E-B, Walmart, dining, and healthcare. Limited pre-construction pricing available 9 remaining. Seller may contribute toward title policy, survey, and select lender fees at current price.
ⓘ Source: listings_history table (triggers on properties + properties_extension) + one-shot
backfill from property_details.listing_events for pre-trigger history.
Nearby sold comps map
Loading sold comps map…
Walkable amenities ~0.75 mi
Loading nearby amenities…
Taxation est. · year 1
- Rental income
- $31,356
- − Mortgage interest
- −$19,325
- − Property taxes
- −$5,175
- − Insurance
- −$1,725
- − Repairs & maintenance
- −$2,508
- − Management
- −$2,508
- − HOA
- −$648
- − Depreciation
- −$10,036
- Taxable loss
- −$10,571
- Est. tax savings @ 24.0%
- +$2,537
- After-tax cash flow
- $-1,950/yr
For passive investors: Depreciation is non-cash, so a rental often shows a tax loss while cash-flowing — sheltering income. Rental losses are passive: they offset passive income freely, and up to $25,000/yr can offset ordinary (W-2) income if you actively participate and your MAGI is under $100k (phasing out to $0 by $150k); unused losses carry forward. On sale, claimed depreciation is recaptured at up to 25%, and gains may owe capital-gains tax (a 1031 exchange can defer both). Figures are a year-1 estimate at your 24.0% rate — not tax advice; consult a CPA.
Schools (NCES district)
- District
- Edinburg CISD
- NCES district ID
- 4818180
- Math proficiency
- 20% ▼ -34.00%
- Reading proficiency
- 34% ▼ -11.00%
- Median HH income
- $36,985
- Composite
- 22.42/100
- National rank
- #8114
- State rank
- #699 of 826 in TX
Livability — McAllen
- Score
- 76/100
- State rank
- #119
- US rank
- #3771
Category grades
Schools grade is shown separately in the Schools card above.
Census & demographics
- Census place
- McAllen, TX
- County
- Hidalgo County · 623,128 people
- City population
- 144,650
- Metro
- McAllen-Edinburg-Mission, TX
- Population (ZIP)
- 63,094
- Household income
- $81,905
- Rent vs Own
- Severe rent burden
- 1468.0
Population outlook (Hidalgo County) Hauer SSP2
- Today (2025)
- 955,232 people
- By 2030
- 1,009,774 · +5.7%
- By 2040
- 1,120,332 · +17.3%
- By 2050
- 1,225,036 · +28.2%
- By 2075
- 1,439,189 · +50.7%
- By 2100
- 1,533,429 · +60.5%
Race, ethnicity, and origin ACS 2023
- Neighborhood character
- Predominantly Hispanic (82%)
- Race & ethnicity
- Hispanic / Latino 82% Two or more races 39% White 11% Asian 5%
- Hispanic origin (detail)
- Mexican 75%
- Common ancestry
- Lithuanian 1% Italian 1%
- Foreign-born
- 24% · Canada, South Korea, Vietnam
- Languages at home
- 34% English-only · Spanish 62% Other Asian/Pacific 1% Tagalog/Filipino 1%
Political lean MEDSL · Hidalgo
- 2024 margin
- Toss-up / Even · D 48.1% · R 51.0%
- 2008→2024 swing
- -41.6pp toward R · 2008: 38.7pp · 2024: -2.9pp
- All cycles
- 2024: R+2.9 2020: D+17.1 2016: D+40.5 2012: D+41.8 2008: D+38.7
Not yet ingested
- Civics
- —
Market trends
- HPI YoY
- ▼ -80.87%
- Current HPI
- 194.1764
- Rent YoY
- ▲ 2.57%
- Metro
- McAllen-Edinburg-Mission, TX
- State GDP YoY
- ▲ 3.95%
- F500 in state
- 110
Industry mix (Fortune 500 HQ in TX)
| Industry | F500 HQs | Revenue |
|---|---|---|
| Energy | 16 | $1,198B |
|
||
| Technology | 5 | $198B |
|
||
| Engineering / Construction | 4 | $72B |
|
||
| Energy Services | 3 | $60B |
|
||
| Utilities | 3 | $41B |
|
||
| Healthcare | 2 | $330B |
|
||
Price history
1 event — show timeline
- 2025-10-22 Listed $345,000 MCALLENMLS
Cash-flow waterfall
monthlySold comps — $/sqft
last 12 mo · ≤1 miLoading sold comps…