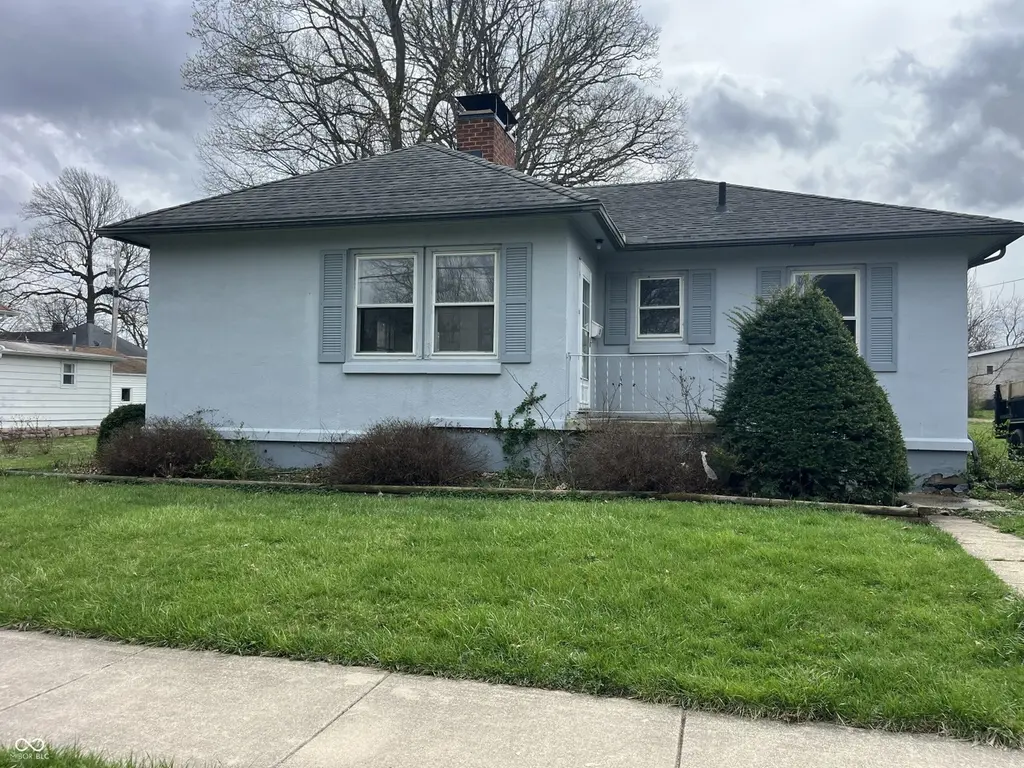
25 W Stump St · Williamsport, IN
Flood risk 1/10 · Minimal
- FEMA flood zone
- X (unshaded)
- Chance of flooding over 30 yrs
- 0.0%
- Est. flood insurance / yr
- $473 – $860
Fire risk 1/10 · Minimal
- Est. fire insurance / yr
- $717 – $1,331
Heat risk 3/10 · Minor
- Hot days now (above 103°F)
- 7 days/yr
- Hot days in 30 yrs
- 18 days/yr
Wind risk 2/10 · Minimal
- Chance of severe wind over 30 yrs
- 0.0%
Air-quality risk 3/10 · Minor
- Unhealthy air days now
- 2 days/yr
- Unhealthy air days in 30 yrs
- 4 days/yr
Risk factors via First Street. Map © Google.
Why this score? — see what drove the D grade
The composite is a weighted blend of 9 inputs, each scored 0–100. Each bar is that input's sub-score; the figure is the points it added to the 100-point composite (weight × sub-score).
- ARV discount +14.2/15.0
- Appreciation +8.4/10.0
- Cash flow +6.7/30.0
- Schools +5.0/10.0
- Livability +3.8/5.0
- Rent growth +2.5/5.0
- Condition / age +2.5/5.0
- DSCR +0.9/10.0
- 1% rule +0.6/10.0
$143,500
🖨 Deal sheet 📄 Offer letter ✓ Due diligence
Listing remarks MLS
Charming 2-Bedroom Home! Welcome to this inviting 2-bedroom, 1-bath home that blends comfort, updates, and opportunity. The main level features brand-new flooring and fresh paint throughout, creating a clean, modern feel that’s move-in ready. Downstairs, you’ll find a full unfinished basement, providing an open canvas with tons of potential. Whether you’re dreaming of a home gym, workshop, additional living space, or extra storage, this area offers the flexibility to make it your own. Outside, enjoy the convenience of a detached 2-car garage, providing ample space for parking, hobbies, or storage.
Key facts
- Fresh paint
- Brand new flooring
- 0.27 acre lot
Tags
Neighborhood map
What this means for you Summary
Snapshot
- This is a 2-bed/1.0-bath single-family listed at $144k.
Deal economics
- At list price, monthly cash flow is $-230 ($-3k/yr) — negative.
- To cash-flow at today's rent, offer at most $103k (28.4% below list).
- To meet the 1% rule (rent ≥ 1% of price), the offer needs to be $80k (44.3% below list).
- Recommended offer: $80k (44.3% below list) — sets the bar for 1% rule.
Location & tenants
- Location reads 75/100 on livability (#59 in IN, #4,014 nationally) — a middle-class / working-renter tenant base. Strengths: crime A+, cost of living A+, housing A+; Watch: employment C-, schools D+, amenities F.
- Market conditions: 1 comparable units currently listed for rent nearby; 27 units permitted in Warren County in 2024 (0 in 5+ unit buildings).
Forward outlook
- In year one you build about $11k of equity ($992 loan paydown + $10k appreciation (6.8% local appreciation)).
- Warren County population projected at -24% by 2050 — secular population decline; favor cash flow + early exit over multi-decade hold.
- By year 4, paydown + projected appreciation supports a ~$37k cash-out refi (75% LTV) — recoverable capital for the next deal without selling this one.
Negotiation context
- It's been on market 74 days — a 6% lower offer ($135k) is reasonable based on typical stale-listing flexibility.
- 2 sale attempts with the ask held roughly flat each time — persistent listings suggest the price (not the market) is what's stuck; bring a comps-based counter.
- Current owner paid $79k; list at $144k implies a 81% gain — meaningful room to come down on a strong offer.
Risks & watch-outs
- Watch-outs: built in 1951 — expect roof / HVAC / electrical / plumbing capex.
Questions for the listing agent
- What do current leases actually rent for vs. the listed asking? Can we see a recent rent roll and the last 12 months of T-12 income?
- It's been on market 74 days. Have you received any prior offers? Is the seller open to a 44% concession, seller financing, or rate buy-down credit?
- Built in 1951 — when were the roof, HVAC, electrical panel, plumbing, and water heater last replaced?
- Why hasn't it sold? Are there any deal-killer items the seller is aware of (foundation, flood, title, zoning, code violations)?
- Is there a deadline driving the sale (1031 exchange, divorce, estate, relocation)? That informs how much negotiation room exists.
- Schools are D-rated, which usually means shorter tenancies and higher turnover. Who's the typical renter profile here, and what's been the actual vacancy rate?
- The area grade is low — what's the realistic commute time and amenity access for the typical tenant pool here? Any planned neighborhood developments (good or bad) we should know about?
- What's the average days-on-market for RENTAL listings here right now (not sales)? A rising rental-DOM trend means longer vacancies and softer asking-rent achievability than the comps imply.
- What's the recent tenant-quality profile in this submarket — average credit score on applications, eviction rate, late-payment / NSF rate, and stable-employment percentage? A property-management company in the area should have these aggregated.
- How much new for-sale + rental construction is in the pipeline within 1–3 miles? Heavy new supply typically softens prices + rents 12–24 months out; constrained supply supports both.
Investment metrics
- 1% rule
- 0.56% ✗
- Cap rate
- 4.37%
- Cash-on-cash
- -6.88%
- DSCR
- 0.69
- GRM
- 15.0
CMA / ARV
- ARV (median comp)
- $168,750
- List price
- $143,500
- Delta
- -14.96%
- Verdict
- UNDERPRICED
- Comps
- 20 within 1.0 mi
Show comp detail 7 sales within ~0.75 mi
| Address | Dist | Beds/Ba | Sqft | Sold | Price | $/sf | Match |
|---|---|---|---|---|---|---|---|
| 416 E Monroe St | 0.43mi | 2/1.0 | 976 (-5%) | 19mo | $130,000 | $133 | 56 |
| 306 E 3rd St | 0.66mi | 1/1.0 (-1) | 1,052 (+3%) | 8mo | $18,500 | $18 | 54 |
| 131 E 4th St | 0.65mi | 3/2.0 (+1) | 1,013 (-1%) | 6mo | $165,000 | $163 | 53 |
| 218 Cedar St | 0.67mi | 3/1.0 (+1) | 925 (-10%) | 7mo | $153,000 | $165 | 42 |
| 3 & 5 Jackson St | 0.56mi | 3/1.0 (+1) | 972 (-5%) | 24mo | $15,000 | $15 | 40 |
| 811 North St | 0.64mi | 3/1.0 (+1) | 1,104 (+8%) | 19mo | $180,000 | $163 | 36 |
| 306 Thomas St | 0.59mi | 2/1.0 | 1,145 (+12%) | 21mo | $137,500 | $120 | 36 |
Match score weights: distance 35% · size 25% · config 20% · recency 20%. Top-matched comps best support the ARV.
Projected returns pro-forma
6.84% appreciation · 3.0% rent growth · sell at horizon
- IRR
- 11.9%
- Equity multiple
- 1.84×
- Total profit
- $33,913
- Equity at exit
- $97,896
- IRR
- 12.6%
- Equity multiple
- 3.73×
- Total profit
- $109,578
- Equity at exit
- $184,574
Cash invested: $40,180 (down + closing). Projections, not guarantees.
Landlord ↔ Tenant lean methodology
- Overall (STATE)
- 90 Strongly Landlord-Friendly
- State Indiana
- 90 Strongly Landlord-Friendly · R+11
- County
- — inherits STATE
- City
- — inherits STATE
ZIP-level market 47993
- Home prices YoY
- 2.9%
- Price-to-rent
- 15.0×
Monthly cashflow live
- Estimated rent
- $799 medium interval (Pro) →
- Mortgage (P&I)
- −$753
- Tax from tax record
- −$49 /mo · $592/yr
- Insurance
- −$60
- HOA
- −$0
- Vacancy / Maint / Mgmt
- −$168
- Net cashflow
- $-230
Break-even live
UW: 25.0% down · 7.5% · 30yr · 1.5% tax · 5.0% vac · 8.0% maint · 8.0% mgmt
Financing live
Cash to close
- Down payment
- $35,875
- Closing costs
- $4,305
- Reserves months
- —
- Total cash needed
- —
Loan-product check · same deal, 3 products live
Conventional
25% down · 7.5% · 30yr
- Down + closing
- —
- Monthly P&I
- —
- Monthly cashflow
- —
- DSCR
- —
- Eligible?
- —
Personal DTI + credit; lowest rate.
DSCR
20% down · 8.5% · 30yr
- Down + closing
- —
- Monthly P&I
- —
- Monthly cashflow
- —
- DSCR
- —
- Eligible?
- —
No personal income docs; deal must DSCR.
Hard money
10% down · 12.0% · 12mo
- Down + closing
- —
- Monthly P&I
- —
- Monthly cashflow
- —
- DSCR
- —
- Eligible?
- —
Short-term bridge; refi at stabilization.
Rent comps 1 comps
| Address | Beds | Baths | Sqft | Rent | $/sqft | DOM | Units | Dist |
|---|---|---|---|---|---|---|---|---|
| 114 Brown St Williamsport, IN | 2.0 | 1.0 | 721 | $799 | $1.11 | 13d | 1 | 1.21mi |
Listing history 20 events
-
2026-06-19days on market $143,500 Active 74 DOM
-
2026-06-18days on market $143,500 Active 73 DOM
-
2026-06-17days on market $143,500 Active 72 DOM
-
2026-06-16days on market $143,500 Active 71 DOM
-
2026-06-15days on market $143,500 Active 70 DOM
-
2026-06-14days on market $143,500 Active 68 DOM
-
2026-06-13days on market $143,500 Active 67 DOM
-
2026-06-10days on market $143,500 Active 65 DOM
-
2026-06-09days on market $143,500 Active 64 DOM
-
2026-06-08days on market $143,500 Active 63 DOM
-
2026-06-07days on market $143,500 Active 62 DOM
-
2026-06-03days on market $143,500 Active 58 DOM
-
2026-06-02days on market $143,500 Active 57 DOM
-
2026-06-01days on market $143,500 Active 56 DOM
-
2026-05-31days on market $143,500 Active 55 DOM
-
2026-05-30days on market $143,500 Active 54 DOM
-
2026-04-06$148,000 Active 622-char remark
Show marketing remark (604 chars)
Charming 2-Bedroom Home! Welcome to this inviting 2-bedroom, 1-bath home that blends comfort, updates, and opportunity. The main level features brand-new flooring and fresh paint throughout, creating a clean, modern feel that's move-in ready. Downstairs, you'll find a full unfinished basement, providing an open canvas with tons of potential. Whether you're dreaming of a home gym, workshop, additional living space, or extra storage, this area offers the flexibility to make it your own. Outside, enjoy the convenience of a detached 2-car garage, providing ample space for parking, hobbies, or storage.
-
2026-04-06$148,000 Active 604-char remark
Show marketing remark (604 chars)
Charming 2-Bedroom Home! Welcome to this inviting 2-bedroom, 1-bath home that blends comfort, updates, and opportunity. The main level features brand-new flooring and fresh paint throughout, creating a clean, modern feel that's move-in ready. Downstairs, you'll find a full unfinished basement, providing an open canvas with tons of potential. Whether you're dreaming of a home gym, workshop, additional living space, or extra storage, this area offers the flexibility to make it your own. Outside, enjoy the convenience of a detached 2-car garage, providing ample space for parking, hobbies, or storage.
-
2026-02-20soldstatus $79,323
-
2019-06-13soldstatus $75,000
ⓘ Source: listings_history table (triggers on properties + properties_extension) + one-shot
backfill from property_details.listing_events for pre-trigger history.
Tax reassessment forecast IN · Partial reset (capped growth)
- Current annual tax
- $592 · $49/mo
- Projected year-2 tax
- $906 · $75/mo
- Expected delta
- +$314/yr (+$26/mo · 53.1%)
ⓘ Screening estimate from a state-policy table — verify with the county assessor before closing.
Climate risk First Street
- Flood 1/10 Low FEMA zone X (unshaded) · 0% chance over 30 yrs
- Wildfire 1/10 Low
- Heat 3/10 Moderate 7 d/yr ≥103°F today · 18 d/yr by 30 yrs out
- Wind 2/10 Low 0% chance of damaging wind over 30 yrs
- Air quality 3/10 Moderate 2 unhealthy d/yr today · 4 by 30 yrs out
Nearby sold comps map
Loading sold comps map…
Walkable amenities ~0.75 mi
Loading nearby amenities…
Taxation est. · year 1
- Rental income
- $9,588
- − Mortgage interest
- −$8,038
- − Property taxes
- −$592
- − Insurance
- −$718
- − Repairs & maintenance
- −$767
- − Management
- −$767
- − Depreciation
- −$4,175
- Taxable loss
- −$5,468
- Est. tax savings @ 24.0%
- +$1,312
- After-tax cash flow
- $-1,453/yr
For passive investors: Depreciation is non-cash, so a rental often shows a tax loss while cash-flowing — sheltering income. Rental losses are passive: they offset passive income freely, and up to $25,000/yr can offset ordinary (W-2) income if you actively participate and your MAGI is under $100k (phasing out to $0 by $150k); unused losses carry forward. On sale, claimed depreciation is recaptured at up to 25%, and gains may owe capital-gains tax (a 1031 exchange can defer both). Figures are a year-1 estimate at your 24.0% rate — not tax advice; consult a CPA.
Schools (NCES district)
No district data.
Livability — Williamsport
- Score
- 75/100
- State rank
- #59
- US rank
- #4014
Category grades
Schools grade is shown separately in the Schools card above.
Census & demographics
- Census place
- Williamsport, IN
- Population (ZIP)
- 3,667
Population outlook (Warren County) Hauer SSP2
- Today (2025)
- 7,692 people
- By 2030
- 7,331 · -4.7%
- By 2040
- 6,581 · -14.4%
- By 2050
- 5,853 · -23.9%
- By 2075
- 4,692 · -39.0%
- By 2100
- 3,985 · -48.2%
Race, ethnicity, and origin ACS 2023
- Neighborhood character
- Predominantly White (97%)
- Race & ethnicity
- White 97% Two or more races 3%
- Common ancestry
- Slovak 3% Portuguese 2% Italian 1%
- Foreign-born
- 1%
Political lean MEDSL · Warren
- 2024 margin
- Solid R (+57.3) · D 20.6% · R 77.8% · Other 1.6%
- 2008→2024 swing
- -47.0pp toward R · 2008: -10.3pp · 2024: -57.3pp
- All cycles
- 2024: R+57.3 2020: R+54.3 2016: R+52.5 2012: R+27.7 2008: R+10.3
Not yet ingested
- Civics
- —
Market trends
- HPI YoY
- ▲ 6.84%
- Current HPI
- 245.607
- Rent YoY
- —
- Metro
- —
- State GDP YoY
- ▲ 2.90%
- F500 in state
- 18
Industry mix (Fortune 500 HQ in IN)
| Industry | F500 HQs | Revenue |
|---|---|---|
| Industrial Machinery | 2 | $37B |
|
||
| Healthcare | 1 | $177B |
|
||
| Pharmaceuticals | 1 | $45B |
|
||
| Metals / Steel | 1 | $18B |
|
||
| Agriculture | 1 | $17B |
|
||
| Packaging | 1 | $12B |
|
||
Price history
+97.3% since first listed4 events — show timeline
- 2026-04-06 Listed $148,000 IRMLS
- 2026-04-06 Listed $148,000 MIBOR as Distributed by MLS Grid
- 2026-02-20 Sold (Public Records) $79,323 Public Records
- 2019-06-13 Sold (Public Records) $75,000 Public Records
Property tax history
+7.0%/yrLatest (2024): $592 · -17.3% YoY. Source: county tax records.
Cash-flow waterfall
monthlySold comps — $/sqft
last 12 mo · ≤1 miLoading sold comps…