2414 W Malone St · Peoria, IL
Flood risk 1/10 · Minimal
- FEMA flood zone
- X
- Chance of flooding over 30 yrs
- 0.0%
- Est. flood insurance / yr
- $473 – $860
Fire risk 1/10 · Minimal
- Est. fire insurance / yr
- $804 – $1,492
Heat risk 3/10 · Minor
- Hot days now (above 105°F)
- 7 days/yr
- Hot days in 30 yrs
- 18 days/yr
Wind risk 2/10 · Minimal
- Chance of severe wind over 30 yrs
- 1.0%
Air-quality risk 3/10 · Minor
- Unhealthy air days now
- 1 days/yr
- Unhealthy air days in 30 yrs
- 3 days/yr
Risk factors via First Street. Map © Google.
Why this score? — see what drove the B grade
The composite is a weighted blend of 9 inputs, each scored 0–100. Each bar is that input's sub-score; the figure is the points it added to the 100-point composite (weight × sub-score).
- Cash flow +30.0/30.0
- 1% rule +10.0/10.0
- DSCR +10.0/10.0
- ARV discount +8.2/15.0
- Appreciation +5.3/10.0
- Livability +3.7/5.0
- Rent growth +2.5/5.0
- Condition / age +2.5/5.0
- Schools +1.1/10.0
$25,000
🖨 Deal sheet 📄 Offer letter ✓ Due diligence
Listing remarks MLS
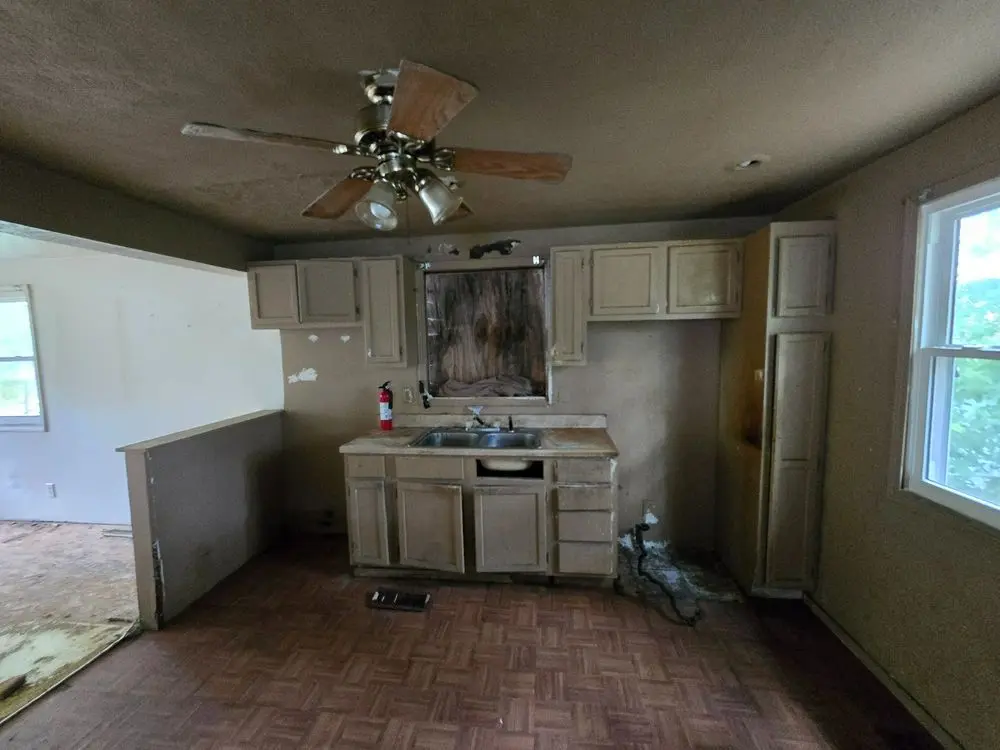
Investment Opportunity Alert! Check out this fantastic property at 2414 West Malone St. Peoria IL 61605! This 1 bed, 1 bath home offers an 672 sqft and is just waiting for your personal touch. While it needs some TLC, its priced to sell fast, making it a perfect candidate for a fix and flip or a project home! Dont Miss Out! With plenty of potential, this home is ready for your creative vision! Location: Peoria, IL Opportunity: Unlimited! For more details or to schedule a viewing, contact: Joan Olson: 727-263-3034 [email protected] Cash buyers only $500 EMD 7 day inspection 30 days to close
Key facts
- 4,820 sq ft lot
- Built 1950
- Listed 260 days
Neighborhood map
What this means for you Summary
Snapshot
- This is a 1-bed/1.0-bath single-family listed at $25k.
Deal economics
- At list price, monthly cash flow is $512 ($6k/yr) — positive.
- The deal already cash-flows at list — no discount required.
- Meets the 1% rule at list price ($878 rent vs $25k).
- Recommended offer: $22k (12.0% below list) — sets the bar for market timing.
- Cap rate 30.9% vs local median 5.6% in Peoria — top-decile yield for the area; either an underpriced asset or a hidden risk that comps aren't pricing in. Stress-test before assuming the spread holds.
Location & tenants
- Location reads 73/100 on livability (#270 in IL) — a middle-class / working-renter tenant base. Strengths: commute A+, cost of living A+, housing A+; Watch: employment D+, schools F, crime F.
- Peoria SD 150 (urban): math 11% / reading 14% proficiency, ranked #554 of 620 in IL (top 89%) — low school quality limits family demand, transient renter base, plan for 1-2y turnover; 70% free/reduced lunch — lower-income household profile, screen leases tightly.
- Market conditions: 42 active listings in the ZIP; 5 comparable units currently listed for rent nearby; rentals at typical pace (median 21d on market — plan ~3-4 weeks tenant-placement turnaround); lower-income renter base — watch delinquency; 73 units permitted in Peoria County in 2024 (0 in 5+ unit buildings).
- This rent runs 40% of the median local income ($26k/yr) — at the standard rent-burdened threshold; future hikes will face affordability resistance.
Forward outlook
- In year one you build about $331 of equity ($173 loan paydown + $158 appreciation (0.6% local appreciation)).
- Peoria County population projected at -11% by 2050 — secular population decline; favor cash flow + early exit over multi-decade hold.
- At projected returns (0.6% appreciation + 3.0% rent growth), your $7k cash investment doubles in ~2 years — after that, you're playing with house money.
Negotiation context
- It's been on market 260 days — a 12% lower offer ($22k) is reasonable based on typical stale-listing flexibility.
- 7 sale attempts since 12y ago with the ask held roughly flat each time — persistent listings suggest the price (not the market) is what's stuck; bring a comps-based counter.
- Current owner paid $10k; list at $25k implies a 163% gain — meaningful room to come down on a strong offer.
Risks & watch-outs
- Watch-outs: built in 1950 — expect roof / HVAC / electrical / plumbing capex.
Questions for the listing agent
- It's been on market 260 days. Have you received any prior offers? Is the seller open to a 12% concession, seller financing, or rate buy-down credit?
- Built in 1950 — when were the roof, HVAC, electrical panel, plumbing, and water heater last replaced?
- Why hasn't it sold? Are there any deal-killer items the seller is aware of (foundation, flood, title, zoning, code violations)?
- Is there a deadline driving the sale (1031 exchange, divorce, estate, relocation)? That informs how much negotiation room exists.
- Schools are F-rated, which usually means shorter tenancies and higher turnover. Who's the typical renter profile here, and what's been the actual vacancy rate?
- Crime grade is F in this area — have there been break-ins, vandalism, or insurance claims at this property in the last 3 years? What carrier currently insures it and at what premium?
- What's the average days-on-market for RENTAL listings here right now (not sales)? A rising rental-DOM trend means longer vacancies and softer asking-rent achievability than the comps imply.
- What's the recent tenant-quality profile in this submarket — average credit score on applications, eviction rate, late-payment / NSF rate, and stable-employment percentage? A property-management company in the area should have these aggregated.
- How much new for-sale + rental construction is in the pipeline within 1–3 miles? Heavy new supply typically softens prices + rents 12–24 months out; constrained supply supports both.
Investment metrics
- 1% rule
- 3.51% ✓
- Cap rate
- 30.89%
- Cash-on-cash
- 87.86%
- DSCR
- 4.91
- GRM
- 2.4
CMA / ARV
- ARV (median comp)
- $25,369
- List price
- $25,000
- Delta
- -1.45%
- Verdict
- FAIR
- Comps
- 20 within 1.0 mi
Show comp detail 12 sales within ~0.75 mi
| Address | Dist | Beds/Ba | Sqft | Sold | Price | $/sf | Match |
|---|---|---|---|---|---|---|---|
| 2304 W Proctor St | 0.29mi | 2/1.0 (+1) | 672 (0%) | 4mo | $39,500 | $59 | 78 |
| 3000 Wiswall St | 0.58mi | 2/1.0 (+1) | 676 (+1%) | 1mo | $32,000 | $47 | 66 |
| 2414 W Lincoln Ave | 0.44mi | 2/1.0 (+1) | 660 (-2%) | 7mo | $46,500 | $70 | 66 |
| 2106 W Wiswall St | 0.47mi | 2/1.0 (+1) | 672 (0%) | 9mo | $21,000 | $31 | 66 |
| 2322 W Marquette St | 0.14mi | 2/1.0 (+1) | 768 (+14%) | 2mo | $33,000 | $43 | 63 |
| 1516 S Lydia Ave | 0.36mi | 2/1.0 (+1) | 716 (+6%) | 10mo | $31,000 | $43 | 59 |
| 1509 S Western Ave | 0.49mi | 1/1.0 | 720 (+7%) | 8mo | $12,000 | $17 | 59 |
| 1609 S Idaho St | 0.55mi | 2/1.0 (+1) | 720 (+7%) | 6mo | $40,000 | $56 | 52 |
| 2616 W Fremont St | 0.30mi | 2/1.0 (+1) | 760 (+13%) | 9mo | $52,000 | $68 | 52 |
| 1508 S Lydia Ave | 0.35mi | 1/1.0 | 588 (-12%) | 14mo | $17,000 | $29 | 51 |
| 3214 W Proctor Pl | 0.71mi | 2/1.0 (+1) | 720 (+7%) | 5mo | $37,000 | $51 | 46 |
| 2725 W Lincoln Ave | 0.53mi | 2/1.0 (+1) | 770 (+15%) | 2mo | $32,100 | $42 | 45 |
Match score weights: distance 35% · size 25% · config 20% · recency 20%. Top-matched comps best support the ARV.
Projected returns pro-forma
0.63% appreciation · 3.0% rent growth · sell at horizon
- IRR
- 90.7%
- Equity multiple
- 5.67×
- Total profit
- $32,681
- Equity at exit
- $8,060
- IRR
- 91.6%
- Equity multiple
- 11.67×
- Total profit
- $74,718
- Equity at exit
- $10,353
Cash invested: $7,000 (down + closing). Projections, not guarantees.
Landlord ↔ Tenant lean methodology
- Overall (STATE)
- 43 Moderately Tenant-Leaning
- State Illinois
- 43 Moderately Tenant-Leaning · D+7
- County
- — inherits STATE
- City
- — inherits STATE
ZIP-level market 61605
- Home prices YoY
- 0.4%
- Active inventory
- 42
- Price-to-rent
- 2.4×
Monthly cashflow live
- Estimated rent
- $878 high interval (Pro) →
- Mortgage (P&I)
- −$131
- Tax from tax record
- −$40 /mo · $478/yr
- Insurance
- −$10
- HOA
- −$0
- Vacancy / Maint / Mgmt
- −$184
- Net cashflow
- $512
Break-even live
UW: 25.0% down · 7.5% · 30yr · 1.5% tax · 5.0% vac · 8.0% maint · 8.0% mgmt
Financing live
Cash to close
- Down payment
- $6,250
- Closing costs
- $750
- Reserves months
- —
- Total cash needed
- —
Loan-product check · same deal, 3 products live
Conventional
25% down · 7.5% · 30yr
- Down + closing
- —
- Monthly P&I
- —
- Monthly cashflow
- —
- DSCR
- —
- Eligible?
- —
Personal DTI + credit; lowest rate.
DSCR
20% down · 8.5% · 30yr
- Down + closing
- —
- Monthly P&I
- —
- Monthly cashflow
- —
- DSCR
- —
- Eligible?
- —
No personal income docs; deal must DSCR.
Hard money
10% down · 12.0% · 12mo
- Down + closing
- —
- Monthly P&I
- —
- Monthly cashflow
- —
- DSCR
- —
- Eligible?
- —
Short-term bridge; refi at stabilization.
Rent comps 5 comps
| Address | Beds | Baths | Sqft | Rent | $/sqft | DOM | Units | Dist |
|---|---|---|---|---|---|---|---|---|
| 2822 W Antoinette St Peoria, IL | 2.0 | 1.0 | 720 | $1,149 | $1.60 | 21d | 1 | 0.36mi |
| 2317 W Martin Luther King Junior Dr Unit 1-106 Peoria, IL | 1.0 | 1.0 | 588 | $775 | $1.32 | 43d | 1 | 0.72mi |
| 2317 W Martin Luther King Junior Dr Peoria, IL | 1.0–2.0 | 1.0 | 697 | $775 | $1.11 | 13d | 3 | 0.72mi |
| 945 S Shelley St Peoria, IL | 1.0–3.0 | 1.0–2.0 | 929 | $795 | $0.86 | 13d | 1 | 0.80mi |
| 2807 W Nevada St Peoria, IL | 1.0 | 1.0 | 540 | $629 | $1.16 | 21d | 1 | 0.98mi |
Listing history 35 events
-
2026-06-19days on market $25,000 Active 260 DOM
-
2026-06-18days on market $25,000 Active 259 DOM
-
2026-06-17days on market $25,000 Active 258 DOM
-
2026-06-16days on market $25,000 Active 257 DOM
-
2026-06-15days on market $25,000 Active 256 DOM
-
2026-06-14days on market $25,000 Active 254 DOM
-
2026-06-13days on market $25,000 Active 253 DOM
-
2026-06-10days on market $25,000 Active 251 DOM
-
2026-06-09days on market $25,000 Active 250 DOM
-
2026-06-08days on market $25,000 Active 249 DOM
-
2026-06-07days on market $25,000 Active 248 DOM
-
2026-06-03days on market $25,000 Active 244 DOM
-
2026-06-02days on market $25,000 Active 243 DOM
-
2026-06-01days on market $25,000 Active 242 DOM
-
2026-05-31days on market $25,000 Active 241 DOM
-
2026-05-30days on market $25,000 Active 240 DOM
-
2025-11-21historical $472
-
2025-10-02$25,000 Active 613-char remark
Show marketing remark (613 chars)
Investment Opportunity Alert! Check out this fantastic property at 2414 West Malone St. Peoria IL 61605! This 1 bed, 1 bath home offers an 672 sqft and is just waiting for your personal touch. While it needs some TLC, its priced to sell fast, making it a perfect candidate for a fix and flip or a project home! Dont Miss Out! With plenty of potential, this home is ready for your creative vision! Location: Peoria, IL Opportunity: Unlimited! For more details or to schedule a viewing, contact: Joan Olson: 727-263-3034 [email protected] Cash buyers only $500 EMD 7 day inspection 30 days to close
-
2025-05-01$472
-
2025-01-10historical $472
-
2024-12-12$472
-
2023-08-29historical
-
2023-08-28
-
2023-08-24historical
-
2023-08-10
-
2021-08-06historical
-
2021-08-06historical
-
2021-08-06historical
-
2021-04-16soldstatus $9,500
-
2021-04-14$9,500
-
2014-12-08soldstatus $4,400
-
2014-10-28$11,990
-
2007-09-05soldstatus $37,000
-
2006-07-25soldstatus $4,500
-
2006-05-04soldstatus $3,000
ⓘ Source: listings_history table (triggers on properties + properties_extension) + one-shot
backfill from property_details.listing_events for pre-trigger history.
Tax reassessment forecast IL · Partial reset (capped growth)
- Current annual tax
- $478 · $40/mo
- Projected year-2 tax
- $523 · $44/mo
- Expected delta
- +$45/yr (+$4/mo · 9.4%)
ⓘ Screening estimate from a state-policy table — verify with the county assessor before closing.
Climate risk First Street
- Flood 1/10 Low FEMA zone X · 0% chance over 30 yrs
- Wildfire 1/10 Low
- Heat 3/10 Moderate 7 d/yr ≥105°F today · 18 d/yr by 30 yrs out
- Wind 2/10 Low 100% chance of damaging wind over 30 yrs
- Air quality 3/10 Moderate 1 unhealthy d/yr today · 3 by 30 yrs out
Nearby sold comps map
Loading sold comps map…
Walkable amenities ~0.75 mi
Loading nearby amenities…
Taxation est. · year 1
- Rental income
- $10,539
- − Mortgage interest
- −$1,400
- − Property taxes
- −$478
- − Insurance
- −$125
- − Repairs & maintenance
- −$843
- − Management
- −$843
- − Depreciation
- −$727
- Taxable income
- $6,122
- Est. tax owed @ 24.0%
- −$1,469
- After-tax cash flow
- $4,681/yr
For passive investors: Depreciation is non-cash, so a rental often shows a tax loss while cash-flowing — sheltering income. Rental losses are passive: they offset passive income freely, and up to $25,000/yr can offset ordinary (W-2) income if you actively participate and your MAGI is under $100k (phasing out to $0 by $150k); unused losses carry forward. On sale, claimed depreciation is recaptured at up to 25%, and gains may owe capital-gains tax (a 1031 exchange can defer both). Figures are a year-1 estimate at your 24.0% rate — not tax advice; consult a CPA.
Schools (NCES district)
- District
- Peoria SD 150
- NCES district ID
- 1731230
- Math proficiency
- 11% ▼ -5.00%
- Reading proficiency
- 14% ▼ -4.00%
- Median HH income
- $41,951
- Composite
- 10.92/100
- National rank
- #9751
- State rank
- #554 of 620 in IL
Livability — Peoria
- Score
- 73/100
- State rank
- #270
- US rank
- #5096
Category grades
Schools grade is shown separately in the Schools card above.
Census & demographics
- Census place
- Peoria, IL
- County
- Peoria County · 120,495 people
- City population
- 114,670
- Metro
- Peoria, IL
- Population (ZIP)
- 13,424
- Household income
- $26,392
- Rent vs Own
- Severe rent burden
- 1385.0
Population outlook (Peoria County) Hauer SSP2
- Today (2025)
- 183,007 people
- By 2030
- 179,643 · -1.8%
- By 2040
- 171,782 · -6.1%
- By 2050
- 163,508 · -10.7%
- By 2075
- 140,178 · -23.4%
- By 2100
- 114,493 · -37.4%
Race, ethnicity, and origin ACS 2023
- Neighborhood character
- Diverse neighborhood (Simpson 0.61)
- Race & ethnicity
- Black 56% White 27% Hispanic / Latino 12% Two or more races 7% Native American 1%
- Hispanic origin (detail)
- Mexican 8%
- Common ancestry
- Lithuanian 1% Iranian 1% Portuguese 1%
- Foreign-born
- 4% · Canada, Vietnam
- Languages at home
- 92% English-only · Spanish 7%
Political lean MEDSL · Peoria
- 2024 margin
- Toss-up / Even · D 51.5% · R 46.9% · Other 1.6%
- 2008→2024 swing
- -9.2pp toward R · 2008: 13.9pp · 2024: 4.7pp
- All cycles
- 2024: D+4.7 2020: D+6.3 2016: D+2.8 2012: D+4.4 2008: D+13.9
Not yet ingested
- Civics
- —
Market trends
- HPI YoY
- ▲ 0.63%
- Current HPI
- 170.5814
- Rent YoY
- —
- Metro
- Peoria, IL
- State GDP YoY
- ▲ 1.59%
- F500 in state
- 60
Industry mix (Fortune 500 HQ in IL)
| Industry | F500 HQs | Revenue |
|---|---|---|
| Insurance | 4 | $201B |
|
||
| Consumer Goods | 4 | $87B |
|
||
| Industrial Machinery | 3 | $64B |
|
||
| Healthcare | 2 | $55B |
|
||
| Retail / Pharmacy | 1 | $148B |
|
||
| Agriculture / Food | 1 | $86B |
|
||
Price history
+733.3% since first listed19 events — show timeline
- 2025-11-21 Rental Removed $472 Hemlane
- 2025-10-02 Listed $25,000 ForSaleByOwner.com
- 2025-05-01 Listed for Rent $472 Hemlane
- 2025-01-10 Rental Removed $472 RENT.
- 2024-12-12 Listed for Rent $472 RENT.
- 2023-08-29 Rental Removed — RENT.
- 2023-08-28 Listed for Rent — RENT.
- 2023-08-24 Rental Removed — RENT.
- 2023-08-10 Listed for Rent — RENT.
- 2021-08-06 Listing Removed — RMLSA as Distributed by MLS Grid
- 2021-08-06 Listing Removed — RMLSA as Distributed by MLS Grid
- 2021-08-06 Listing Removed — RMLSA as Distributed by MLS Grid
- 2021-04-16 Sold (MLS) $9,500 RMLSA as Distributed by MLS Grid
- 2021-04-14 Listed $9,500 RMLSA as Distributed by MLS Grid
- 2014-12-08 Sold (MLS) $4,400 RMLSA as Distributed by MLS Grid
- 2014-10-28 Listed $11,990 RMLSA as Distributed by MLS Grid
- 2007-09-05 Sold (Public Records) $37,000 Public Records
- 2006-07-25 Sold (Public Records) $4,500 Public Records
- 2006-05-04 Sold (Public Records) $3,000 Public Records
Property tax history
-0.4%/yrLatest (2024): $478 · +4.9% YoY. Source: county tax records.
Cash-flow waterfall
monthlySold comps — $/sqft
last 12 mo · ≤1 miLoading sold comps…