 🏢 Co-op
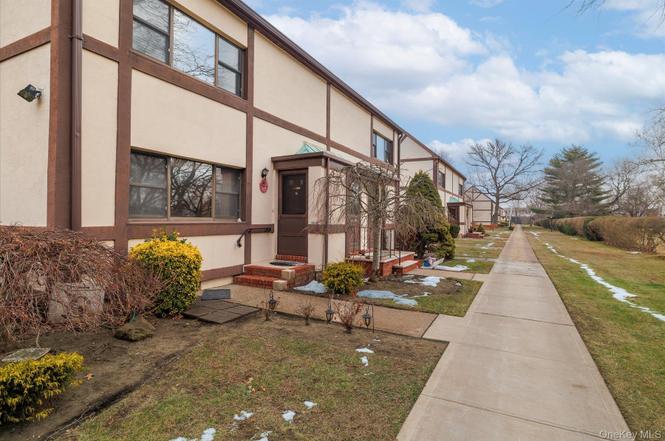
105 15th St Unit A1 · Garden City, NY
Flood risk 1/10 · Minimal
- FEMA flood zone
- X (unshaded)
- Chance of flooding over 30 yrs
- 0.0%
- Est. flood insurance / yr
- $473 – $860
Fire risk 1/10 · Minimal
- Est. fire insurance / yr
- $691 – $1,283
Heat risk 6/10 · Moderate
- Hot days now (above 97°F)
- 7 days/yr
- Hot days in 30 yrs
- 16 days/yr
Wind risk 6/10 · Moderate
- Chance of severe wind over 30 yrs
- 27.0%
Air-quality risk 4/10 · Minor
- Unhealthy air days now
- 5 days/yr
- Unhealthy air days in 30 yrs
- 8 days/yr
Risk factors via First Street. Map © Google.
Why this score? — see what drove the C- grade
The composite is a weighted blend of 9 inputs, each scored 0–100. Each bar is that input's sub-score; the figure is the points it added to the 100-point composite (weight × sub-score).
- Cash flow +16.6/30.0
- Schools +8.2/10.0
- ARV discount +7.5/15.0
- DSCR +5.2/10.0
- 1% rule +4.5/10.0
- Livability +4.2/5.0
- Rent growth +2.5/5.0
- Condition / age +2.5/5.0
- Appreciation +0.0/10.0
$340,000
🖨 Deal sheet 📄 Offer letter ✓ Due diligence
Listing remarks
Welcome to this beautifully maintained first floor one bedroom, one bath coop in Cherry Valley. Featuring freshly painted interiors and refinished hardwood floors, this quiet end unit is located in a peaceful, park-like courtyard setting. This bright, sun-filled unit features hardwood flooring throughout, central air and a spacious eat-in kitchen. Fantastic location convenient to LIRR (Mineola station . 5 mile), NYU Langone Hospital, Adelphi University, courthouses, shopping, parks, restaurants and all the amenities of beautiful Garden City. Parking: $35/month lot or $65/month for garage parking (waitlist). Maintenance is $990.56/month including taxes. Board approval required with 20% down.
Key facts
- Convenient to lirr
- First floor
- Eat-in kitchen
Tags
Neighborhood map
What this means for you Summary
Snapshot
- This is a 1-bed/1.0-bath condo listed at $340k.
Deal economics
- At list price, monthly cash flow is $206 ($2k/yr) — positive.
- The deal already cash-flows at list — no discount required.
- To meet the 1% rule (rent ≥ 1% of price), the offer needs to be $323k (4.9% below list).
- Recommended offer: $323k (4.9% below list) — sets the bar for 1% rule.
- Cap rate 7.0% vs local median 2.2% in Garden City — top-decile yield for the area; either an underpriced asset or a hidden risk that comps aren't pricing in. Stress-test before assuming the spread holds.
Location & tenants
- Location reads 84/100 on livability (#45 in NY, #695 nationally) — a professional / high-income tenant draw. Strengths: commute A+, employment A+, crime A; Watch: cost of living F.
- Garden City Union Free School District (suburban): math 89% / reading 84% proficiency, ranked #16 of 590 in NY (top 3%) — strong family-tenant draw, lease renewals of 3-5y typical; only 1% free/reduced lunch — higher-income household profile.
- Zoned schools: Stewart School (math 85% / reading 82%, grade A+, #128 of 2,108 statewide, top 6%, 707 students, 3% FRL); Garden City Middle School (math 88% / reading 87%, grade A+, #8 of 729 statewide, top 1%, 928 students, 4% FRL); Garden City High School (math 100% / reading 82%, grade A+, #226 of 1,100 statewide, top 21%, 1,090 students, 6% FRL) — zoned schools at 4% FRL track the district average.
- Market conditions: 134 active listings in the ZIP; 13 comparable units currently listed for rent nearby; rentals at typical pace (median 19d on market — plan ~3-4 weeks tenant-placement turnaround); high-income renter base; 824 units permitted in Nassau County in 2024 (153 in 5+ unit buildings).
- This rent is only 17% of the median local income ($228k/yr) — well below the 30% rent-burden line; pricing power to push rent on renewal without tenant pushback.
Forward outlook
- Local home prices are declining (-3.0%/yr); year-one equity from $2k of loan paydown is wiped out by about $10k of value loss. Plan a longer hold.
- Nassau County population projected at +7% by 2050 — modest demand growth; plan on rents tracking national, not racing it.
Negotiation context
- Only 6 days on market — expect competitive offers; lowballing is unlikely to land.
Risks & watch-outs
- Watch-outs: built in 1950 — expect roof / HVAC / electrical / plumbing capex.
- Climate carrying-cost: major wind risk, 27% chance of damaging wind over 30y; extreme-heat days projected 7→16/yr by 2055 (HVAC capex compounding) — expect insurance premiums to compound above CPI over the hold.
Questions for the listing agent
- Built in 1950 — when were the roof, HVAC, electrical panel, plumbing, and water heater last replaced?
- Any open or pending special assessments — roof, HVAC, plumbing, elevator, façade? What's the per-unit balance and payoff schedule, and is the seller paying it off at close or rolling it to the buyer?
- Is there a deadline driving the sale (1031 exchange, divorce, estate, relocation)? That informs how much negotiation room exists.
- Schools are A-rated — typically a magnet for longer-tenancy family renters. What's the average tenant stay here, and is there a school-zone premium baked into asking?
- What's the average days-on-market for RENTAL listings here right now (not sales)? A rising rental-DOM trend means longer vacancies and softer asking-rent achievability than the comps imply.
- What's the recent tenant-quality profile in this submarket — average credit score on applications, eviction rate, late-payment / NSF rate, and stable-employment percentage? A property-management company in the area should have these aggregated.
- How much new apartment / multifamily construction is in the pipeline within 1–3 miles? Heavy new supply (>2% of stock underway) typically softens rents 12–24 months out; light construction supports rent growth.
Investment metrics
- 1% rule
- 0.95% ✗
- Cap rate
- 7.02%
- Cash-on-cash
- 2.59%
- DSCR
- 1.12
- GRM
- 8.8
CMA / ARV
No comps found within radius.
Projected returns pro-forma
-3.0% appreciation · 3.0% rent growth · sell at horizon
- IRR
- -12.2%
- Equity multiple
- 0.56×
- Total profit
- $-41,946
- Equity at exit
- $50,695
- IRR
- -3.0%
- Equity multiple
- 0.80×
- Total profit
- $-19,458
- Equity at exit
- $29,397
Cash invested: $95,200 (down + closing). Projections, not guarantees.
Landlord ↔ Tenant lean methodology
- Overall (STATE)
- 15 Strongly Tenant-Friendly
- State New York
- 15 Strongly Tenant-Friendly · D+10
- County
- — inherits STATE
- City
- — inherits STATE
ZIP-level market 11530
- Active inventory
- 134
- Price-to-rent
- 8.8×
Monthly cashflow live
- Estimated rent
- $3,235 high interval (Pro) →
- Mortgage (P&I)
- −$1,783
- Tax est. 1.5%
- −$425 /mo · $5,100/yr
- Insurance
- −$142
- HOA
- −$0
- Vacancy / Maint / Mgmt
- −$679
- Net cashflow
- $206
Break-even live
UW: 25.0% down · 7.5% · 30yr · 1.5% tax · 5.0% vac · 8.0% maint · 8.0% mgmt
Financing live
Cash to close
- Down payment
- $85,000
- Closing costs
- $10,200
- Reserves months
- —
- Total cash needed
- —
Loan-product check · same deal, 3 products live
Conventional
25% down · 7.5% · 30yr
- Down + closing
- —
- Monthly P&I
- —
- Monthly cashflow
- —
- DSCR
- —
- Eligible?
- —
Personal DTI + credit; lowest rate.
DSCR
20% down · 8.5% · 30yr
- Down + closing
- —
- Monthly P&I
- —
- Monthly cashflow
- —
- DSCR
- —
- Eligible?
- —
No personal income docs; deal must DSCR.
Hard money
10% down · 12.0% · 12mo
- Down + closing
- —
- Monthly P&I
- —
- Monthly cashflow
- —
- DSCR
- —
- Eligible?
- —
Short-term bridge; refi at stabilization.
Rent comps 13 comps
| Address | Beds | Baths | Sqft | Rent | $/sqft | DOM | Units | Dist |
|---|---|---|---|---|---|---|---|---|
| 127 Mineola Blvd #1 Mineola, NY | 1.0 | 1.0 | 443 | $2,200 | $4.97 | 24d | 1 | 0.41mi |
| 140 Old Country Rd Mineola, NY | 1.0–2.0 | 1.0–2.0 | 912 | $3,574 | $3.92 | 1d | 13 | 0.41mi |
| 162 2nd St Unit 4 Mineola, NY | 2.0 | 1.0 | 750 | $3,600 | $4.80 | 12d | 1 | 0.46mi |
| 1 3rd St Unit 1033 Mineola, NY | 1.0 | 1.0 | 700 | $3,900 | $5.57 | 43d | 1 | 0.59mi |
| 1 3rd St Unit 921 Mineola, NY | 1.0 | 1.0 | 700 | $3,750 | $5.36 | 43d | 1 | 0.59mi |
| 119 Searing Ave Mineola, NY | 2.0 | 1.0–2.0 | 946 | $4,028 | $4.26 | 1d | 13 | 0.63mi |
| 203 Willis Ave Apt 3E Mineola, NY | 1.0 | 1.0 | 650 | $2,200 | $3.38 | 43d | 1 | 0.67mi |
| 101 Clinton Ave Unit 1G Mineola, NY | 1.0 | 1.0 | 750 | $2,500 | $3.33 | 43d | 1 | 0.69mi |
| 133 Lincoln Ave Unit C Mineola, NY | 2.0 | 1.0 | 450 | $3,000 | $6.67 | 43d | 1 | 0.71mi |
| 269 Willis Ave Unit N Mineola, NY | 1.0 | 1.0 | 750 | $2,500 | $3.33 | 13d | 1 | 0.82mi |
| 365 Stewart Ave Garden City, NY | 1.0–2.0 | 1.0–2.0 | 1034 | $3,220 | $3.11 | 1d | 1 | 0.85mi |
| 2 Laurel Dr Mineola, NY | 2.0 | 1.0–2.0 | 641 | $2,848 | $4.44 | 1d | 15 | 1.14mi |
| 8 Lafayette St Williston Park, NY | 1.0 | 1.0 | 500 | $2,200 | $4.40 | 19d | 1 | 1.41mi |
HOA detail condo
- Monthly dues
- $0 · $0/yr
- Assessments
- None detected in remarks — confirm with the listing agent.
Listing history 2 events
-
2026-01-31status Pending
-
2026-01-06$340,000 Active
ⓘ Source: listings_history table (triggers on properties + properties_extension) + one-shot
backfill from property_details.listing_events for pre-trigger history.
Climate risk First Street
- Flood 1/10 Low FEMA zone X (unshaded) · 0% chance over 30 yrs
- Wildfire 1/10 Low
- Heat 6/10 Major 7 d/yr ≥97°F today · 16 d/yr by 30 yrs out
- Wind 6/10 Major 27% chance of damaging wind over 30 yrs
- Air quality 4/10 Moderate 5 unhealthy d/yr today · 8 by 30 yrs out
Nearby sold comps map
Loading sold comps map…
Walkable amenities ~0.75 mi
Loading nearby amenities…
Taxation est. · year 1
- Rental income
- $38,815
- − Mortgage interest
- −$19,045
- − Property taxes
- −$5,100
- − Insurance
- −$1,700
- − Repairs & maintenance
- −$3,105
- − Management
- −$3,105
- − Depreciation
- −$9,891
- Taxable loss
- −$3,131
- Est. tax savings @ 24.0%
- +$751
- After-tax cash flow
- $3,220/yr
For passive investors: Depreciation is non-cash, so a rental often shows a tax loss while cash-flowing — sheltering income. Rental losses are passive: they offset passive income freely, and up to $25,000/yr can offset ordinary (W-2) income if you actively participate and your MAGI is under $100k (phasing out to $0 by $150k); unused losses carry forward. On sale, claimed depreciation is recaptured at up to 25%, and gains may owe capital-gains tax (a 1031 exchange can defer both). Figures are a year-1 estimate at your 24.0% rate — not tax advice; consult a CPA.
Schools (NCES district)
- District
- Garden City Union Free School District
- NCES district ID
- 3611760
- Math proficiency
- 89% ▲ 3.00%
- Reading proficiency
- 84% ▲ 6.00%
- Median HH income
- $147,057
- Composite
- 82.35/100
- National rank
- #33
- State rank
- #16 of 590 in NY
Livability — Garden City
- Score
- 84/100
- State rank
- #45
- US rank
- #695
Category grades
Schools grade is shown separately in the Schools card above.
Census & demographics
- Census place
- Garden City, NY
- County
- Nassau County · 653,051 people
- City population
- 27,939
- Metro
- New York-Newark-Jersey City, NY-NJ-PA
- Population (ZIP)
- 27,939
- Household income
- $228,143
- Rent vs Own
- Severe rent burden
- 329.0
Population outlook (Nassau County) Hauer SSP2
- Today (2025)
- 1,409,302 people
- By 2030
- 1,431,482 · +1.6%
- By 2040
- 1,471,607 · +4.4%
- By 2050
- 1,502,845 · +6.6%
- By 2075
- 1,575,403 · +11.8%
- By 2100
- 1,554,356 · +10.3%
Race, ethnicity, and origin ACS 2023
- Neighborhood character
- Predominantly White (82%)
- Race & ethnicity
- White 82% Hispanic / Latino 7% Two or more races 6% Asian 6% Black 1%
- Hispanic origin (detail)
- Puerto Rican 2%
- Common ancestry
- Romanian 4% Danish 1% Lithuanian 1%
- Foreign-born
- 10% · Canada, China, South Korea
- Languages at home
- 87% English-only · Other Indo-European 4% Spanish 4% Chinese 3%
Political lean MEDSL · Nassau
- 2024 margin
- Toss-up / Even · D 47.9% · R 52.1%
- 2008→2024 swing
- -12.6pp toward R · 2008: 8.4pp · 2024: -4.2pp
- All cycles
- 2024: R+4.2 2020: D+9.5 2016: D+5.3 2012: D+6.7 2008: D+8.4
Not yet ingested
- Civics
- —
Market trends
- HPI YoY
- ▼ -738.90%
- Current HPI
- 274.0981
- Rent YoY
- —
- Metro
- New York-Newark-Jersey City, NY-NJ-PA
- State GDP YoY
- ▲ 2.60%
- F500 in state
- 92
Industry mix (Fortune 500 HQ in NY)
| Industry | F500 HQs | Revenue |
|---|---|---|
| Financial Services | 10 | $950B |
|
||
| Consumer Goods | 9 | $162B |
|
||
| Insurance | 4 | $225B |
|
||
| Telecommunications | 2 | $144B |
|
||
| Pharmaceuticals | 2 | $112B |
|
||
| Media / Entertainment | 2 | $69B |
|
||
Price history
2 events — show timeline
- 2026-01-31 Pending — OneKey® MLS as Distributed by MLS Grid
- 2026-01-06 Listed $340,000 OneKey® MLS as Distributed by MLS Grid
Cash-flow waterfall
monthlySold comps — $/sqft
last 12 mo · ≤1 miLoading sold comps…