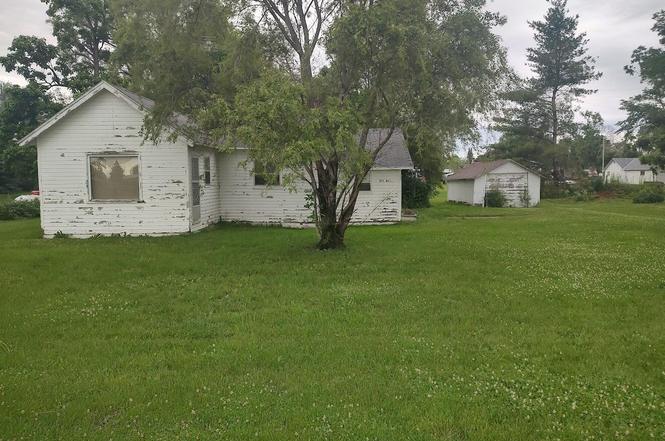
205 Ash St · Pisgah, IA
Flood risk 4/10 · Minor
- FEMA flood zone
- A
- Chance of flooding over 30 yrs
- 0.22%
- Est. flood insurance / yr
- $1,009 – $1,996
Fire risk 3/10 · Minor
- Est. fire insurance / yr
- $902 – $1,676
Heat risk 3/10 · Minor
- Hot days now (above 103°F)
- 7 days/yr
- Hot days in 30 yrs
- 15 days/yr
Wind risk 2/10 · Minimal
- Chance of severe wind over 30 yrs
- —
Air-quality risk 1/10 · Minimal
- Unhealthy air days now
- 0 days/yr
- Unhealthy air days in 30 yrs
- 0 days/yr
Risk factors via First Street. Map © Google.
Why this score? — see what drove the B+ grade
The composite is a weighted blend of 9 inputs, each scored 0–100. Each bar is that input's sub-score; the figure is the points it added to the 100-point composite (weight × sub-score).
- Cash flow +30.0/30.0
- DSCR +10.0/10.0
- 1% rule +9.6/10.0
- ARV discount +7.5/15.0
- Appreciation +7.4/10.0
- Schools +5.3/10.0
- Livability +3.0/5.0
- Rent growth +2.5/5.0
- Condition / age +2.5/5.0
$59,000
🖨 Deal sheet 📄 Offer letter ✓ Due diligence
Key facts
- 0.24 acre lot
- Garage
- Built 1900
Property features AI
Exterior
- Parking: Off-street parking; One-car garage
- Utilities: Electricity available; Public sewer
- Home design: Single-family residence; One story
- Construction: Frame construction; Composition roof
- Exterior features: Front porch; Wooded lot; Waterfront lot; Asphalt road access
Interior
- Flooring: Wood floors
- Heating & cooling: Electric heating; Ceiling fans; Wall air conditioning units
- Interior features: Ceiling fans; Eat-in kitchen
- Laundry & utility: Washer hookup on main level; Electric dryer hookup on main level
Neighborhood map
What this means for you Summary
Snapshot
- This is a 2-bed/1.0-bath single-family listed at $59k.
Deal economics
- At list price, monthly cash flow is $172 ($2k/yr) — positive.
- The deal already cash-flows at list — no discount required.
- Meets the 1% rule at list price ($861 rent vs $59k).
Location & tenants
- Location reads 59/100 on livability (#876 in IA) — a working-class tenant base; expect higher turnover. Strengths: cost of living A+, housing A+; Watch: amenities F, commute F, employment F.
- West Harrison Community School District (rural): math 55% / reading 65% proficiency, ranked #281 of 330 in IA (top 85%) — acceptable for families but not a draw, mixed tenant base, ~2y average lease.
- Zoned schools: West Harrison Elementary (math 54% / reading 54%, grade C, #462 of 616 statewide, top 79%, 161 students, 55% FRL); West Harrison Middle School/High School (math 57% / reading 62%, grade C+, #263 of 336 statewide, top 81%, 148 students, 43% FRL) — zoned schools average 49% FRL vs 32% district-wide (17 pts higher); higher-poverty schools than district average — tighter screening recommended.
- Market conditions: 5 active listings in the ZIP; 41 units permitted in Harrison County in 2024 (0 in 5+ unit buildings).
Forward outlook
- In year one you build about $3k of equity ($408 loan paydown + $3k appreciation (4.8% local appreciation)).
- Harrison County population projected at -26% by 2050 — secular population decline; favor cash flow + early exit over multi-decade hold.
- At projected returns (4.8% appreciation + 3.0% rent growth), your $17k cash investment doubles in ~3 years — after that, you're playing with house money.
- By year 10, paydown + projected appreciation supports a ~$32k cash-out refi (75% LTV) — recoverable capital for the next deal without selling this one.
Negotiation context
- Only 4 days on market — expect competitive offers; lowballing is unlikely to land.
Risks & watch-outs
- Watch-outs: flood insurance adds $125/mo; built in 1900 — expect roof / HVAC / electrical / plumbing capex.
- Climate carrying-cost: in FEMA flood zone A (mandatory federal flood insurance) — expect insurance premiums to compound above CPI over the hold.
Questions for the listing agent
- Built in 1900 — when were the roof, HVAC, electrical panel, plumbing, and water heater last replaced?
- What's the actual annual flood-insurance premium (NFIP or private), and is the property in a SFHA with mandatory coverage?
- Is there a deadline driving the sale (1031 exchange, divorce, estate, relocation)? That informs how much negotiation room exists.
- Schools are F-rated, which usually means shorter tenancies and higher turnover. Who's the typical renter profile here, and what's been the actual vacancy rate?
- What's the average days-on-market for RENTAL listings here right now (not sales)? A rising rental-DOM trend means longer vacancies and softer asking-rent achievability than the comps imply.
- What's the recent tenant-quality profile in this submarket — average credit score on applications, eviction rate, late-payment / NSF rate, and stable-employment percentage? A property-management company in the area should have these aggregated.
- How much new for-sale + rental construction is in the pipeline within 1–3 miles? Heavy new supply typically softens prices + rents 12–24 months out; constrained supply supports both.
Investment metrics
- 1% rule
- 1.46% ✓
- Cap rate
- 12.35%
- Cash-on-cash
- 21.62%
- DSCR
- 1.96
- GRM
- 5.7
CMA / ARV
- ARV (on-the-fly)
- $217,616
- Comps found
- 2
Show comp detail 2 sales within ~0.75 mi
| Address | Dist | Beds/Ba | Sqft | Sold | Price | $/sf | Match |
|---|---|---|---|---|---|---|---|
| 309 Polk St | 0.02mi | 2/1.0 | 852 (+5%) | 6mo | $110,000 | $129 | 85 |
| 406 E Main St | 0.41mi | 2/1.0 | 784 (-3%) | 15mo | $210,000 | $268 | 63 |
Match score weights: distance 35% · size 25% · config 20% · recency 20%. Top-matched comps best support the ARV.
Projected returns pro-forma
4.78% appreciation · 3.0% rent growth · sell at horizon
- IRR
- 23.2%
- Equity multiple
- 2.45×
- Total profit
- $23,900
- Equity at exit
- $32,632
- IRR
- 22.8%
- Equity multiple
- 4.83×
- Total profit
- $63,275
- Equity at exit
- $55,665
Cash invested: $16,520 (down + closing). Projections, not guarantees.
Landlord ↔ Tenant lean methodology
- Overall (STATE)
- 83 Strongly Landlord-Friendly
- State Iowa
- 83 Strongly Landlord-Friendly · R+6
- County
- — inherits STATE
- City
- — inherits STATE
ZIP-level market 51564
- Home prices YoY
- 4.1%
- Active inventory
- 5
- Price-to-rent
- 5.7×
Monthly cashflow live
- Estimated rent
- $861 medium interval (Pro) →
- Mortgage (P&I)
- −$309
- Tax from tax record
- −$49 /mo · $585/yr
- Insurance
- −$25
- Flood insurance flood zone
- −$125 /mo · $1,502/yr
- HOA
- −$0
- Vacancy / Maint / Mgmt
- −$181
- Net cashflow
- $172
Break-even live
UW: 25.0% down · 7.5% · 30yr · 1.5% tax · 5.0% vac · 8.0% maint · 8.0% mgmt
Financing live
Cash to close
- Down payment
- $14,750
- Closing costs
- $1,770
- Reserves months
- —
- Total cash needed
- —
Loan-product check · same deal, 3 products live
Conventional
25% down · 7.5% · 30yr
- Down + closing
- —
- Monthly P&I
- —
- Monthly cashflow
- —
- DSCR
- —
- Eligible?
- —
Personal DTI + credit; lowest rate.
DSCR
20% down · 8.5% · 30yr
- Down + closing
- —
- Monthly P&I
- —
- Monthly cashflow
- —
- DSCR
- —
- Eligible?
- —
No personal income docs; deal must DSCR.
Hard money
10% down · 12.0% · 12mo
- Down + closing
- —
- Monthly P&I
- —
- Monthly cashflow
- —
- DSCR
- —
- Eligible?
- —
Short-term bridge; refi at stabilization.
Listing history 4 events
-
2026-06-18days on market $59,000 Active 4 DOM
-
2026-06-17days on market $59,000 Active 3 DOM
-
2026-06-16days on market $59,000 Active 2 DOM
-
2026-06-15$59,000 Active 1 DOM
ⓘ Source: listings_history table (triggers on properties + properties_extension) + one-shot
backfill from property_details.listing_events for pre-trigger history.
Tax reassessment forecast IA · Partial reset (capped growth)
- Current annual tax
- $585 · $49/mo
- Projected year-2 tax
- $756 · $63/mo
- Expected delta
- +$171/yr (+$14/mo · 29.2%)
ⓘ Screening estimate from a state-policy table — verify with the county assessor before closing.
Climate risk First Street
- Flood 4/10 Moderate FEMA zone A · 22% chance over 30 yrs
- Wildfire 3/10 Moderate
- Heat 3/10 Moderate 7 d/yr ≥103°F today · 15 d/yr by 30 yrs out
- Wind 2/10 Low
- Air quality 1/10 Low 0 unhealthy d/yr today · 0 by 30 yrs out
Nearby sold comps map
Loading sold comps map…
Walkable amenities ~0.75 mi
Loading nearby amenities…
Taxation est. · year 1
- Rental income
- $10,335
- − Mortgage interest
- −$3,305
- − Property taxes
- −$585
- − Insurance
- −$1,798
- − Repairs & maintenance
- −$827
- − Management
- −$827
- − Depreciation
- −$1,716
- Taxable income
- $1,277
- Est. tax owed @ 24.0%
- −$307
- After-tax cash flow
- $1,762/yr
For passive investors: Depreciation is non-cash, so a rental often shows a tax loss while cash-flowing — sheltering income. Rental losses are passive: they offset passive income freely, and up to $25,000/yr can offset ordinary (W-2) income if you actively participate and your MAGI is under $100k (phasing out to $0 by $150k); unused losses carry forward. On sale, claimed depreciation is recaptured at up to 25%, and gains may owe capital-gains tax (a 1031 exchange can defer both). Figures are a year-1 estimate at your 24.0% rate — not tax advice; consult a CPA.
Schools (NCES district)
- District
- West Harrison Community School District
- NCES district ID
- 1930960
- Math proficiency
- 55% ▼ -15.00%
- Reading proficiency
- 65% ▼ -10.00%
- Median HH income
- $49,566
- Composite
- 52.63/100
- National rank
- #3352
- State rank
- #281 of 330 in IA
Livability — Pisgah
- Score
- 59/100
- State rank
- #876
- US rank
- #20410
Category grades
Schools grade is shown separately in the Schools card above.
Census & demographics
- Census place
- Pisgah, IA
- Population (ZIP)
- 512
Population outlook (Harrison County) Hauer SSP2
- Today (2025)
- 13,193 people
- By 2030
- 12,519 · -5.1%
- By 2040
- 11,134 · -15.6%
- By 2050
- 9,749 · -26.1%
- By 2075
- 7,254 · -45.0%
- By 2100
- 5,298 · -59.8%
Race, ethnicity, and origin ACS 2023
- Neighborhood character
- Predominantly White (100%)
- Race & ethnicity
- White 100%
- Common ancestry
- Serbian 5% Slovak 4% Iranian 1%
Political lean MEDSL · Harrison
- 2024 margin
- Solid R (+41.8) · D 28.3% · R 70.1% · Other 1.6%
- 2008→2024 swing
- -37.2pp toward R · 2008: -4.7pp · 2024: -41.8pp
- All cycles
- 2024: R+41.8 2020: R+38.4 2016: R+37.5 2012: R+12.7 2008: R+4.7
Not yet ingested
- Civics
- —
Market trends
- HPI YoY
- ▲ 4.78%
- Current HPI
- 120.0847
- Rent YoY
- —
- Metro
- —
- State GDP YoY
- ▲ 2.48%
- F500 in state
- 4
Industry mix (Fortune 500 HQ in IA)
| Industry | F500 HQs | Revenue |
|---|---|---|
| Financial Services | 1 | $16B |
|
||
| Retail / Convenience | 1 | $15B |
|
||
Price history
-15.7% since first listed2 events — show timeline
- 2026-06-12 Listed $59,000 SWIAR
- 2022-04-14 Sold (Public Records) $70,000 Public Records
Property tax history
+2.6%/yrLatest (2025): $585 · -0.5% YoY. Source: county tax records.
Cash-flow waterfall
monthlySold comps — $/sqft
last 12 mo · ≤1 miLoading sold comps…