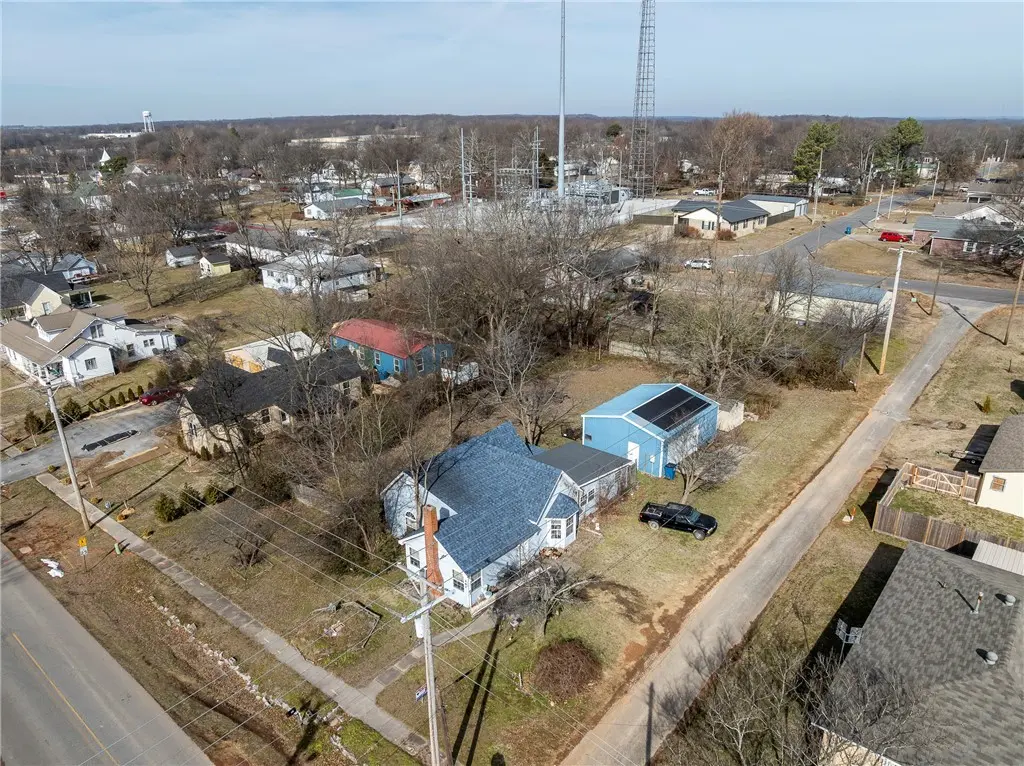
408 NE Main St · Gravette, AR
Flood risk 1/10 · Minimal
- FEMA flood zone
- X (unshaded)
- Chance of flooding over 30 yrs
- 0.0%
- Est. flood insurance / yr
- $507 – $1,088
Fire risk 5/10 · Moderate
- Est. fire insurance / yr
- $1,499 – $2,785
Heat risk 5/10 · Moderate
- Hot days now (above 107°F)
- 7 days/yr
- Hot days in 30 yrs
- 20 days/yr
Wind risk 2/10 · Minimal
- Chance of severe wind over 30 yrs
- 2.0%
Air-quality risk 2/10 · Minimal
- Unhealthy air days now
- 0 days/yr
- Unhealthy air days in 30 yrs
- 1 days/yr
Risk factors via First Street. Map © Google.
Why this score? — see what drove the C- grade
The composite is a weighted blend of 9 inputs, each scored 0–100. Each bar is that input's sub-score; the figure is the points it added to the 100-point composite (weight × sub-score).
- ARV discount +12.4/15.0
- Cash flow +12.1/30.0
- Appreciation +10.0/10.0
- Schools +4.0/10.0
- Livability +3.7/5.0
- DSCR +3.6/10.0
- Rent growth +2.5/5.0
- Condition / age +2.5/5.0
- 1% rule +2.2/10.0
$210,000
🖨 Deal sheet 📄 Offer letter ✓ Due diligence
Listing remarks
Attention investors ! Check out this 0.42 acre corner lot, close to schools and downtown, across the street from a city park, 24 x 30 metal shop and close to schools. Roof in 2025, HVAC 2020, Solar panels 2020. This has so much potential. There is potential for this lot to be split into multiple lots if the new ordinance passes in June per planning department. Remodel the existing home, add an ADU to maximize value or split and build additional or all new multi-family. Buyer to confirm what the planning options are. Don't miss your opportunity on this growing little town!
Key facts
- Multi-family
- 24 x 30 metal shop
- 0.42 acre corner lot
Tags
Property features AI
Finance
- Other: Solar panels (green feature)
- HOA & community: Monthly association fee (amount not provided); Community near schools; Community near park
Exterior
- Parking: 3 covered parking spaces
- Utilities: Public water; Sewer available; Electricity available; Natural gas available; Cable available
- Home design: Single-story home; Vinyl siding; Architectural shingle roof; Entry on main level; Facing direction not provided; Property type not specified
- Construction: Built 25+ years ago; Vinyl siding construction; Crawlspace foundation; Architectural shingle roof
- Exterior features: Gravel driveway; Partial fencing; Corner lot; City lot; Level yard; Near park; Central business district location; Public road frontage; Outbuilding; Workshop
Interior
- Kitchen: Gas range; Refrigerator
- Flooring: Carpet; Vinyl
- Bathrooms: 1 full bathroom
- Heating & cooling: Central heating; Central air conditioning
- Interior features: Eat-in kitchen; Pantry; Crawl space basement; Living room fireplace
- Laundry & utility: Gas water heater
Neighborhood map
What this means for you Summary
Snapshot
- This is a 3-bed/1.0-bath single-family listed at $210k.
Deal economics
- At list price, monthly cash flow is $-48 ($-570/yr) — negative.
- To cash-flow at today's rent, offer at most $202k (4.0% below list).
- To meet the 1% rule (rent ≥ 1% of price), the offer needs to be $151k (28.2% below list).
- Recommended offer: $151k (28.2% below list) — sets the bar for 1% rule.
- Cap rate 6.0% vs local median 2.8% in Gravette — top-decile yield for the area; either an underpriced asset or a hidden risk that comps aren't pricing in. Stress-test before assuming the spread holds.
Location & tenants
- Location reads 73/100 on livability (#25 in AR) — a middle-class / working-renter tenant base. Strengths: cost of living A+, housing A+, health & safety A+; Watch: employment C-, amenities F, commute F.
- Gravette School District (rural): math 49% / reading 45% proficiency, ranked #26 of 238 in AR (top 11%) — families likely to look elsewhere, expect single-tenant / working-renter base with shorter leases.
- Market conditions: 170 active listings in the ZIP; 9 comparable units currently listed for rent nearby; rentals at typical pace (median 21d on market — plan ~3-4 weeks tenant-placement turnaround); 44% of comp listings sitting > 30 days — soft ceiling on asking rent; 4,359 units permitted in Benton County in 2024 (402 in 5+ unit buildings).
Forward outlook
- In year one you build about $22k of equity ($1k loan paydown + $21k appreciation (10.0% local appreciation)).
- Benton County population projected at +56% by 2050 — long-run rental-demand tailwind backs the buy-and-hold thesis.
- At projected returns (10.0% appreciation + 3.0% rent growth), your $59k cash investment doubles in ~3 years — after that, you're playing with house money.
- By year 2, paydown + projected appreciation supports a ~$36k cash-out refi (75% LTV) — recoverable capital for the next deal without selling this one.
Negotiation context
- It's been on market 45 days — a 3% lower offer ($204k) is reasonable based on typical stale-listing flexibility.
- Current owner paid $72k; list at $210k implies a 192% gain — meaningful room to come down on a strong offer.
Risks & watch-outs
- Climate carrying-cost: moderate wildfire risk; extreme-heat days projected 7→20/yr by 2055 (HVAC capex compounding) — expect insurance premiums to compound above CPI over the hold.
Questions for the listing agent
- What do current leases actually rent for vs. the listed asking? Can we see a recent rent roll and the last 12 months of T-12 income?
- It's been on market 45 days. Have you received any prior offers? Is the seller open to a 28% concession, seller financing, or rate buy-down credit?
- Is there a deadline driving the sale (1031 exchange, divorce, estate, relocation)? That informs how much negotiation room exists.
- What's the average days-on-market for RENTAL listings here right now (not sales)? A rising rental-DOM trend means longer vacancies and softer asking-rent achievability than the comps imply.
- What's the recent tenant-quality profile in this submarket — average credit score on applications, eviction rate, late-payment / NSF rate, and stable-employment percentage? A property-management company in the area should have these aggregated.
- How much new for-sale + rental construction is in the pipeline within 1–3 miles? Heavy new supply typically softens prices + rents 12–24 months out; constrained supply supports both.
Investment metrics
- 1% rule
- 0.72% ✗
- Cap rate
- 6.02%
- Cash-on-cash
- -0.97%
- DSCR
- 0.96
- GRM
- 11.6
CMA / ARV
- ARV (median comp)
- $235,841
- List price
- $210,000
- Delta
- -10.96%
- Verdict
- UNDERPRICED
- Comps
- 20 within 1.0 mi
Show comp detail 12 sales within ~0.75 mi
| Address | Dist | Beds/Ba | Sqft | Sold | Price | $/sf | Match |
|---|---|---|---|---|---|---|---|
| 505 Birmingham St | 0.16mi | 3/2.5 | 1,734 (+6%) | 3mo | $295,000 | $170 | 74 |
| 304 Akron St | 0.11mi | 2/2.0 (-1) | 1,500 (-8%) | 1mo | $265,000 | $177 | 71 |
| 608 NE Detroit St | 0.27mi | 3/1.0 | 1,442 (-12%) | 6mo | $250,000 | $173 | 62 |
| 802 SE 2nd Ave | 0.54mi | 3/2.0 | 1,601 (-2%) | 6mo | $236,000 | $147 | 62 |
| 508 2nd Ave | 0.35mi | 3/1.0 | 1,400 (-14%) | 6mo | $216,000 | $154 | 54 |
| 111 5th Ave | 0.54mi | 4/1.0 (+1) | 1,541 (-6%) | 7mo | $175,000 | $114 | 54 |
| 500 Eagle Dr | 0.66mi | 3/2.0 | 1,495 (-9%) | 0mo | $282,500 | $189 | 50 |
| 503 SE 6th Ave | 0.31mi | 3/2.0 | 1,443 (-12%) | 14mo | $250,000 | $173 | 50 |
| 105 Deer Ridge Rd | 0.68mi | 3/2.0 | 1,596 (-2%) | 13mo | $260,000 | $163 | 50 |
| 613 Eagle Dr | 0.52mi | 3/2.0 | 1,504 (-8%) | 15mo | $275,000 | $183 | 46 |
| 405 Lion Dr | 0.57mi | 3/2.0 | 1,505 (-8%) | 15mo | $275,000 | $183 | 43 |
| 106 N Lion Dr | 0.67mi | 4/2.0 (+1) | 1,759 (+8%) | 8mo | $340,000 | $193 | 41 |
Match score weights: distance 35% · size 25% · config 20% · recency 20%. Top-matched comps best support the ARV.
Projected returns pro-forma
10.0% appreciation · 3.0% rent growth · sell at horizon
- IRR
- 23.6%
- Equity multiple
- 2.89×
- Total profit
- $111,237
- Equity at exit
- $189,185
- IRR
- 20.9%
- Equity multiple
- 6.61×
- Total profit
- $329,740
- Equity at exit
- $407,984
Cash invested: $58,800 (down + closing). Projections, not guarantees.
Landlord ↔ Tenant lean methodology
- Overall (STATE)
- 92 Strongly Landlord-Friendly
- State Arkansas
- 92 Strongly Landlord-Friendly · R+14
- County
- — inherits STATE
- City
- — inherits STATE
ZIP-level market 72736
- Home prices YoY
- 20.1%
- Active inventory
- 170
- Price-to-rent
- 11.6×
Monthly cashflow live
- Estimated rent
- $1,507 high interval (Pro) →
- Mortgage (P&I)
- −$1,101
- Tax from tax record
- −$49 /mo · $591/yr
- Insurance
- −$88
- HOA
- −$0
- Vacancy / Maint / Mgmt
- −$316
- Net cashflow
- $-48
Break-even live
UW: 25.0% down · 7.5% · 30yr · 1.5% tax · 5.0% vac · 8.0% maint · 8.0% mgmt
Financing live
Cash to close
- Down payment
- $52,500
- Closing costs
- $6,300
- Reserves months
- —
- Total cash needed
- —
Loan-product check · same deal, 3 products live
Conventional
25% down · 7.5% · 30yr
- Down + closing
- —
- Monthly P&I
- —
- Monthly cashflow
- —
- DSCR
- —
- Eligible?
- —
Personal DTI + credit; lowest rate.
DSCR
20% down · 8.5% · 30yr
- Down + closing
- —
- Monthly P&I
- —
- Monthly cashflow
- —
- DSCR
- —
- Eligible?
- —
No personal income docs; deal must DSCR.
Hard money
10% down · 12.0% · 12mo
- Down + closing
- —
- Monthly P&I
- —
- Monthly cashflow
- —
- DSCR
- —
- Eligible?
- —
Short-term bridge; refi at stabilization.
Rent comps 9 comps
| Address | Beds | Baths | Sqft | Rent | $/sqft | DOM | Units | Dist |
|---|---|---|---|---|---|---|---|---|
| 408 2nd Ave SE Gravette, AR | 3.0 | 2.5 | 1200 | $1,500 | $1.25 | 43d | 1 | 0.28mi |
| 606 Elgin St NE Gravette, AR | 3.0 | 2.0 | 1152 | $1,400 | $1.22 | 43d | 1 | 0.36mi |
| 803 Granite Cir SW Gravette, AR | 3.0 | 2.0 | 1263 | $1,375 | $1.09 | 21d | 1 | 0.85mi |
| 820 Baker St NW Gravette, AR | 3.0 | 2.5 | 1456 | $1,490 | $1.02 | 13d | 1 | 0.91mi |
| 201 Tricha Cir SW Gravette, AR | 3.0 | 2.0 | 1742 | $2,095 | $1.20 | 13d | 1 | 0.97mi |
| 840 Baker St NW Unit 840 Gravette, AR | 3.0 | 2.5 | 1450 | $1,450 | $1.00 | 43d | 1 | 0.99mi |
| 840 Baker St NW Gravette, AR | 3.0 | 2.5 | 1456 | $1,450 | $1.00 | 14d | 1 | 0.99mi |
| 202 Tricha Cir SW Unit B Gravette, AR | 3.0 | 2.0 | 1791 | $1,450 | $0.81 | 43d | 1 | 1.00mi |
| 305 Tricha Cir Unit B Gravette, AR | 3.0 | 2.0 | 1791 | $1,450 | $0.81 | 13d | 1 | 1.05mi |
Listing history 21 events
-
2026-06-18days on market $210,000 Active 45 DOM
-
2026-06-17days on market $210,000 Active 44 DOM
-
2026-06-16days on market $210,000 Active 43 DOM
-
2026-06-15days on market $210,000 Active 42 DOM
-
2026-06-14days on market $210,000 Active 40 DOM
-
2026-06-13days on market $210,000 Active 39 DOM
-
2026-06-10days on market $210,000 Active 37 DOM
-
2026-06-09days on market $210,000 Active 36 DOM
-
2026-06-08days on market $210,000 Active 35 DOM
-
2026-06-07days on market $210,000 Active 34 DOM
-
2026-06-05days on market $210,000 Active 31 DOM
-
2026-06-03days on market $210,000 Active 30 DOM
-
2026-06-02days on market $210,000 Active 29 DOM
-
2026-06-01days on market $210,000 Active 28 DOM
-
2026-05-31days on market $210,000 Active 27 DOM
-
2026-05-31days on market $210,000 Active 26 DOM
-
2026-05-03$210,000 Active 578-char remark
-
2026-03-19price $225,000
-
2026-02-24price $230,000
-
2007-08-02soldstatus $72,000
-
2003-04-30soldstatus $19,000
ⓘ Source: listings_history table (triggers on properties + properties_extension) + one-shot
backfill from property_details.listing_events for pre-trigger history.
Tax reassessment forecast AR · Resets to sale price
- Current annual tax
- $591 · $49/mo
- Projected year-2 tax
- $1,344 · $112/mo
- Expected delta
- +$753/yr (+$63/mo · 127.4%)
ⓘ Screening estimate from a state-policy table — verify with the county assessor before closing.
Climate risk First Street
- Flood 1/10 Low FEMA zone X (unshaded) · 0% chance over 30 yrs
- Wildfire 5/10 Major
- Heat 5/10 Major 7 d/yr ≥107°F today · 20 d/yr by 30 yrs out
- Wind 2/10 Low 2% chance of damaging wind over 30 yrs
- Air quality 2/10 Low 0 unhealthy d/yr today · 1 by 30 yrs out
Nearby sold comps map
Loading sold comps map…
Walkable amenities ~0.75 mi
Loading nearby amenities…
Taxation est. · year 1
- Rental income
- $18,084
- − Mortgage interest
- −$11,763
- − Property taxes
- −$591
- − Insurance
- −$1,050
- − Repairs & maintenance
- −$1,447
- − Management
- −$1,447
- − Depreciation
- −$6,109
- Taxable loss
- −$4,323
- Est. tax savings @ 24.0%
- +$1,038
- After-tax cash flow
- $467/yr
For passive investors: Depreciation is non-cash, so a rental often shows a tax loss while cash-flowing — sheltering income. Rental losses are passive: they offset passive income freely, and up to $25,000/yr can offset ordinary (W-2) income if you actively participate and your MAGI is under $100k (phasing out to $0 by $150k); unused losses carry forward. On sale, claimed depreciation is recaptured at up to 25%, and gains may owe capital-gains tax (a 1031 exchange can defer both). Figures are a year-1 estimate at your 24.0% rate — not tax advice; consult a CPA.
Schools (NCES district)
- District
- Gravette School District
- NCES district ID
- 0506840
- Math proficiency
- 49% ▼ -11.00%
- Reading proficiency
- 45% ▼ -10.00%
- Median HH income
- $50,964
- Composite
- 40.41/100
- National rank
- #3728
- State rank
- #26 of 238 in AR
Livability — Gravette
- Score
- 73/100
- State rank
- #25
- US rank
- #5462
Category grades
Schools grade is shown separately in the Schools card above.
Census & demographics
- Census place
- Gravette, AR
- City population
- 8,013
- Population (ZIP)
- 7,519
Population outlook (Benton County) Hauer SSP2
- Today (2025)
- 318,683 people
- By 2030
- 353,481 · +10.9%
- By 2040
- 425,280 · +33.4%
- By 2050
- 497,239 · +56.0%
- By 2075
- 662,114 · +107.8%
- By 2100
- 776,431 · +143.6%
Race, ethnicity, and origin ACS 2023
- Neighborhood character
- Predominantly White (77%)
- Race & ethnicity
- White 77% Two or more races 19% Hispanic / Latino 3%
- Common ancestry
- Serbian 3% Lithuanian 2% Slovak 2%
- Foreign-born
- 1%
- Languages at home
- 99% English-only · Spanish 1%
Political lean MEDSL · Benton
- 2024 margin
- Strong R (+27.0) · D 35.2% · R 62.1% · Other 2.7%
- 2008→2024 swing
- +9.6pp toward D · 2008: -36.5pp · 2024: -27.0pp
- All cycles
- 2024: R+27.0 2020: R+26.4 2016: R+34.9 2012: R+40.4 2008: R+36.5
Not yet ingested
- Civics
- —
Market trends
- HPI YoY
- ▲ 85.16%
- Current HPI
- 508.2507
- Rent YoY
- —
- Metro
- —
- State GDP YoY
- ▲ 3.80%
- F500 in state
- 10
Industry mix (Fortune 500 HQ in AR)
| Industry | F500 HQs | Revenue |
|---|---|---|
| Retail | 1 | $681B |
|
||
| Food / Agriculture | 1 | $53B |
|
||
| Retail / Energy | 1 | $22B |
|
||
| Transportation / Logistics | 1 | $12B |
|
||
| Energy | 1 | $4B |
|
||
Price history
+1005.3% since first listed5 events — show timeline
- 2026-05-03 Listed $210,000 NWARMLS
- 2026-03-19 Price Changed $225,000 NWARMLS
- 2026-02-24 Price Changed $230,000 NWARMLS
- 2007-08-02 Sold (Public Records) $72,000 Public Records
- 2003-04-30 Sold (Public Records) $19,000 Public Records
Property tax history
+0.1%/yrLatest (2025): $591 · -5.3% YoY. Source: county tax records.
Cash-flow waterfall
monthlySold comps — $/sqft
last 12 mo · ≤1 miLoading sold comps…