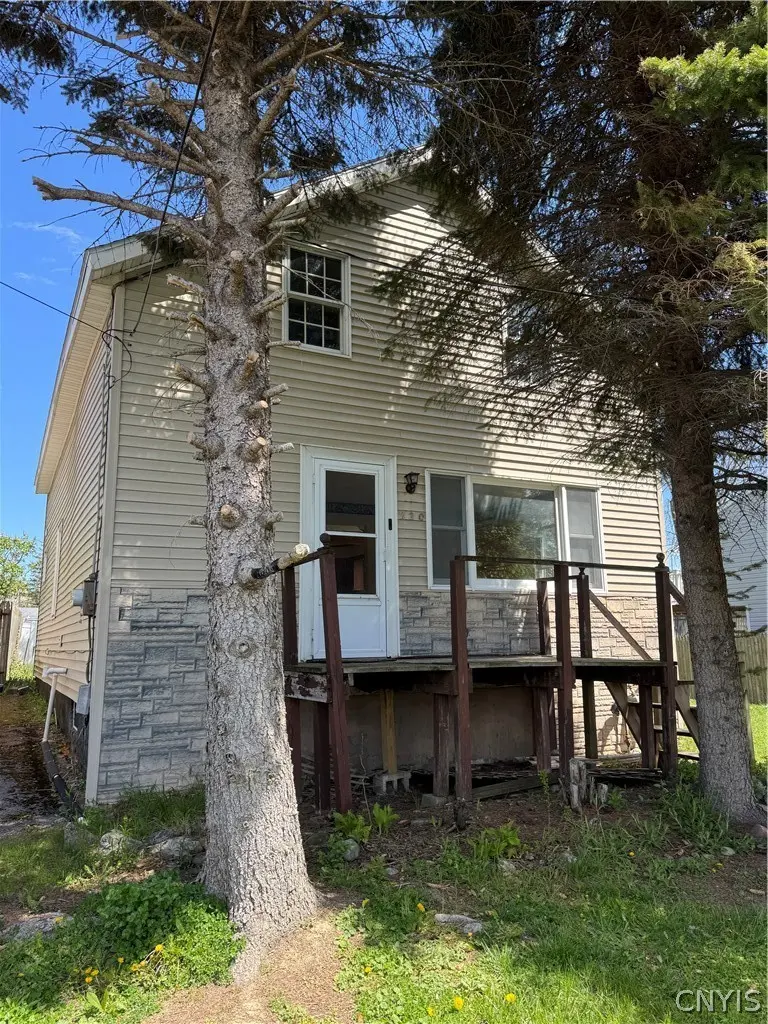
220 Westover St · Fairmount, NY
Flood risk 1/10 · Minimal
- FEMA flood zone
- X (unshaded)
- Chance of flooding over 30 yrs
- 0.0%
- Est. flood insurance / yr
- $473 – $860
Fire risk 1/10 · Minimal
- Est. fire insurance / yr
- $691 – $1,283
Heat risk 3/10 · Minor
- Hot days now (above 94°F)
- 7 days/yr
- Hot days in 30 yrs
- 16 days/yr
Wind risk 1/10 · Minimal
- Chance of severe wind over 30 yrs
- 1.0%
Air-quality risk 2/10 · Minimal
- Unhealthy air days now
- 0 days/yr
- Unhealthy air days in 30 yrs
- 1 days/yr
Risk factors via First Street. Map © Google.
Why this score? — see what drove the B+ grade
The composite is a weighted blend of 9 inputs, each scored 0–100. Each bar is that input's sub-score; the figure is the points it added to the 100-point composite (weight × sub-score).
- Cash flow +30.0/30.0
- ARV discount +15.0/15.0
- 1% rule +10.0/10.0
- DSCR +10.0/10.0
- Schools +5.1/10.0
- Livability +3.6/5.0
- Rent growth +2.5/5.0
- Condition / age +2.5/5.0
- Appreciation +0.0/10.0
$129,900
🖨 Deal sheet 📄 Offer letter ✓ Due diligence
Listing remarks
Opportunity awaits in this 3-bedroom, 1 full bath home located in the desirable West Genesee Central School District. Perfect for investors, handy buyers, or anyone looking to build equity, this home offers solid potential with a little vision and updating. Features include an eat-in kitchen, spacious living areas, a partially fenced yard, and a deck ideal for outdoor enjoyment. Whether you're looking for your next renovation project or a chance to create a home of your own, this property is full of possibilities. * * * Seller is requesting all final and best offers to be in by Thursday, 5/14 at noon. * * *
Key facts
- Deck
- Eat-in kitchen
- 6,250 sq ft lot
Tags
Property features AI
Exterior
- Parking: No garage
- Utilities: Public water (connected); Sewer connected; Cable available; Circuit breaker electrical
- Home design: Single-story home; Vinyl siding; Resale property
- Construction: Block foundation; Vinyl siding construction; Existing (year built details)
- Exterior features: Deck; Blacktop driveway; Partial fencing; Shed(s)/storage
Interior
- Kitchen: Gas range; Gas oven; Refrigerator
- Bedrooms: Total of 5 rooms (includes bedroom spaces)
- Flooring: Carpet; Laminate; Varies
- Bathrooms: 1 full bathroom (main level)
- Heating & cooling: Gas forced-air heating; Central air conditioning
- Interior features: Eat-in kitchen; Sliding glass door(s); Sliding doors
- Laundry & utility: Main level laundry; Washer; Dryer; Gas water heater
Neighborhood map
What this means for you Summary
Snapshot
- This is a 3-bed/1.0-bath single-family listed at $130k.
Deal economics
- At list price, monthly cash flow is $590 ($7k/yr) — positive.
- The deal already cash-flows at list — no discount required.
- Meets the 1% rule at list price ($2k rent vs $130k).
- Cap rate 11.7% vs local median 4.1% in Fairmount — top-decile yield for the area; either an underpriced asset or a hidden risk that comps aren't pricing in. Stress-test before assuming the spread holds.
Location & tenants
- Location reads 72/100 on livability (#366 in NY) — a middle-class / working-renter tenant base. Strengths: housing A+, health & safety A+, employment A-; Watch: schools C-, crime D, amenities F.
- West Genesee Central School District (suburban): math 56% / reading 61% proficiency, ranked #241 of 590 in NY (top 41%) — acceptable for families but not a draw, mixed tenant base, ~2y average lease; only 15% free/reduced lunch — higher-income household profile.
- Market conditions: 59 active listings in the ZIP; 4 comparable units currently listed for rent nearby; rentals at typical pace (median 21d on market — plan ~3-4 weeks tenant-placement turnaround); 616 units permitted in Onondaga County in 2024 (256 in 5+ unit buildings).
- This rent runs 38% of the median local income ($68k/yr) — at the standard rent-burdened threshold; future hikes will face affordability resistance.
Forward outlook
- Local home prices are declining (-3.0%/yr); year-one equity from $898 of loan paydown is wiped out by about $4k of value loss. Plan a longer hold.
- Onondaga County population projected to shrink 9% by 2050 — rents likely to lag national; underwrite the cash flow, not the appreciation.
- At projected returns (-3.0% appreciation + 3.0% rent growth), your $36k cash investment doubles in ~7 years — after that, you're playing with house money.
Negotiation context
- Only 7 days on market — expect competitive offers; lowballing is unlikely to land.
- Current owner paid $80k; list at $130k implies a 62% gain — meaningful room to come down on a strong offer.
Risks & watch-outs
- Watch-outs: property tax is 3.6% of price; built in 1940 — expect roof / HVAC / electrical / plumbing capex.
Questions for the listing agent
- Built in 1940 — when were the roof, HVAC, electrical panel, plumbing, and water heater last replaced?
- Property tax is high relative to price — has the assessment been appealed recently, and will the sale trigger a re-assessment?
- Is there a deadline driving the sale (1031 exchange, divorce, estate, relocation)? That informs how much negotiation room exists.
- Crime grade is D in this area — have there been break-ins, vandalism, or insurance claims at this property in the last 3 years? What carrier currently insures it and at what premium?
- What's the average days-on-market for RENTAL listings here right now (not sales)? A rising rental-DOM trend means longer vacancies and softer asking-rent achievability than the comps imply.
- What's the recent tenant-quality profile in this submarket — average credit score on applications, eviction rate, late-payment / NSF rate, and stable-employment percentage? A property-management company in the area should have these aggregated.
- How much new for-sale + rental construction is in the pipeline within 1–3 miles? Heavy new supply typically softens prices + rents 12–24 months out; constrained supply supports both.
Investment metrics
- 1% rule
- 1.67% ✓
- Cap rate
- 11.75%
- Cash-on-cash
- 19.48%
- DSCR
- 1.87
- GRM
- 5.0
CMA / ARV
- ARV (median comp)
- $254,662
- List price
- $129,900
- Delta
- -48.99%
- Verdict
- UNDERPRICED
- Comps
- 20 within 1.0 mi
Show comp detail 12 sales within ~0.75 mi
| Address | Dist | Beds/Ba | Sqft | Sold | Price | $/sf | Match |
|---|---|---|---|---|---|---|---|
| 3759 Warners Rd | 0.13mi | 3/1.0 | 1,578 (+13%) | 2mo | $247,000 | $157 | 71 |
| 119 Suffolk Rd | 0.28mi | 3/2.0 | 1,456 (+4%) | 8mo | $291,500 | $200 | 70 |
| 3780 Neptune Ln | 0.30mi | 2/2.0 (-1) | 1,436 (+3%) | 7mo | $350,000 | $244 | 67 |
| 210 Turner Ave | 0.57mi | 3/1.0 | 1,456 (+4%) | 5mo | $240,000 | $165 | 63 |
| 209 Patterson Ave | 0.56mi | 3/1.5 | 1,436 (+3%) | 8mo | $271,000 | $189 | 61 |
| 108 Matterson Ave | 0.25mi | 3/1.5 | 1,203 (-14%) | 7mo | $272,000 | $226 | 57 |
| 5 Elm Hill Way | 0.66mi | 3/2.5 | 1,416 (+1%) | 7mo | $320,000 | $226 | 55 |
| 416 Mackay Ave | 0.47mi | 2/1.5 (-1) | 1,536 (+10%) | 2mo | $226,000 | $147 | 54 |
| 209 Mackay Ave | 0.61mi | 4/2.0 (+1) | 1,344 (-4%) | 5mo | $268,000 | $199 | 52 |
| 254 Germania Ave | 0.59mi | 3/1.0 | 1,250 (-11%) | 8mo | $150,000 | $120 | 48 |
| 106 Mackay Ave | 0.74mi | 3/1.5 | 1,500 (+7%) | 9mo | $240,000 | $160 | 44 |
| 101 Mackay Ave | 0.74mi | 3/1.0 | 1,552 (+11%) | 7mo | $210,000 | $135 | 41 |
Match score weights: distance 35% · size 25% · config 20% · recency 20%. Top-matched comps best support the ARV.
Projected returns pro-forma
-3.0% appreciation · 3.0% rent growth · sell at horizon
- IRR
- 11.6%
- Equity multiple
- 1.46×
- Total profit
- $16,720
- Equity at exit
- $19,369
- IRR
- 20.6%
- Equity multiple
- 2.75×
- Total profit
- $63,664
- Equity at exit
- $11,231
Cash invested: $36,372 (down + closing). Projections, not guarantees.
Landlord ↔ Tenant lean methodology
- Overall (STATE)
- 15 Strongly Tenant-Friendly
- State New York
- 15 Strongly Tenant-Friendly · D+10
- County
- — inherits STATE
- City
- — inherits STATE
ZIP-level market 13209
- Home prices YoY
- -7.7%
- Active inventory
- 59
- Price-to-rent
- 5.0×
Monthly cashflow live
- Estimated rent
- $2,165 medium interval (Pro) →
- Mortgage (P&I)
- −$681
- Tax from tax record
- −$385 /mo · $4,618/yr
- Insurance
- −$54
- HOA
- −$0
- Vacancy / Maint / Mgmt
- −$455
- Net cashflow
- $590
Break-even live
UW: 25.0% down · 7.5% · 30yr · 1.5% tax · 5.0% vac · 8.0% maint · 8.0% mgmt
Financing live
Cash to close
- Down payment
- $32,475
- Closing costs
- $3,897
- Reserves months
- —
- Total cash needed
- —
Loan-product check · same deal, 3 products live
Conventional
25% down · 7.5% · 30yr
- Down + closing
- —
- Monthly P&I
- —
- Monthly cashflow
- —
- DSCR
- —
- Eligible?
- —
Personal DTI + credit; lowest rate.
DSCR
20% down · 8.5% · 30yr
- Down + closing
- —
- Monthly P&I
- —
- Monthly cashflow
- —
- DSCR
- —
- Eligible?
- —
No personal income docs; deal must DSCR.
Hard money
10% down · 12.0% · 12mo
- Down + closing
- —
- Monthly P&I
- —
- Monthly cashflow
- —
- DSCR
- —
- Eligible?
- —
Short-term bridge; refi at stabilization.
Rent comps 4 comps
| Address | Beds | Baths | Sqft | Rent | $/sqft | DOM | Units | Dist |
|---|---|---|---|---|---|---|---|---|
| 8 Kings Ct Camillus, NY | 1.0–2.0 | 1.0–2.0 | 994 | $1,855 | $1.87 | 13d | 5 | 0.41mi |
| 189 Lookout Cir Syracuse, NY | 2.0 | 1.5 | 1304 | $2,200 | $1.69 | 43d | 1 | 0.81mi |
| 130 Saddlestone Pl Camillus, NY | 1.0–2.0 | 1.0–2.0 | 989 | $2,065 | $2.09 | 13d | 7 | 0.92mi |
| 113 Weeping Willow Way Camillus, NY | 3.0 | 2.5 | 1800 | $3,850 | $2.14 | 20d | 1 | 1.46mi |
Listing history 3 events
-
2026-05-17status Pending 618-char remark
-
2026-05-10$129,900 Active 618-char remark
-
2004-09-27soldstatus $79,950
ⓘ Source: listings_history table (triggers on properties + properties_extension) + one-shot
backfill from property_details.listing_events for pre-trigger history.
Tax reassessment forecast NY · Partial reset (capped growth)
- Current annual tax
- $4,618 · $385/mo
- Projected year-2 tax
- $4,618 · $385/mo
- Expected delta
- $0/yr ($0/mo · 0.0%)
ⓘ Screening estimate from a state-policy table — verify with the county assessor before closing.
Climate risk First Street
- Flood 1/10 Low FEMA zone X (unshaded) · 0% chance over 30 yrs
- Wildfire 1/10 Low
- Heat 3/10 Moderate 7 d/yr ≥94°F today · 16 d/yr by 30 yrs out
- Wind 1/10 Low 100% chance of damaging wind over 30 yrs
- Air quality 2/10 Low 0 unhealthy d/yr today · 1 by 30 yrs out
Nearby sold comps map
Loading sold comps map…
Walkable amenities ~0.75 mi
Loading nearby amenities…
Taxation est. · year 1
- Rental income
- $25,983
- − Mortgage interest
- −$7,276
- − Property taxes
- −$4,618
- − Insurance
- −$650
- − Repairs & maintenance
- −$2,079
- − Management
- −$2,079
- − Depreciation
- −$3,779
- Taxable income
- $5,503
- Est. tax owed @ 24.0%
- −$1,321
- After-tax cash flow
- $5,764/yr
For passive investors: Depreciation is non-cash, so a rental often shows a tax loss while cash-flowing — sheltering income. Rental losses are passive: they offset passive income freely, and up to $25,000/yr can offset ordinary (W-2) income if you actively participate and your MAGI is under $100k (phasing out to $0 by $150k); unused losses carry forward. On sale, claimed depreciation is recaptured at up to 25%, and gains may owe capital-gains tax (a 1031 exchange can defer both). Figures are a year-1 estimate at your 24.0% rate — not tax advice; consult a CPA.
Schools (NCES district)
- District
- West Genesee Central School District
- NCES district ID
- 3630630
- Math proficiency
- 56% ▼ -13.00%
- Reading proficiency
- 61% ▲ 3.00%
- Median HH income
- $65,588
- Composite
- 51.31/100
- National rank
- #1745
- State rank
- #241 of 590 in NY
Livability — Fairmount
- Score
- 72/100
- State rank
- #366
- US rank
- #6334
Category grades
Schools grade is shown separately in the Schools card above.
Census & demographics
- County
- Onondaga County · 247,257 people
- Metro
- Syracuse, NY
- Population (ZIP)
- 12,714
- Household income
- $68,138
- Rent vs Own
- Severe rent burden
- 210.0
Population outlook (Onondaga County) Hauer SSP2
- Today (2025)
- 467,894 people
- By 2030
- 463,381 · -1.0%
- By 2040
- 447,697 · -4.3%
- By 2050
- 426,399 · -8.9%
- By 2075
- 373,661 · -20.1%
- By 2100
- 307,967 · -34.2%
Race, ethnicity, and origin ACS 2023
- Neighborhood character
- Predominantly White (86%)
- Race & ethnicity
- White 86% Two or more races 6% Hispanic / Latino 6% Black 3%
- Hispanic origin (detail)
- Mexican 1% Puerto Rican 4%
- Common ancestry
- Romanian 11% Subsaharan African 6% Lithuanian 2%
- Foreign-born
- 11% · Canada, China
- Languages at home
- 87% English-only · Russian/Polish/Slavic 5% Spanish 3% Arabic 2%
Political lean MEDSL · Onondaga
- 2024 margin
- D (+17.3) · D 58.6% · R 41.4%
- 2008→2024 swing
- -3.0pp toward R · 2008: 20.3pp · 2024: 17.3pp
- All cycles
- 2024: D+17.3 2020: D+20.6 2016: D+12.8 2012: D+21.1 2008: D+20.3
Not yet ingested
- Civics
- —
Market trends
- HPI YoY
- ▼ -27.23%
- Current HPI
- 326.7671
- Rent YoY
- —
- Metro
- Syracuse, NY
- State GDP YoY
- ▲ 2.60%
- F500 in state
- 92
Industry mix (Fortune 500 HQ in NY)
| Industry | F500 HQs | Revenue |
|---|---|---|
| Financial Services | 10 | $950B |
|
||
| Consumer Goods | 9 | $162B |
|
||
| Insurance | 4 | $225B |
|
||
| Telecommunications | 2 | $144B |
|
||
| Pharmaceuticals | 2 | $112B |
|
||
| Media / Entertainment | 2 | $69B |
|
||
Price history
+62.5% since first listed3 events — show timeline
- 2026-05-17 Pending — CNYIS
- 2026-05-10 Listed $129,900 CNYIS
- 2004-09-27 Sold (Public Records) $79,950 Public Records
Property tax history
+3.7%/yrLatest (2025): $4,618 · +5.4% YoY. Source: county tax records.
Cash-flow waterfall
monthlySold comps — $/sqft
last 12 mo · ≤1 miLoading sold comps…